

Percentage fat fraction in magnetic resonance imaging: upgrading the osteoporosis-detecting parameter
- PMID: 32183731
- PMCID: PMC7079407
- DOI: 10.1186/s12880-020-00423-0
Percentage fat fraction in magnetic resonance imaging: upgrading the osteoporosis-detecting parameter
Abstract
Background: Osteoporosis (OP) is a systemic metabolic bone disorder identified as an essential health issue worldwide. Orthopedic imaging approaches were commonly used with some limitations. Thus, our study aimed to investigate the diagnostic value of magnetic resonance spectroscopy (1-H MRS) and m-Dixon-Quant in OP.
Methods: A total of 76 subjects were enrolled in the study and bone mineral density (BMD) was measured using quantitative computed tomography (QCT). Then, the subjects were divided into three groups according to BMD: normal control group, osteopenia group and OP group. The following parameters were recorded for each patient: gender, age, height, body weight, waist circumference, and hip circumference. Further, the fat fraction percentage (FF%) values were determined by 1-H MRS and m-Dixon-Quant methods.
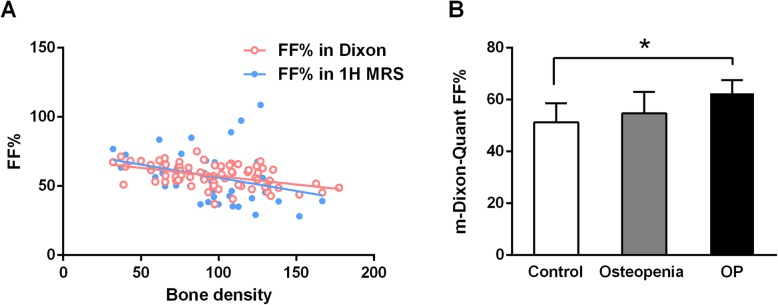
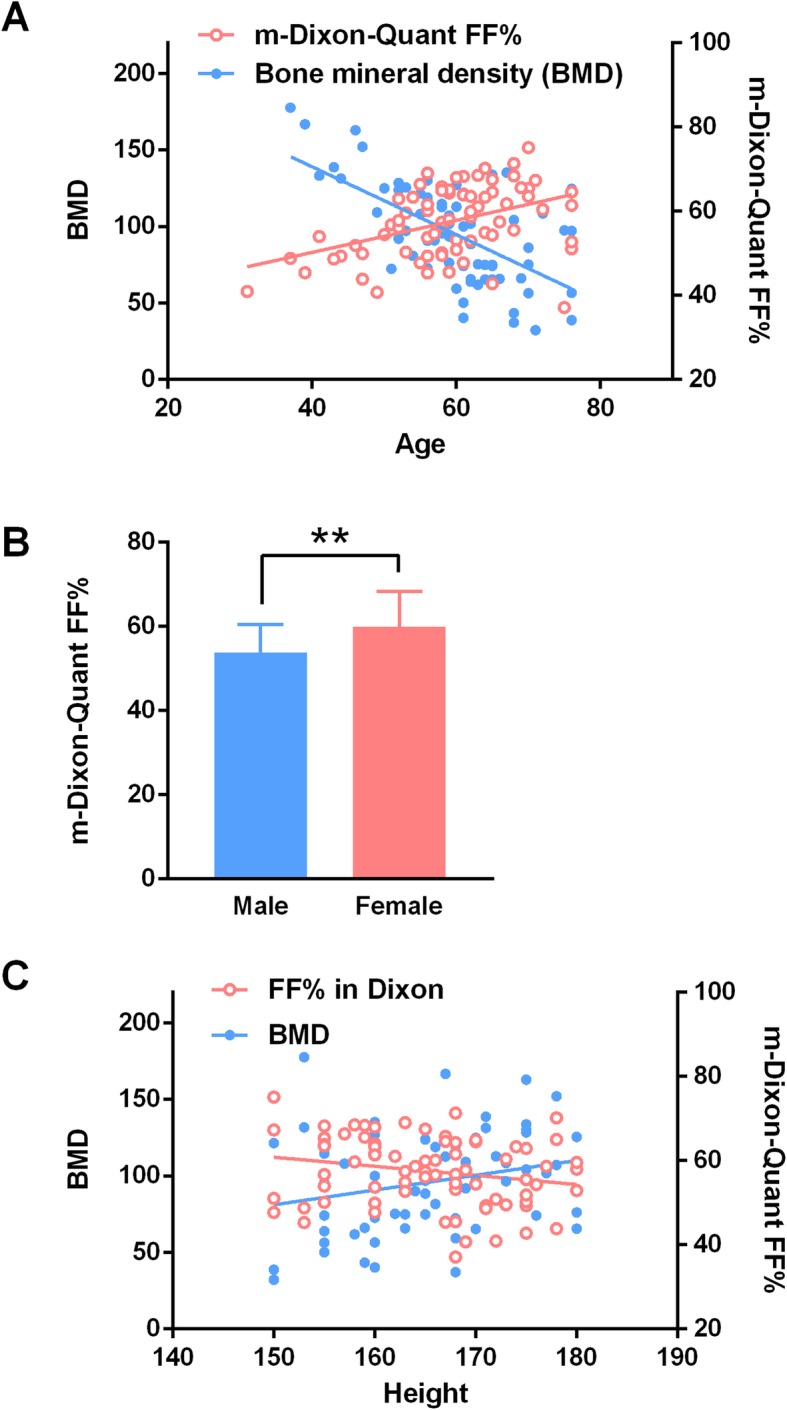
Results: In both 1-H MRS and magnetic resonance Imaging (MRI) m-Dixon-Quant, the FF% exhibited a negative correlation with BMD (P < 0.05). The FF% value of the OP group was significantly higher than that of the control group (P < 0.05). In addition, the FF% value in the m-Dixon scans was positively related to age, while BMD showed a negative linear relationship with age (P < 0.0001). Further, females had a significantly higher FF% value compared to males (P < 0.01), and height was correlated with BMD (P < 0.05) but not with FF% (P > 0.05).
Conclusions: MRI investigations especially FF% value in the m-Dixon-Quant imaging system is correlated with OP. Its diagnostic value remains to be demonstrated on a large prospective cohort of patients. Besides, parameters such as age, gender, and height are important factors for predicting and diagnosing OP.
Keywords: Bone mineral density; Fat fraction; MRI m-Dixon-quant; Magnetic resonance spectroscopy; Osteoporosis.
Conflict of interest statement
The authors declare that they have no competing interests.
Figures
References
-
- Karahan AY, Kaya B, Kuran B, Altındag O, Yildirim P, Dogan SC, Basaran A, Salbas E, Altınbilek T, Guler T. Common mistakes in the dual-energy X-ray absorptiometry (DXA) in Turkey. A retrospective descriptive multicenter study. Acta Med Austriaca. 2017;59(4):117–123. - PubMed
-
- Jarraya M, Hayashi D, Griffith JF, Guermazi A, Genant HK. Identification of Vertebral Fractures. 2013.
-
- Bouxsein ML, Seeman E. Quantifying the material and structural determinants of bone strength. 23(6):741–53. - PubMed
Publication types
MeSH terms
LinkOut - more resources
Full Text Sources
Medical
Miscellaneous
