

Different ODE models of tumor growth can deliver similar results
- PMID: 32183732
- PMCID: PMC7076937
- DOI: 10.1186/s12885-020-6703-0
Different ODE models of tumor growth can deliver similar results
Abstract
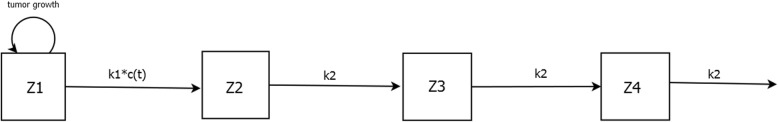
Background: Simeoni and colleagues introduced a compartmental model for tumor growth that has proved quite successful in modeling experimental therapeutic regimens in oncology. The model is based on a system of ordinary differential equations (ODEs), and accommodates a lag in therapeutic action through delay compartments. There is some ambiguity in the appropriate number of delay compartments, which we examine in this note.
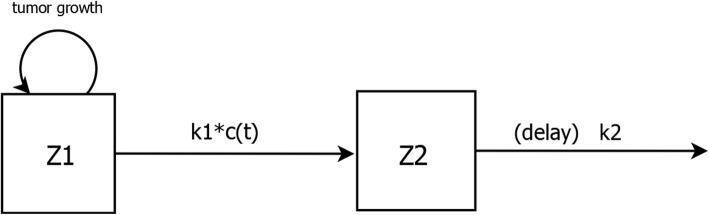
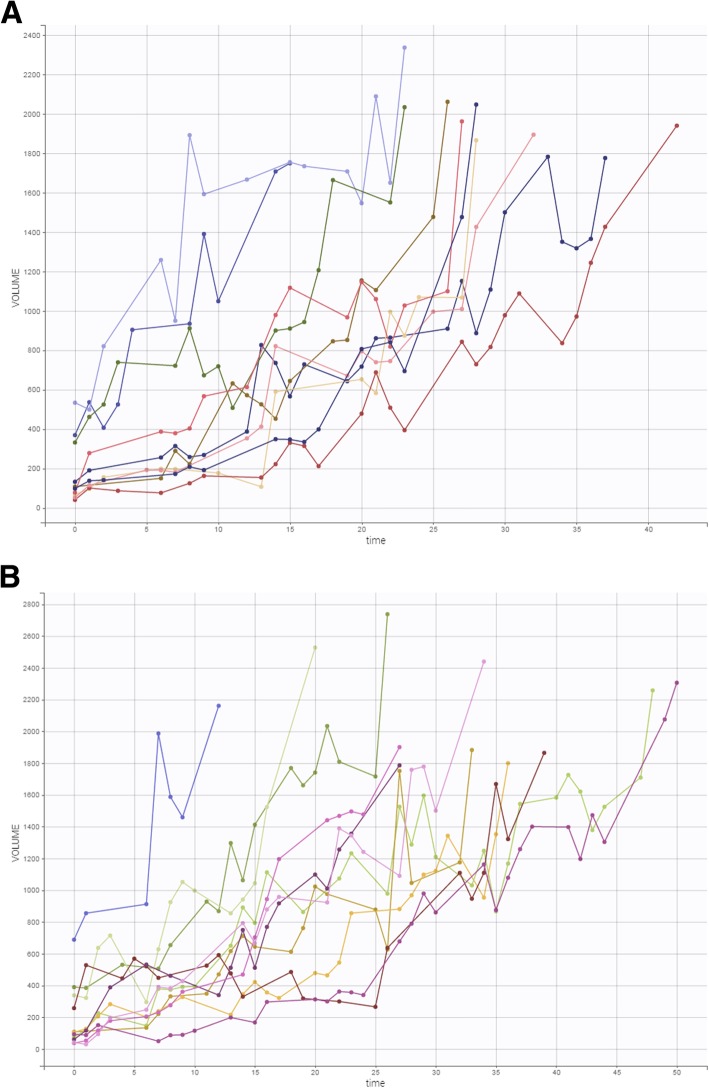
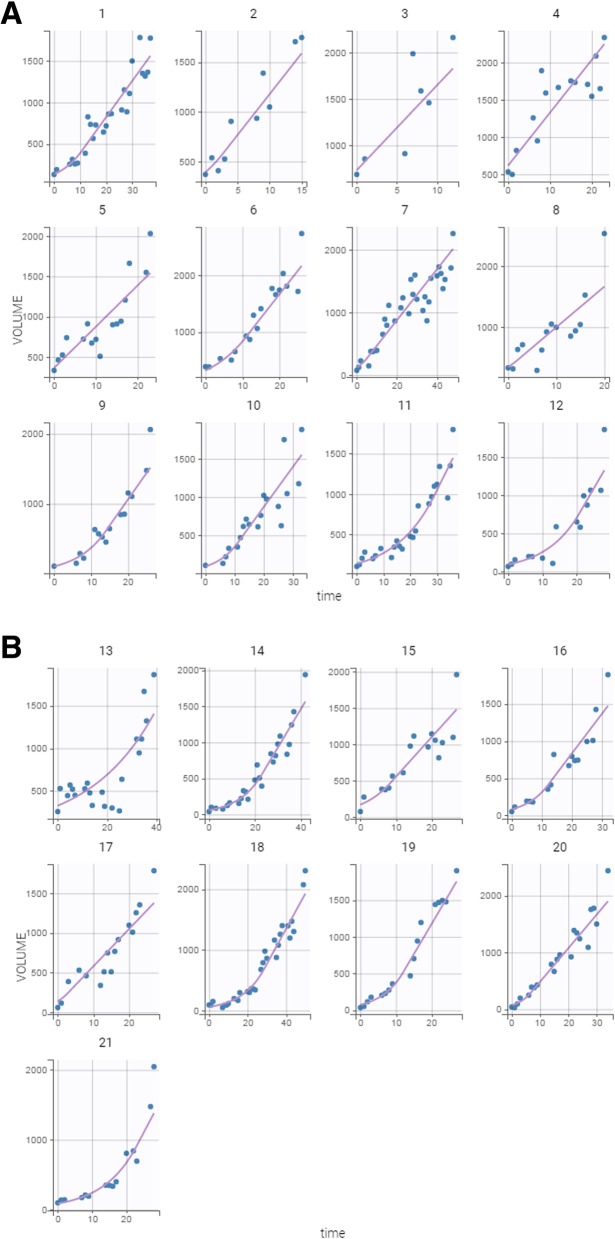
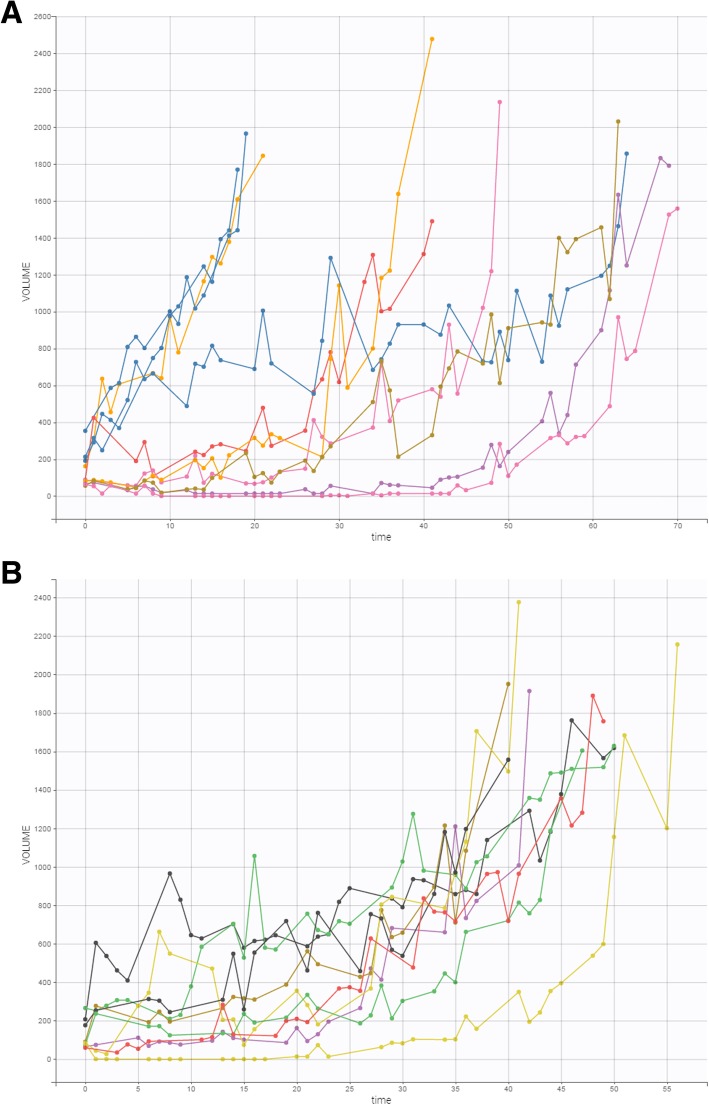
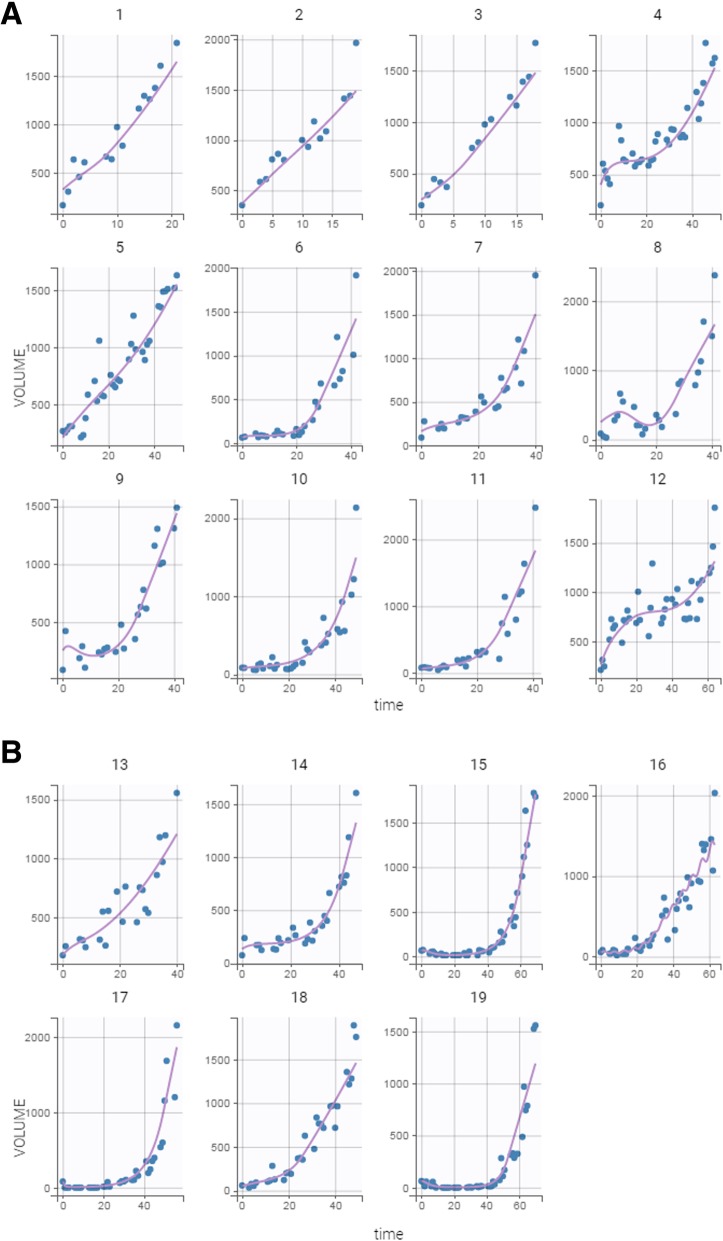
Methods: We devised an explicit delay differential equation model that reflects the main features of the Simeoni ODE model. We evaluated the original Simeoni model and this adaptation with a sample data set of mammary tumor growth in the FVB/N-Tg(MMTVneu)202Mul/J mouse model.
Results: The experimental data evinced tumor growth heterogeneity and inter-individual diversity in response, which could be accommodated statistically through mixed models. We found little difference in goodness of fit between the original Simeoni model and the delay differential equation model relative to the sample data set.
Conclusions: One should exercise caution if asserting a particular mathematical model uniquely characterizes tumor growth curve data. The Simeoni ODE model of tumor growth is not unique in that alternative models can provide equivalent representations of tumor growth.
Keywords: Cancer chemotherapy; Delay differential equations; Mathematical model; Ordinary differential equations; Tumor growth.
Conflict of interest statement
The authors declare they have no competing interests.
Figures
Similar articles
-
Impact of Cisplatin Dosing Regimens on Mammary Tumor Growth in an Animal Model.Arch Cancer Biol Ther. 2020;1(1):18-21. doi: 10.33696/cancerbiology.1.004. Epub 2020 Jun 15. Arch Cancer Biol Ther. 2020. PMID: 32728673 Free PMC article.
-
Differences in predictions of ODE models of tumor growth: a cautionary example.BMC Cancer. 2016 Feb 26;16:163. doi: 10.1186/s12885-016-2164-x. BMC Cancer. 2016. PMID: 26921070 Free PMC article.
-
From graph topology to ODE models for gene regulatory networks.PLoS One. 2020 Jun 30;15(6):e0235070. doi: 10.1371/journal.pone.0235070. eCollection 2020. PLoS One. 2020. PMID: 32603340 Free PMC article.
-
Estimating a predator-prey dynamical model with the parameter cascades method.Biometrics. 2008 Sep;64(3):959-967. doi: 10.1111/j.1541-0420.2007.00942.x. Epub 2007 Nov 19. Biometrics. 2008. PMID: 18047526
-
Merits and Demerits of ODE Modeling of Physicochemical Systems for Numerical Simulations.Molecules. 2022 Sep 9;27(18):5860. doi: 10.3390/molecules27185860. Molecules. 2022. PMID: 36144593 Free PMC article. Review.
Cited by
-
Negligible Long-Term Impact of Nonlinear Growth Dynamics on Heterogeneity in Models of Cancer Cell Populations.Bull Math Biol. 2025 Jan 3;87(2):18. doi: 10.1007/s11538-024-01395-w. Bull Math Biol. 2025. PMID: 39751987 Free PMC article.
-
On the possibility of engineering social evolution in microfluidic environments.Biophys J. 2024 Feb 6;123(3):407-419. doi: 10.1016/j.bpj.2024.01.007. Epub 2024 Jan 9. Biophys J. 2024. PMID: 38204167 Free PMC article.
-
Mathematical modelling of the dynamics of image-informed tumor habitats in a murine model of glioma.Sci Rep. 2023 Feb 20;13(1):2916. doi: 10.1038/s41598-023-30010-6. Sci Rep. 2023. PMID: 36804605 Free PMC article.
-
Bayesian Information-Theoretic Calibration of Radiotherapy Sensitivity Parameters for Informing Effective Scanning Protocols in Cancer.J Clin Med. 2020 Oct 5;9(10):3208. doi: 10.3390/jcm9103208. J Clin Med. 2020. PMID: 33027933 Free PMC article.
-
Mathematical models of cystic fibrosis as a systemic disease.WIREs Mech Dis. 2023 Nov-Dec;15(6):e1625. doi: 10.1002/wsbm.1625. Epub 2023 Aug 6. WIREs Mech Dis. 2023. PMID: 37544654 Free PMC article. Review.
References
-
- Simeoni Monica, Magni Paolo, Cammia Cristiano, De Nicolao Giuseppe, Croci Valter, Pesenti Enrico, Germani Massimiliano, Poggesi Italo, Rocchetti Maurizio. Predictive Pharmacokinetic-Pharmacodynamic Modeling of Tumor Growth Kinetics in Xenograft Models after Administration of Anticancer Agents. Cancer Research. 2004;64(3):1094–1101. doi: 10.1158/0008-5472.CAN-03-2524. - DOI - PubMed
MeSH terms
Grants and funding
LinkOut - more resources
Full Text Sources
Miscellaneous
