. 2020 Mar 17;21(1):71.
doi: 10.1186/s13059-020-01988-3.

Benchmarking of computational error-correction methods for next-generation sequencing data

Affiliations

Benchmarking of computational error-correction methods for next-generation sequencing data

Keith Mitchell et al. Genome Biol. .

Abstract

Background: Recent advancements in next-generation sequencing have rapidly improved our ability to study genomic material at an unprecedented scale. Despite substantial improvements in sequencing technologies, errors present in the data still risk confounding downstream analysis and limiting the applicability of sequencing technologies in clinical tools. Computational error correction promises to eliminate sequencing errors, but the relative accuracy of error correction algorithms remains unknown.

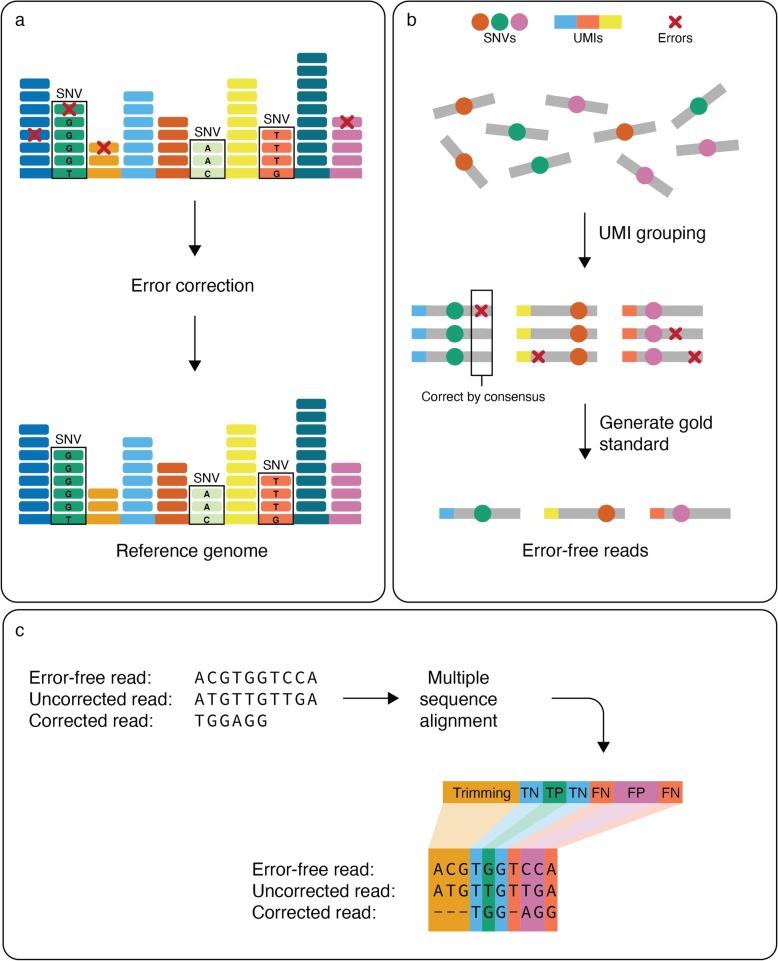
Results: In this paper, we evaluate the ability of error correction algorithms to fix errors across different types of datasets that contain various levels of heterogeneity. We highlight the advantages and limitations of computational error correction techniques across different domains of biology, including immunogenomics and virology. To demonstrate the efficacy of our technique, we apply the UMI-based high-fidelity sequencing protocol to eliminate sequencing errors from both simulated data and the raw reads. We then perform a realistic evaluation of error-correction methods.

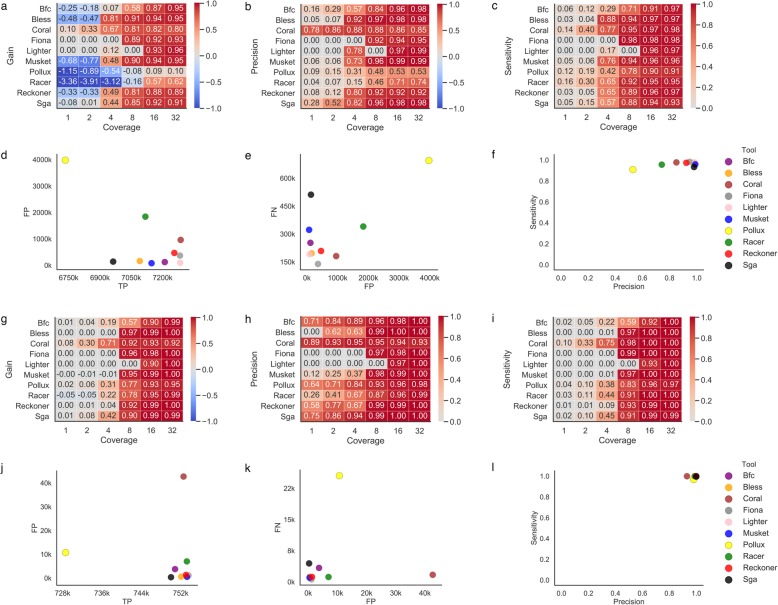
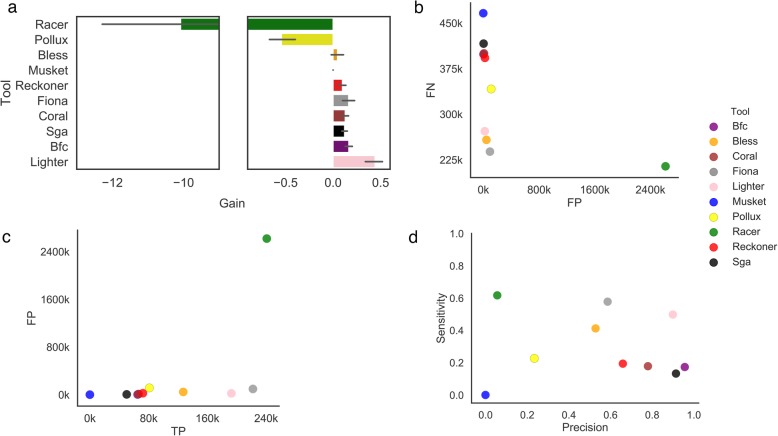
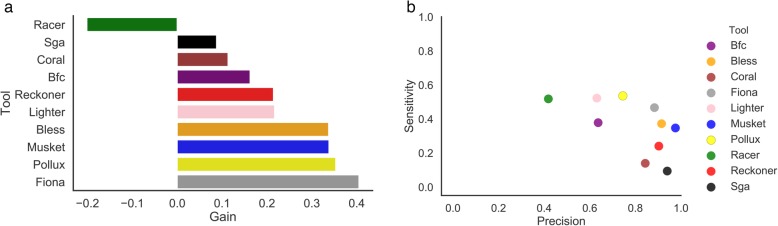
Conclusions: In terms of accuracy, we find that method performance varies substantially across different types of datasets with no single method performing best on all types of examined data. Finally, we also identify the techniques that offer a good balance between precision and sensitivity.


Conflict of interest statement

The authors declare that they have no competing interests.

Figures

Fig. 1
Fig. 1
Study design for benchmarking computational error-correction methods. a Schematic representation of the goal of error correction algorithms. Error correction aims to fix sequencing errors while maintaining the data heterogeneity. b Error-free reads for gold standard were generated using UMI-based clustering. Reads were grouped based on matching UMIs and corrected by consensus, where an 80% majority was required to correct sequencing errors without affecting naturally occurring single nucleotide variations (SNVs). c Framework for evaluating the accuracy of error-correction methods. Multiple sequence alignment between the error-free, uncorrected (original), and corrected reads was performed to classify bases in the corrected read. Bases fall into the category of trimming, true negative (TN), true positive (TP), false negative (FN), and false positive (FP)
Fig. 2
Fig. 2
Correcting errors in whole genome sequencing data (D1 dataset). For each tool, the best k-mer size was selected. af WGS human data. gl WGS E. coli data. a, g Heatmap depicting the gain across various coverage settings. Each row corresponds to an error correction tool, and each column corresponds to a dataset with a given coverage. b, h Heatmap depicting the precision across various coverage settings. Each row corresponds to an error correction tool, and each column corresponds to a dataset with a given coverage. c, i Heatmap depicting the sensitivity across various coverage settings. Each row corresponds to an error correction tool, and each column corresponds to a dataset with a given coverage. d, j Scatter plot depicting the number of TP corrections (x-axis) and FP corrections (y-axis) for datasets with 32x coverage. e, k Scatter plot depicting the number of FP corrections (x-axis) and FN corrections (y-axis) for datasets with 32x coverage. f, l Scatter plot depicting the sensitivity (x-axis) and precision (y-axis) for datasets with 32x coverage
Fig. 3
Fig. 3
Correcting errors in TCR-Seq data (D2 dataset). For all plots, the mean value across 8 TCR-Seq samples is reported for each tool. a Bar plot depicting the gain across various error-correction methods. b Scatter plot depicting the number of TP corrections (x-axis) and FP corrections (y-axis). c Scatter plot depicting the number of FP corrections (x-axis) and FN corrections (y-axis). d Scatter plot depicting the sensitivity (x-axis) and precision (y-axis) of each tool
Fig. 4
Fig. 4
Correcting errors in viral sequencing data (D4 dataset). For all plots, the best k-mer size was selected. a Bar plot depicting the gain across various error-correction methods. b Scatter plot depicting the sensitivity (x-axis) and precision (y-axis) of each tool

References

    1. Schuster SC. Next-generation sequencing transforms today’s biology. Nat Methods. 2008;5:16–18. doi: 10.1038/nmeth1156. - DOI - PubMed
    1. Scholz MB, Lo C-C, Chain PSG. Next generation sequencing and bioinformatic bottlenecks: the current state of metagenomic data analysis. Curr Opin Biotechnol. 2012;23:9–15. doi: 10.1016/j.copbio.2011.11.013. - DOI - PubMed
    1. Salk JJ, Schmitt MW, Loeb LA. Enhancing the accuracy of next-generation sequencing for detecting rare and subclonal mutations. Nat Rev Genet. 2018;19:269–285. doi: 10.1038/nrg.2017.117. - DOI - PMC - PubMed
    1. Ma X, et al. Analysis of error profiles in deep next-generation sequencing data. Genome Biol. 2019;20:50. doi: 10.1186/s13059-019-1659-6. - DOI - PMC - PubMed
    1. Strom SP. Current practices and guidelines for clinical next-generation sequencing oncology testing. Cancer Biol Med. 2016;13:3–11. doi: 10.20892/j.issn.2095-3941.2016.0004. - DOI - PMC - PubMed

Publication types

Substances

LinkOut - more resources