. 2020 May 7;78(3):382-395.e8.
doi: 10.1016/j.molcel.2020.02.018. Epub 2020 Mar 16.

N6-Deoxyadenosine Methylation in Mammalian Mitochondrial DNA

Affiliations

N6-Deoxyadenosine Methylation in Mammalian Mitochondrial DNA

Ziyang Hao et al. Mol Cell. .

Abstract

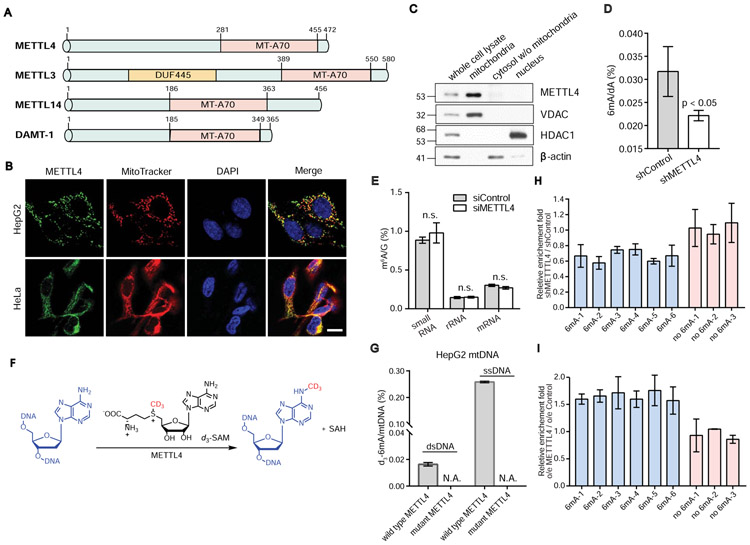
N6-Methyldeoxyadenosine (6mA) has recently been shown to exist and play regulatory roles in eukaryotic genomic DNA (gDNA). However, the biological functions of 6mA in mammals have yet to be adequately explored, largely due to its low abundance in most mammalian genomes. Here, we report that mammalian mitochondrial DNA (mtDNA) is enriched for 6mA. The level of 6mA in HepG2 mtDNA is at least 1,300-fold higher than that in gDNA under normal growth conditions, corresponding to approximately four 6mA modifications on each mtDNA molecule. METTL4, a putative mammalian methyltransferase, can mediate mtDNA 6mA methylation, which contributes to attenuated mtDNA transcription and a reduced mtDNA copy number. Mechanistically, the presence of 6mA could repress DNA binding and bending by mitochondrial transcription factor (TFAM). Under hypoxia, the 6mA level in mtDNA could be further elevated, suggesting regulatory roles for 6mA in mitochondrial stress response. Our study reveals DNA 6mA as a regulatory mark in mammalian mtDNA.

Keywords: METTL4; N(6)-methyldeoxyadenosine (6mA); TFAM; methyltransferase; mitochondrial DNA methylation; mitochondrial replication; mitochondrial transcription regulation.


Conflict of interest statement

Declaration of Interests C.H. is a scientific founder and a scientific advisory board member of Accent Therapeutics and a shareholder in Epican Genentech.

Figures

Figure 1.
Figure 1.. The Presence of N6-deoxyadenosine Methylation (6mA) in Human Mitochondrial DNA (mtDNA)
(A) UHPLC-QQQ-MS/MS showing 6mA/dA levels in total DNA, crude mtDNA, and DNase digested mtDNA in HepG2 cells (n = 3, mean ± SEM). (B) UHPLC-QQQ-MS/MS showing 6mA levels in gDNA and mtDNA in 143B cells and MDA-MB-231 cells (n = 2, mean ± SEM). (C) 6mA dot blot of total DNA, crude mtDNA, and PCR amplified mtDNA. (D) 6mA signals (green) and their co-localization with mitochondria marker (red) in HepG2 cells with no treatment, RNase treatment, and DNase + RNase treatment; scale bar: 100 μm. See also Figure S1 and S2.
Figure 2.
Figure 2.. The Distribution of 6mA in Human mtDNA
(A) The workflow of 6mA ChIP-exo. (B) Circos plot of 6mA distributions in mtDNA. Mitochondrial genome is shown as the outermost circle in red/gray/blue with gene annotations. 6mA profiles (IP - input) revealed by SYSY-IP rep-1 (blue), SYSY-IP rep-2 (blue), and NEB-IP (red) were show in three tracks, respectively, from outside to inside. Gray dots and bars indicate 6mA peaks. Reads from input libraries have been subtracted. (C) Two zoomed in regions from (B), showing examples of 6mA peaks (IP - input) detected by both SYSY and NEB antibodies. Reads from input libraries have been subtracted. The left penal showed the peak detected on the promotor region. (D) Spearman correlation analysis of 6mA-IP profiles generated from using NEB and SYSY anti-6mA antibodies, respectively. Spearman r = 0.760. (E) 6mA-IP qPCR validation of 6mA-posotive and 6mA-negative sites revealed by 6mA mapping (n = 2, mean ± SEM). See also Figure S2.
Figure 3.
Figure 3.. METTL4 is Enriched in Mitochondrion and Mediates mtDNA 6mA Methylation
(A) Multiple alignments of METTL4 to METTL3/METTL14 and DAMT-1. (B) Immunofluorescence displayed the co-localization of METTL4 with mitochondria in HepG2 and HeLa cells. Scale bar: 20 μm. The co-localization of METTL4 with mitochondria was evaluated by Pearson correlation coefficient, with Rr = 0.60 for HepG2 and 0.74 for HeLa. (C) Western blot revealed the uneven distribution of the METTL4 protein in different subcellular fractions and the enrichment of METTL4 in mitochondria. VDAC (mitochondrial), β-actin (cytosolic), and HDAC1 (nuclear) were chose as compartment-specific markers demonstrating the purity of each subcellular fraction. (D) Knockdown of METTL4 resulted in a decrease of the total 6mA level in HepG2 mtDNA (n = 4, p < 0.05, t test, mean ± SEM). (E) Knockdown METTL4 did not reduce the m6A level in mtRNA species (n = 4, mean ± SEM). (F) Schematic illustration of N-deoxyadenosine methylation of DNA in the presence of METTL4 and d3-SAM. (G) The in vitro methylation activity of METTL4 and its inactive mutant on single-stranded and double-stranded mtDNA (n = 2, mean ± SEM). (H) 6mA-IP qPCR of 6mA-positive and 6mA-negative sites revealed by 6mA mapping in stable METTL4 knockdown HepG2 and control cells (n = 2, mean ± SEM). (I) 6mA-IP qPCR of 6mA-positive and 6mA-negative sites revealed by 6mA mapping in METTL4 overexpression and control cells (n = 2, mean ± SEM). See also Figure S3.
Figure 4.
Figure 4.. METTL4-mediated N6-deoxyadenosine Methylation Affects Mitochondrial Functions
(A) Metabolic phenotype plot of oxygen consumption rate (OCR) vs. extracellular acidification rate (ECAR). METTL4 knockdown increased mitochondrial activity under both basal and stressed conditions (n = 4, mean ± SEM). (B) METTL4 knockdown significantly increased OXPHOS complex III assembly and complex IV was also shown slightly increased. (C) METTL4 knockdown increased ROS generation in mitochondria (n = 8, mean ± SEM). (D) METTL4 knockdown increased the overall membrane potential of mitochondria. (E) METTL4 knockdown decreased cell proliferation rates (n = 5, mean ± SEM). See also Figure S4.
Figure 5.
Figure 5.. METTL4-mediated N6-Deoxyadenosine Methylation Affects Levels of Mitochondrial Transcripts and Mitochondrial DNA (mtDNA) Copy Number
(A) Heatmap summarizing the mtDNA encoded transcripts from RNA-seq analysis. METTL4 knockdown increased the expression level of most mtDNA encoded mRNAs and rRNA. (B) METTL4 knockdown and complementation showed that the methylation activity of METTL4 contributes to mitochondrial gene expression regulation (n = 3, mean ± SEM). (C) - (D) Fold change of mitochondrial precursor RNA transcripts in the control and METTL4 knockdown cells at different time points after EU labeling. Primers for qPCR were designed for mt-tRNAVal (C) and mt-tRNAArg (D) junction sites (n = 4, mean ± SEM). METTL4 knockdown increases the formation rate of mitochondrial precursor RNA. (E) METTL4 knockdown doubled the relative mtDNA copy number (n = 3, mean ± SEM). See also Figure S5.
Figure 6.
Figure 6.. DNA 6mA Methylation Attenuates Mitochondrial Transcription and Affects Binding/Bending of DNA by TFAM
(A) In vitro transcription assays showing that 6mA suppresses transcription derived from the HSP promoter. (B) Quantification of transcript levels in 6mA-modified and unmodified HSP probes. The level of transcript from the 6mA-modified probes were normalized to that from the unmodified probe (n = 2, mean ± s.d.). (C) In vitro competition assays showing that the ratio of 6mA/dA was depleted in the TFAM-IP fraction while enriched in the flow-through fraction (n = 2, mean ± s.d.). (D) EMSA performed using the 6mA-modified and unmodified HSP probes with different concentrations of the TFAM protein. (E) The dissociation constant of TFAM to the 6mA-modified and unmodified HSP probes were calculated from the plot of fraction bound as a function of the TFAM concentration (n = 2, mean ± s.d.). (F) FRET efficiency of the 6mA-modified and unmodified HSP probes upon TFAM binding (n = 2, mean ± s.d.). See also Figure S5.
Figure 7.
Figure 7.. The Accumulation of METTL4-mediated 6mA Methylation in Mitochondria Under Hypoxic Stress
(A) The 6mA level in mtDNA increased during hypoxia treatment. Low 6mA was observed in gDNA under hypoxia (n = 3, p < 0.01, t test, mean ± SEM). (B) The METTL4 protein level in mitochondria was elevated by ~2.5 fold under hypoxia. (C) Knockdown of METTL4 under hypoxia resulted in a substantially reduced 6mA level in mtDNA (n = 2, p < 0.01, t test, mean ± SEM). (D) Distributions of 6mA in mtDNA under hypoxia revealed by 6mA mapping. The mitochondrial genome is shown as the outermost circle in red/gray/blue with gene annotations. 6mA profiles revealed by SYSY-IP rep-1 (blue), SYSY-IP rep-2 (blue), and NEB-IP (red) were show in three tracks, respectively, from outside to inside. Gray dots and bars indicate 6mA peaks. Reads from input libraries have been subtracted. (E) Peak overlap between 6mA mapping results under normoxia and hypoxia. 21 6mA peaks under hypoxia (certain peaks are broader under hypoxia) overlap with 19 peaks under normoxia. (F) A schematic model showing mtDNA 6mA affecting mitochondrial functions. See also Figure S6.

Comment in

References

    1. Agaronyan K, Morozov YI, Anikin M, and Temiakov D (2015). Replication-transcription switch in human mitochondria. Science 347, 548–551. - PMC - PubMed
    1. Alam TI, Kanki T, Muta T, Ukaji K, Abe Y, Nakayama H, Takio K, Hamasaki N, and Kang D (2003). Human mitochondrial DNA is packaged with TFAM. Nucleic acids Res 31, 1640–1645. - PMC - PubMed
    1. Bang J, Bae S-H, Park C-J, Lee J-H, and Choi B-S (2008). Structural and dynamics study of DNA dodecamer duplexes that contain un-, hemi-, or fully methylated GATC sites. J Am Chem Soc 130, 17688–17696. - PubMed
    1. Baubec T, and Schubeler D (2014). Genomic patterns and context specific interpretation of DNA methylation. Curr Opin Genet Dev 25, 85–92. - PubMed
    1. Beh LY, Debelouchina GT, Clay DM, Thompson RE, Lindblad KA, Hutton ER, Bracht JR, Sebra RP, Muir TW, and Landweber LF (2019). Identification of a DNA N6-Adenine Methyltransferase Complex and Its Impact on Chromatin Organization. Cell 177, 1781–1796.e1725. - PMC - PubMed

Publication types

MeSH terms