. 2020 May 14;133(9):jcs241117.
doi: 10.1242/jcs.241117.

CLIC4 is a cytokinetic cleavage furrow protein that regulates cortical cytoskeleton stability during cell division

Affiliations

CLIC4 is a cytokinetic cleavage furrow protein that regulates cortical cytoskeleton stability during cell division

Eric Peterman et al. J Cell Sci. .

Abstract

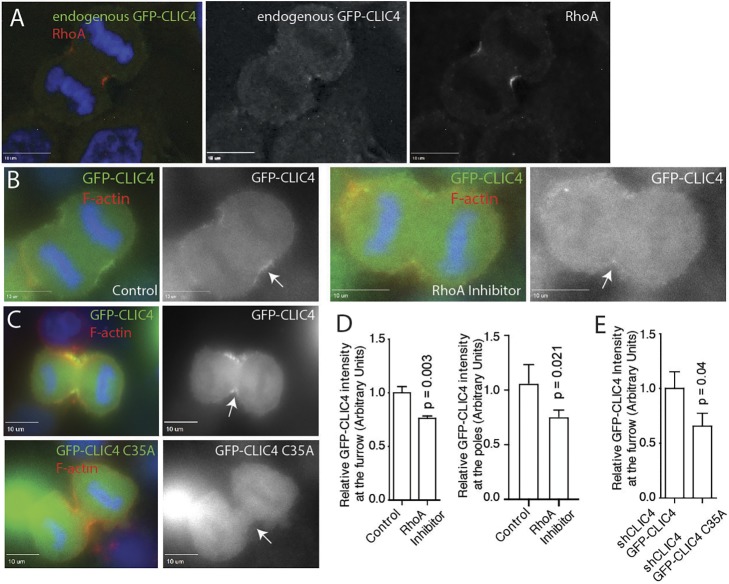
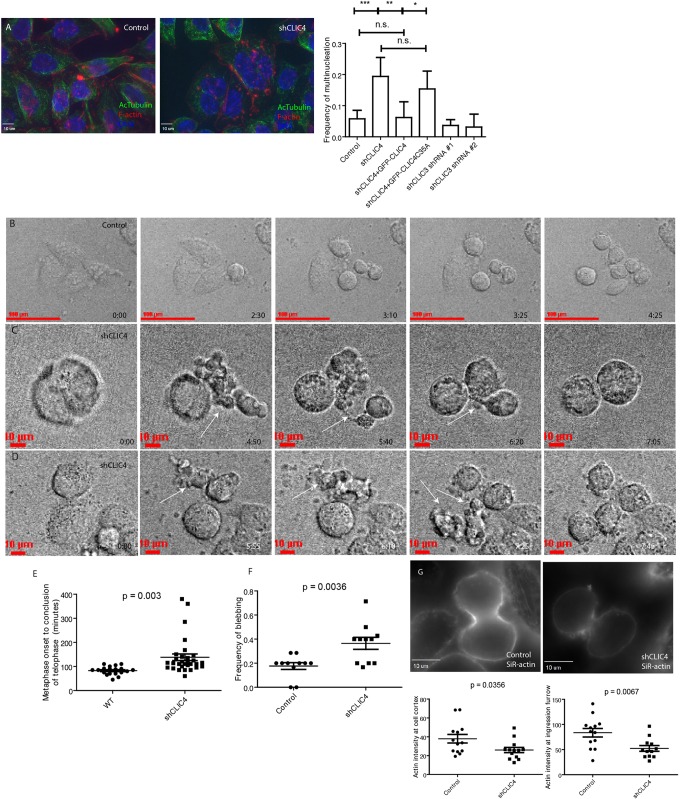
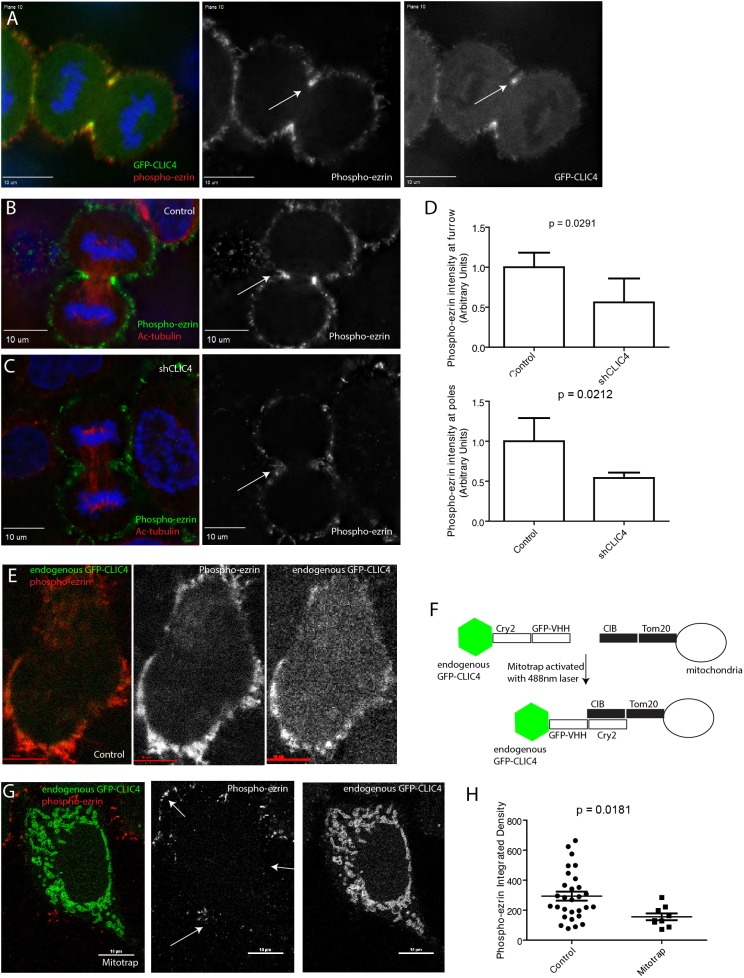
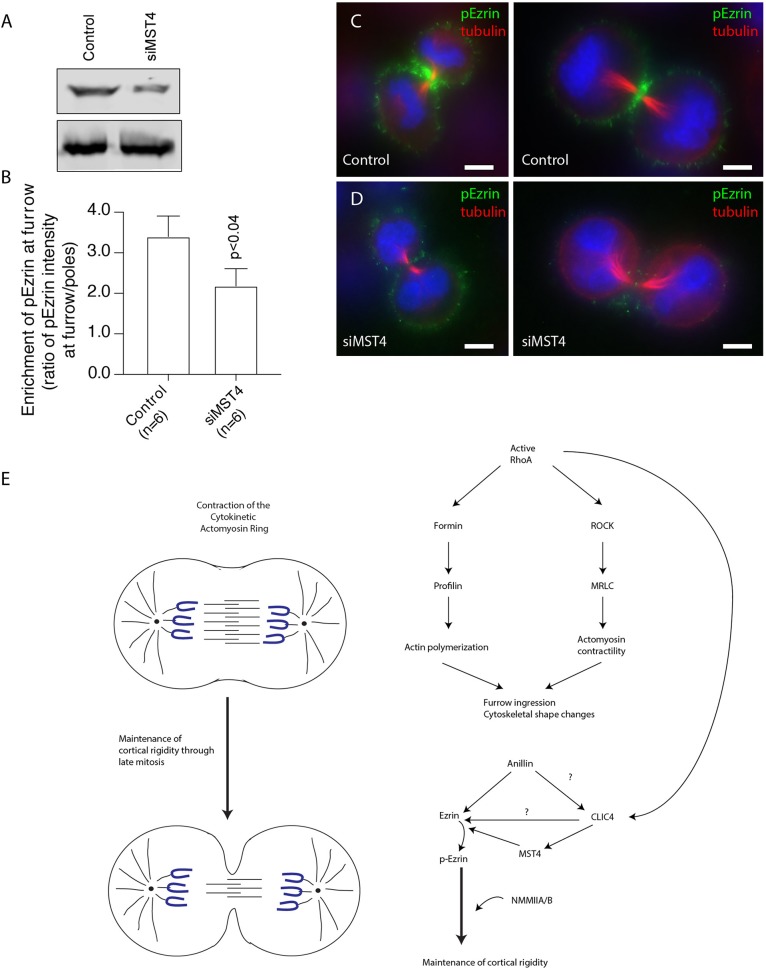
During mitotic cell division, the actomyosin cytoskeleton undergoes several dynamic changes that play key roles in progression through mitosis. Although the regulators of cytokinetic ring formation and contraction are well established, proteins that regulate cortical stability during anaphase and telophase have been understudied. Here, we describe a role for CLIC4 in regulating actin and actin regulators at the cortex and cytokinetic cleavage furrow during cytokinesis. We first describe CLIC4 as a new component of the cytokinetic cleavage furrow that is required for successful completion of mitotic cell division. We also demonstrate that CLIC4 regulates the remodeling of the sub-plasma-membrane actomyosin network within the furrow by recruiting MST4 kinase (also known as STK26) and regulating ezrin phosphorylation. This work identifies and characterizes new molecular players involved in regulating cortex stiffness and blebbing during the late stages of cytokinetic furrowing.

Keywords: Actin; Cell division; Cleavage furrow.


Conflict of interest statement

Competing interestsThe authors declare no competing or financial interests.

Figures

Fig. 1.
Fig. 1.
Localization of CLIC4 throughout the cell cycle. (A) Schematic representation of abscission that generates an extracellular post-mitotic midbody. (B,C) HeLa cells expressing exogenous GFP–CLIC4 were fixed and stained with phalloidin–Alexa 568 (B) or anti-acetylated tubulin antibodies (C). Arrow in B points to an ingressing cleavage furrow. Arrow in C points to an abscission site. Asterisk marks the midbody. (D) HeLa cells expressing exogenous GFP–CLIC4 were analysed by time-lapse microscopy. Images shown are stills representing different sequential time points during anaphase. Arrow marks cleavage furrow. (E) HeLa cells expressing endogenously tagged GFP–CLIC4 were fixed and stained with anti-anillin antibody. Arrow points to the cleavage furrow. (F) 3D volume rendition of a GFP–CLIC4 expressing HeLa cell in anaphase. Red marks central spindle microtubules labeled with anti-acetylated tubulin antibodies. The 3D image is shown at an angle to better demonstrate the GFP–CLIC4 ring at the furrow. For different angles of the 3D rendering see Movie 1. Scale bars in B–F: 10 μm
Fig. 2.
Fig. 2.
RhoA is necessary and sufficient for CLIC4 localization. (A) HeLa cells expressing endogenous GFP–CLIC4 were TCA-fixed and stained with RhoA antibodies. Image was deconvolved. (B) HeLa cells expressing endogenously labeled GFP–CLIC4 were imaged in anaphase in the presence or absence of RhoA inhibitor. Arrows point to cleavage furrows. (C) shCLIC4 HeLa cells were transfected with either wild-type GFP–CLIC4 or GFP–CLIC4 C35A. Cells were then fixed and stained with phalloidin–Alexa 568. Arrows point to cleavage furrow. (D,E) Quantification of GFP–CLIC4 (D,E) or GFP–CLIC4 C35A (E) fluorescence in cleavage furrow and poles of dividing cell. Data shown are the means and standard deviations of 15–30 anaphase cells randomly picked during three independent experiments. Scale bars in A–C: 10 μm
Fig. 3.
Fig. 3.
Depletion of CLIC4 leads to mitotic defects. (A) HeLa cells were fixed and co-stained with phalloidin–Alexa 568 and anti-acetylated tubulin antibodies. The number of multi-nucleated cells were then counted. Graph on the right shows quantification and statistical analysis of multi-nucleation induced by shRNA-dependent CLIC4 depletion. Data shown are the means and standard deviations of at least 75 cells counted in randomly chosen fields from three different experiments. *P<0.05; **P<0.025; ***P<0.01; ns, not significant. (B–D) Control (B) or shCLIC4 (C,D) HeLa cells were analysed by time-lapse microscopy. Images shown are the stills from different time points of cells undergoing mitotic cell division. Arrows point to blebs during anaphase. (E) Quantification of time required for cells to go from metaphase to abscission. Data shown are means and standard deviations derived from randomly picked cells in two different experiments. WT, wild type. (F) Quantification of blebbing frequency in control or shCLIC4 HeLa cells. Data shown are means and standard deviations derived from randomly picked cells in three different experiments. (G) Control or shCLIC4 cells were incubated with SiR-actin and live imaged. Quantification of actin intensity at the cell cortex and furrows are shown. Data shown are means and standard deviations of individual cell intensities from randomly picked cells in three different experiments. Scale bars in A,C,D,G: 10 μm. Scale bar in B: 100 μm.
Fig. 4.
Fig. 4.
An optogenetic targeting of CLIC4 to the mitochondria delays cell division. (A) Schematic of Mitotrap used in this experiment. In all cases cells expressing endogenously tagged GFP–CLIC4 were co-transfected with Cry2-GFP-VHH and CIB-Tom20 plasmids and pulsed with a 488 nm laser to re-target GFP–CLIC4 at the mitochondria. (B) Interphase cell exposed to 488 nm to activate Mitotrap. Mitochondria are labeled in red and endogenous GFP–CLIC4 in green. (C,D) Still images from time-lapse microscopy where Mitotrap was activated. Arrows point to blebs or cytokinesis failure induced by GFP–CLIC4 Mitotrap. Scale bars: 100 μm. (E) Quantification of time required for cells to complete mitotic cell division in control and Mitotrapped cells. Data shown are the means and standard deviations.
Fig. 5.
Fig. 5.
Loss of CLIC4 results in decreases in NMMIIA and -IIB at cortex and furrow. (A) HeLa cells expressing GFP–CLIC4 were fixed and stained with anti-NMMIIB antibodies. (B–E) Control (B,D) or shCLIC4 (C,E) HeLa cells were fixed and stained with either anti-NMMIIA (B,C) or anti-NMMIIB (D,E) antibodies. Arrows point to ingressing furrow during anaphase. (F) Quantification of NMMIIA or NMMIIB at the furrow or at the poles of the anaphase cell. The data shown are the means and standard deviations of 20–40 randomly picked cells from three different experiments. Scale bars in A–E: 10 μm.
Fig. 6.
Fig. 6.
CLIC4 is necessary for efficient phospho-ezrin recruitment to the cleavage furrow. (A) HeLa cells expressing GFP–CLIC4 were fixed and stained with anti-phospho-ezrin antibodies. Arrows point to the cleavage furrow. (B,C) Control or shCLIC4 cells were fixed and stained with anti-acetylated tubulin and anti-phospho-ezrin antibodies. Arrows point to the furrow. (D) Quantification of phospho-ezrin signal intensity in cleavage furrow and poles of the cell. Data shown are the means and standard deviations derived from three different experiments. For every experiment phospho-ezrin fluorescence intensity in shCLIC4 data was normalized against phospho-ezrin fluorescence intensity in control cells. (E–G) The GFP–CLIC4 Mitotrap assay designed to test the effect of CLIC4 depletion on the levels of phospho-ezrin at the plasma membrane. Panel F shows a schematic of Mitotrap set-up, where endogenous GFP–CLIC4 cells are transiently transfected with the Mitotrap plasmids and pulsed with a 488 nm laser to trap CLIC4 at the mitochondria. Panels E and G show localization of endogenously tagged GFP–CLIC4 and phospho-ezrin in cells before and after exposure to 488 nm wavelength pulse. (H) Quantification of phospho-ezrin levels at the plasma membrane before and after exposure to 488 nm to activate GFP–CLIC4 Mitotrap. Data shown are the means and standard deviations derived from three different experiments. Scale bars in A–C,E,G: 10 μm.
Fig. 7.
Fig. 7.
CLIC4 interacts with MST4 and affects its localization during anaphase. (A) Putative candidates revealed via immunoprecipitation of GFP–CLIC4 followed by mass spectrometry. (B) Glutathione bead pulldown assay using HeLa cell lysate and either GST only or GST–CLIC4. Coomassie staining showing equal loading as well as quality of the recombinant proteins used in the pulldown assay. (C) HeLa cells were fixed and stained with phalloidin–Alexa 568 and anti-MST4 antibodies. Arrow points to MST4 at the cleavage furrow. (D) Control or shCLIC4 HeLa cells were fixed and stained with anti-MST4 antibody. Arrows point to the cleavage furrow. (E) Quantification of MST4 enrichment in the furrow in control, shCLIC4, siAnillin and shCLIC4/siAnillin cells. Data shown are from four individual experiments, horizontal bar indicates the mean. n is the total number of cells quantified. Scale bars in C,D: 10 µm.
Fig. 8.
Fig. 8.
MST4 is required for phospho-ezrin recruitment to cytokinetic furrow. (A) Triton X-100 lysates from HeLa control cells or cells transfected with MST4 siRNA were analysed by western blotting with anti-MST4 and anti-tubulin antibodies. (B) Quantification of the enrichment of phospho-ezrin at the furrow. Data shown are the means and standard deviations, and n indicates the number of cells analysed. (C,D) Control HeLa cells (C) or cells transfected with MST4 siRNA (D) were fixed and stained with anti-phospho-ezrin (green) and anti-tubulin (red) antibodies. Scale bars: 5 µm. (E) Schematic representation of the proposed role for CLIC4 during cytokinesis.

Similar articles

Cited by

References

    1. Amini R., Goupil E., Labella S., Zetka M., Maddox A. S., Labbé J. C. and Chartier N. T. (2014). C. elegans anillin proteins regulate intercellular bridge stability and germline syncytial organization. J. Cell Biol. 206, 129-143. 10.1083/jcb.201310117 - DOI - PMC - PubMed
    1. Argenzio E., Klarenbeek J., Kedziora K. M., Nahidiazar L., Isogai T., Perrakis A., Jalink K., Moolenaar W. H. and Innocenti M. (2018). Profilin binding couples chloride intracellular channel protein CLIC4 to RhoA–mDia2 signaling and filopodium formation. J. Biol. Chem. 293, 19161-19176. 10.1074/jbc.RA118.002779 - DOI - PMC - PubMed
    1. Argenzio E., Margadant C., Leyton-Puig D., Janssen H., Jalink K., Sonnenberg A. and Moolenaar W. H. (2014). CLIC4 regulates cell adhesion and 1 integrin trafficking. J. Cell Sci. 127, 5189-5203. 10.1242/jcs.150623 - DOI - PubMed
    1. Berryman M. A. and Goldenring J. R. (2003). CLIC4 is enriched at cell–cell junctions and colocalizes with AKAP350 at the centrosome and midbody of cultured mammalian cells. Cell Motil. Cytoskelet. 56, 159-172. 10.1002/cm.10141 - DOI - PubMed
    1. Bugaj L. J., Choksi A. T., Mesuda C. K., Kane R. S. and Schaffer D. V. (2013). Optogenetic protein clustering and signaling activation in mammalian cells. Nat. Methods 10, 249-252. 10.1038/nmeth.2360 - DOI - PubMed

Publication types