. 2020 Mar 17;11(1):1380.
doi: 10.1038/s41467-020-15162-7.

Quantifying contributions of chlorofluorocarbon banks to emissions and impacts on the ozone layer and climate

Affiliations

Quantifying contributions of chlorofluorocarbon banks to emissions and impacts on the ozone layer and climate

Megan Lickley et al. Nat Commun. .

Abstract

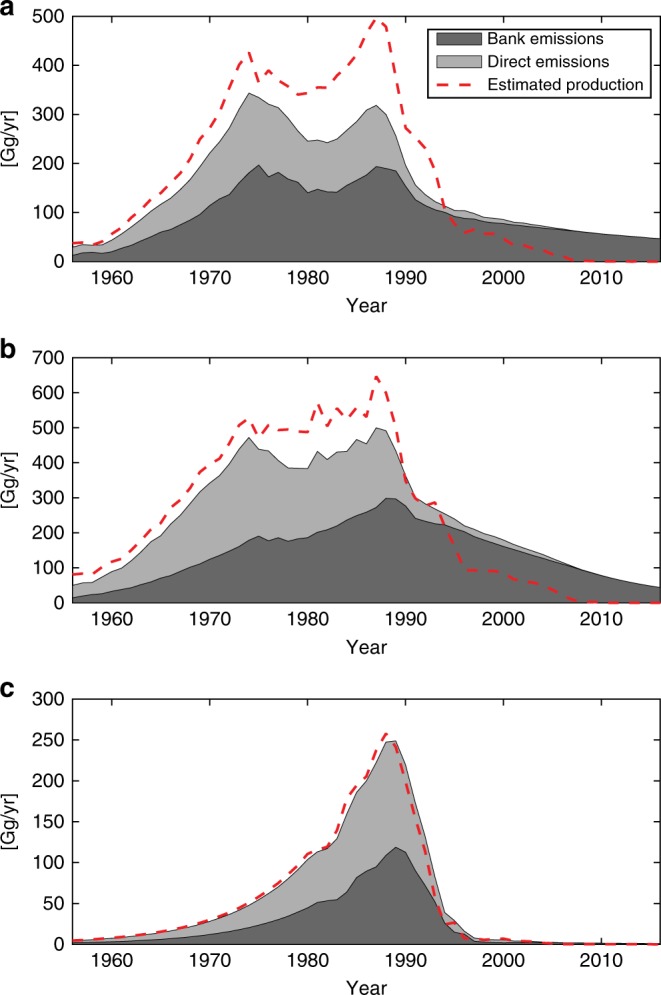
Chlorofluorocarbon (CFC) banks from uses such as air conditioners or foams can be emitted after global production stops. Recent reports of unexpected emissions of CFC-11 raise the need to better quantify releases from these banks, and associated impacts on ozone depletion and climate change. Here we develop a Bayesian probabilistic model for CFC-11, 12, and 113 banks and their emissions, incorporating the broadest range of constraints to date. We find that bank sizes of CFC-11 and CFC-12 are larger than recent international scientific assessments suggested, and can account for much of current estimated CFC-11 and 12 emissions (with the exception of increased CFC-11 emissions after 2012). Left unrecovered, these CFC banks could delay Antarctic ozone hole recovery by about six years and contribute 9 billion metric tonnes of equivalent CO2 emission. Derived CFC-113 emissions are subject to uncertainty, but are much larger than expected, raising questions about its sources.


Conflict of interest statement

The authors declare no competing interests.

Figures

Fig. 1
Fig. 1. Bank estimates and comparisons.
Comparison of banks derived from Bayesian Parameter Estimation (BPE) along with previously published values, top-down bank estimates, and alternative assumptions. a Top-down CFC-11 bank estimates assuming known lifetimes and reported production (see Eq. 2). Banks are derived using SPARC multi-model mean (MMM) time-varying atmospheric lifetimes (blue) and a constant lifetime of 45 years (red). b Top-down CFC-11 bank estimates assuming SPARC MMM time-varying lifetimes and three production scenarios: Reported production (blue), 1.05× reported production (red), and 1.1× reported production (yellow). For (a) and (b) production values are based on AFEAS and UNEP reported values (see Methods). c BPE-derived CFC-11 bank estimates assuming the SPARC MMM lifetime (blue) and constant lifetime of 45 years (red). The gray line is analogous to the blue line but production prior includes additional production to account for unexpected emissions from 2000 to 2016 (see Methods). d BPE-derived CFC-11 bank estimates assuming SPARC MMM time-varying lifetimes (average value of 62.9 years) shown in blue, and constant lifetime of 62.9 years is shown in red. Dashed lines are corresponding top-down bank estimates. e BPE-derived CFC-12 bank estimate assuming SPARC MMM lifetimes (average value of 112.9 years) shown in blue, and 100-year lifetime is shown in red. Dashed lines are corresponding top-down bank estimates. f BPE-derived CFC-113 bank estimates assuming SPARC MMM lifetimes (average value of 106.3 years) shown in blue, and 80-year lifetime is shown in red. Dashed lines are corresponding top-down bank estimates. The black line in (ac), (d) and (f) is the WMO (2003) bank estimate. For (c)–(f), the BPE median estimates are shown using thin solid lines with the 95% confidence intervals indicated by corresponding shaded region. The markers in plots (c) and (e) indicate previously published bank estimates as follows: the green marker is from Ashford (2004), the red marker is from TEAP(2009), the black marker is from WMO(2018), where banks were derived beginning with TEAP(2009) estimates, and the pink marker is from TEAP (2019).
Fig. 2
Fig. 2. Reported production and estimated sources of emissions.
a Mean annual estimates of CFC-11 bank emissions (dark gray) and direct emissions (light gray) resulting from the BPE analysis using the SPARC multi-model mean lifetime assumption, and reported production to build the priors (i.e. we assume no large unexpected production post 2000). The red dashed line shows annual reported production values. (b) as in (a) but for CFC-12. (c) as in (a) but for CFC-113.
Fig. 3
Fig. 3. Observationally derived and posterior CFC emissions.
Emissions estimates are shown for (a) CFC-11, (b) CFC-12, and (c) CFC-113. In each panel, an inset shows results after 2010 while the main panels cover 1955 to 2016. Red and blue lines show results for observationally derived emissions using the SPARC MMM and constant lifetimes, respectively. The gray line indicates the mean Bayesian estimate, the gray shaded region indicates the 95% confidence interval and the dashed line indicates the 99% confidence interval.
Fig. 4
Fig. 4. Measured and projected chlorine abundance and ozone recovery times.
Measured and projected Antarctic equivalent effective stratospheric chlorine (EESC) for all measured and projected abundances of ozone-depleting gases where mixing ratios come from the WMO 2018 assessment. a EESC contributions are stacked in a manner that optimizes understanding of what has dominated the recovery of EESC to date. b EESC contributions are stacked with CFCs shown on top, including three scenarios for CFC−11, CFC-12, and CFC-113 constructed using mean bank emissions estimates resulting from the BPE analysis. Scenario 1 (dotted black line) represents the business as usual scenario, where bank emissions are simulated using the median release fraction (RF) and the median BPE estimated bank size in 2016. The RF is held constant over the entire simulation period. In scenario 2 (dashed black line) the banks are destroyed in 2020 with no further emissions. Scenario 3 (dashed red line) is the same as Scenario 2 except the banks are destroyed in 2000 followed by no further emissions. The SPARC MMM 2010 atmospheric lifetime is used to estimate the projected CFC abundance for each of the scenarios. EESC values leading up to the scenario simulations use mixing ratios from WMO (2018).
Fig. 5
Fig. 5. Measured and projected estimates of CFC concentrations.
Concentrations are shown for (a) CFC-11, (b) CFC-12 and c) CFC-113. In each panel, an inset shows results from 2010 to 2040 while the main panels cover 1955 to 2100. For each panel, the blue line shows the WMO 2018 concentration estimates and projections. The black lines (Scen A in each panel) shows the concentrations projections using the median bank size and release fraction from our analysis starting in 2017 under the reported production scenario. The shaded gray region represents 1s.d. of uncertainty due to uncertainties in bank estimates. For (a) Scen B is equivalent to Scen A, except allows banks to account for the unexpected emissions scenario from 2000 to 2019, and Scen C is equivalent to Scen B except it allows the unexpected emissions to continue to 2029. For (c), Scen B allows for an additional 7.2 Gg yr−1 of production until 2029 with the shaded region representing 1-s.d. of uncertainty in continued production (±5 Gg yr−1).

References

    1. Newman PA, et al. What would have happened to the ozone layer if chlorofluorocarbons (CFCs) had not been regulated? Atmos. Chem. Phys. 2009;9:2113–2128. doi: 10.5194/acp-9-2113-2009. - DOI
    1. Solomon S, et al. Emergence of healing in the Antarctic ozone layer. Science. 2016;353:269–274. doi: 10.1126/science.aae0061. - DOI - PubMed
    1. WMO: Scientific Assessment of Ozone Depletion. Glob. Ozone Res. Monit. Proj.—Rep. No. 2018;58:588.
    1. Montzka SA, et al. An unexpected and persistent increase in global emissions of ozone-depleting CFC-11. Nature. 2018;557:413. doi: 10.1038/s41586-018-0106-2. - DOI - PubMed
    1. Rigby M, et al. Increase in CFC-11 emissions from eastern China based on atmospheric observations. Nature. 2019;569:546–550. doi: 10.1038/s41586-019-1193-4. - DOI - PubMed

Publication types