

Longitudinal imaging of T cell-based immunotherapy with multi-spectral, multi-scale optoacoustic tomography
- PMID: 32184401
- PMCID: PMC7078227
- DOI: 10.1038/s41598-020-61191-z
Longitudinal imaging of T cell-based immunotherapy with multi-spectral, multi-scale optoacoustic tomography
Abstract
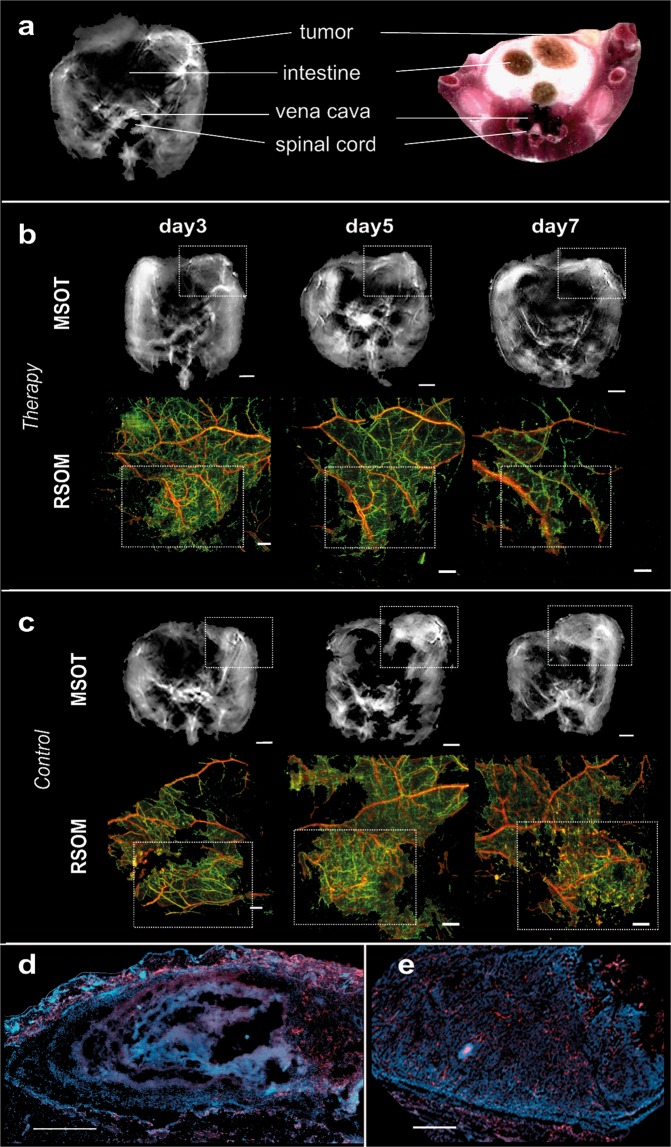
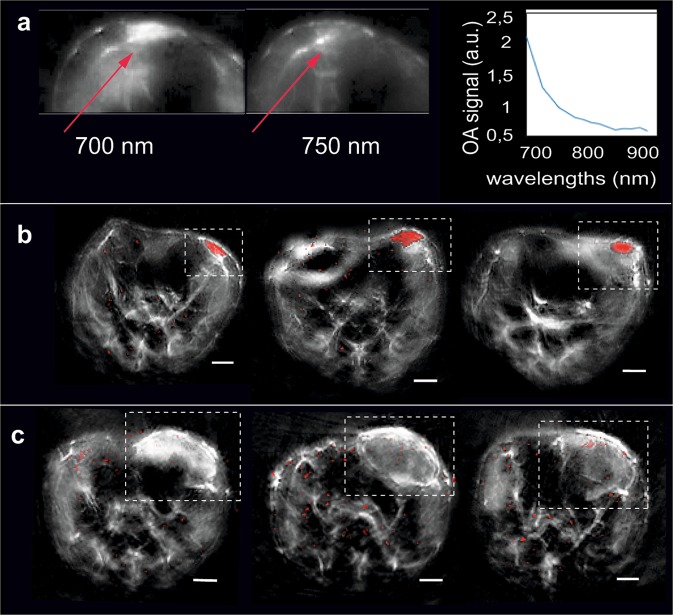
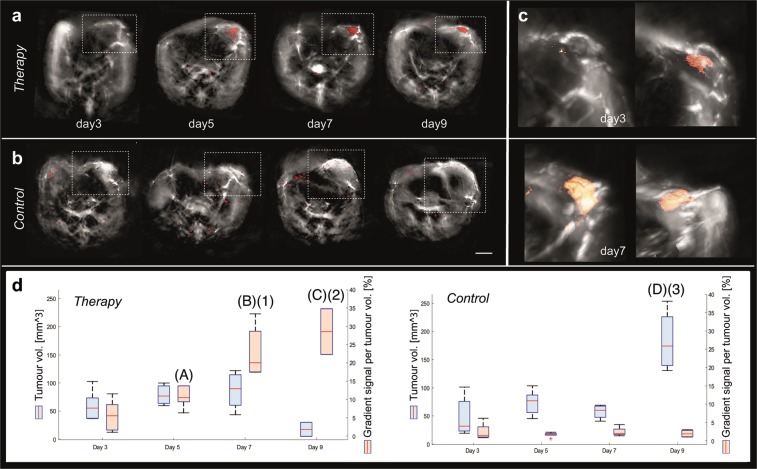
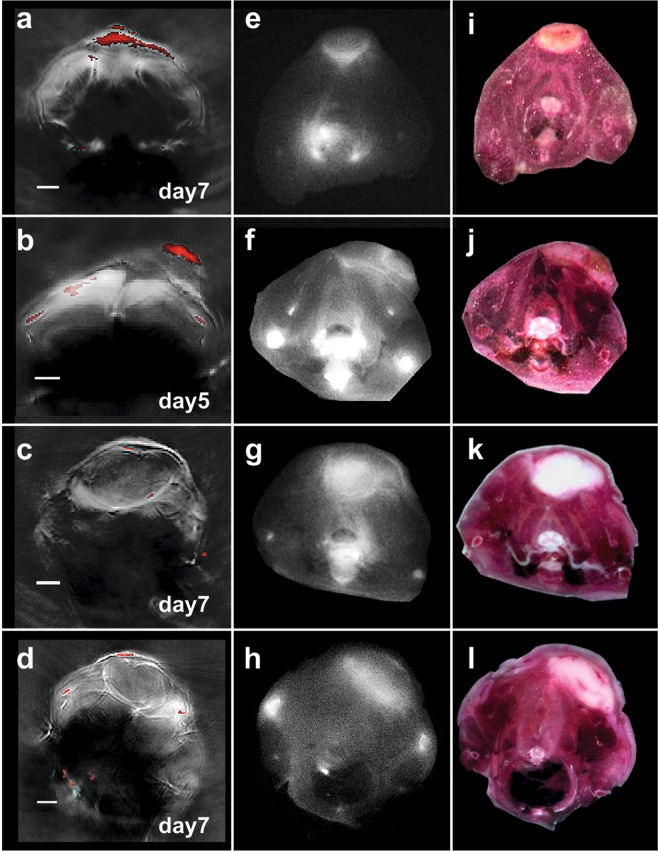
Most imaging studies of immunotherapy have focused on tracking labeled T cell biodistribution in vivo for understanding trafficking and homing parameters and predicting therapeutic efficacy by the presence of transferred T cells at or in the tumour mass. Conversely, we investigate here a novel concept for longitudinally elucidating anatomical and pathophysiological changes of solid tumours after adoptive T cell transfer in a preclinical set up, using previously unexplored in-tandem macroscopic and mesoscopic optoacoustic (photoacoustic) imaging. We show non-invasive in vivo observations of vessel collapse during tumour rejection across entire tumours and observe for the first time longitudinal tumour rejection in a label-free manner based on optical absorption changes in the tumour mass due to cellular decline. We complement these observations with high resolution episcopic fluorescence imaging of T cell biodistribution using optimized T cell labeling based on two near-infrared dyes targeting the cell membrane and the cytoplasm. We discuss how optoacoustic macroscopy and mesoscopy offer unique contrast and immunotherapy insights, allowing label-free and longitudinal observations of tumour therapy. The results demonstrate optoacoustic imaging as an invaluable tool in understanding and optimizing T cell therapy.
Conflict of interest statement
V.N. is an equity owner and consultant of iThera Medical GmbH, an owner of Spear UG and a member of the Scientific Advisory Board of SurgVision BV/Bracco Sp.A. The other authors declare no competing interests.
Figures
Similar articles
-
Immune cell imaging using multi-spectral optoacoustic tomography.Opt Lett. 2014 Jun 15;39(12):3523-6. doi: 10.1364/OL.39.003523. Opt Lett. 2014. PMID: 24978527
-
Dynamic imaging of PEGylated indocyanine green (ICG) liposomes within the tumor microenvironment using multi-spectral optoacoustic tomography (MSOT).Biomaterials. 2015 Jan;37:415-24. doi: 10.1016/j.biomaterials.2014.10.014. Epub 2014 Oct 23. Biomaterials. 2015. PMID: 25453969
-
Simultaneous visualization of tumour oxygenation, neovascularization and contrast agent perfusion by real-time three-dimensional optoacoustic tomography.Eur Radiol. 2016 Jun;26(6):1843-51. doi: 10.1007/s00330-015-3980-0. Epub 2015 Sep 3. Eur Radiol. 2016. PMID: 26334513
-
Optoacoustic imaging in endocrinology and metabolism.Nat Rev Endocrinol. 2021 Jun;17(6):323-335. doi: 10.1038/s41574-021-00482-5. Epub 2021 Apr 19. Nat Rev Endocrinol. 2021. PMID: 33875856 Review.
-
Multi-scale optoacoustic molecular imaging of brain diseases.Eur J Nucl Med Mol Imaging. 2021 Dec;48(13):4152-4170. doi: 10.1007/s00259-021-05207-4. Epub 2021 Feb 16. Eur J Nucl Med Mol Imaging. 2021. PMID: 33594473 Free PMC article. Review.
Cited by
-
Imaging increased metabolism in the spinal cord in mice after middle cerebral artery occlusion.Photoacoustics. 2023 Jul 15;32:100532. doi: 10.1016/j.pacs.2023.100532. eCollection 2023 Aug. Photoacoustics. 2023. PMID: 37645255 Free PMC article.
-
Bioceramics Enhance the Anti-Tumor Activity of Immune Cells in Adoptive Immunotherapy.Int J Mol Sci. 2024 Sep 30;25(19):10567. doi: 10.3390/ijms251910567. Int J Mol Sci. 2024. PMID: 39408898 Free PMC article.
-
Smart probes for optical imaging of T cells and screening of anti-cancer immunotherapies.Chem Soc Rev. 2023 Aug 14;52(16):5352-5372. doi: 10.1039/d2cs00928e. Chem Soc Rev. 2023. PMID: 37376918 Free PMC article. Review.
-
In vivo imaging of nanoparticle-labeled CAR T cells.Proc Natl Acad Sci U S A. 2022 Feb 8;119(6):e2102363119. doi: 10.1073/pnas.2102363119. Proc Natl Acad Sci U S A. 2022. PMID: 35101971 Free PMC article.
-
Chemotherapeutic effects on breast tumor hemodynamics revealed by eigenspectra multispectral optoacoustic tomography (eMSOT).Theranostics. 2021 Jun 26;11(16):7813-7828. doi: 10.7150/thno.56173. eCollection 2021. Theranostics. 2021. PMID: 34335966 Free PMC article.
References
Publication types
MeSH terms
LinkOut - more resources
Full Text Sources
