

Feasibility and reliability of continuously monitoring alcohol use among female adolescents and young adults
- PMID: 32185847
- PMCID: PMC9810269
- DOI: 10.1111/dar.13045
Feasibility and reliability of continuously monitoring alcohol use among female adolescents and young adults
Abstract
Introduction and aims: Transdermal alcohol sensors allow objective, continuous monitoring and have potential to expand current research on adolescent and young adult alcohol use. The purpose of this manuscript is to evaluate the feasibility and reliability of transdermal alcohol sensor use among female adolescents as compared to female young adults.
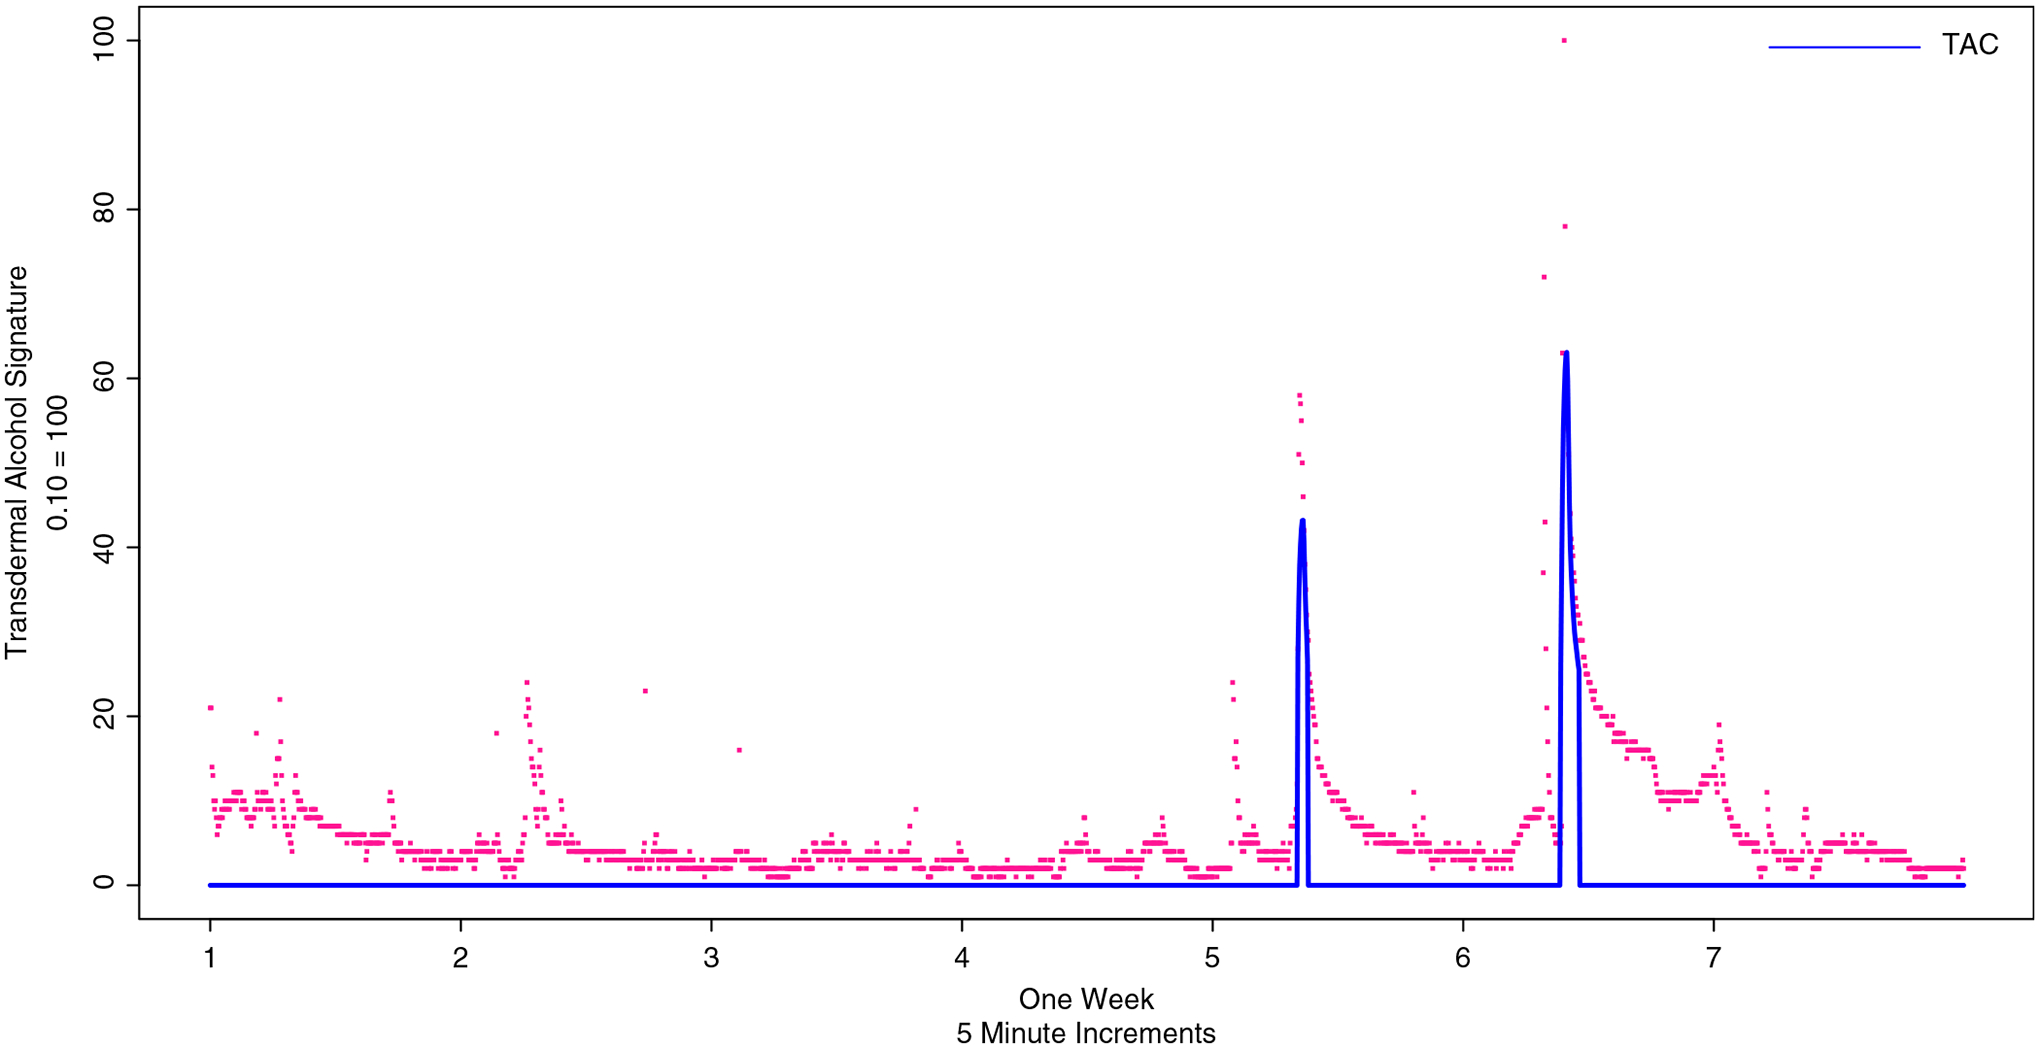
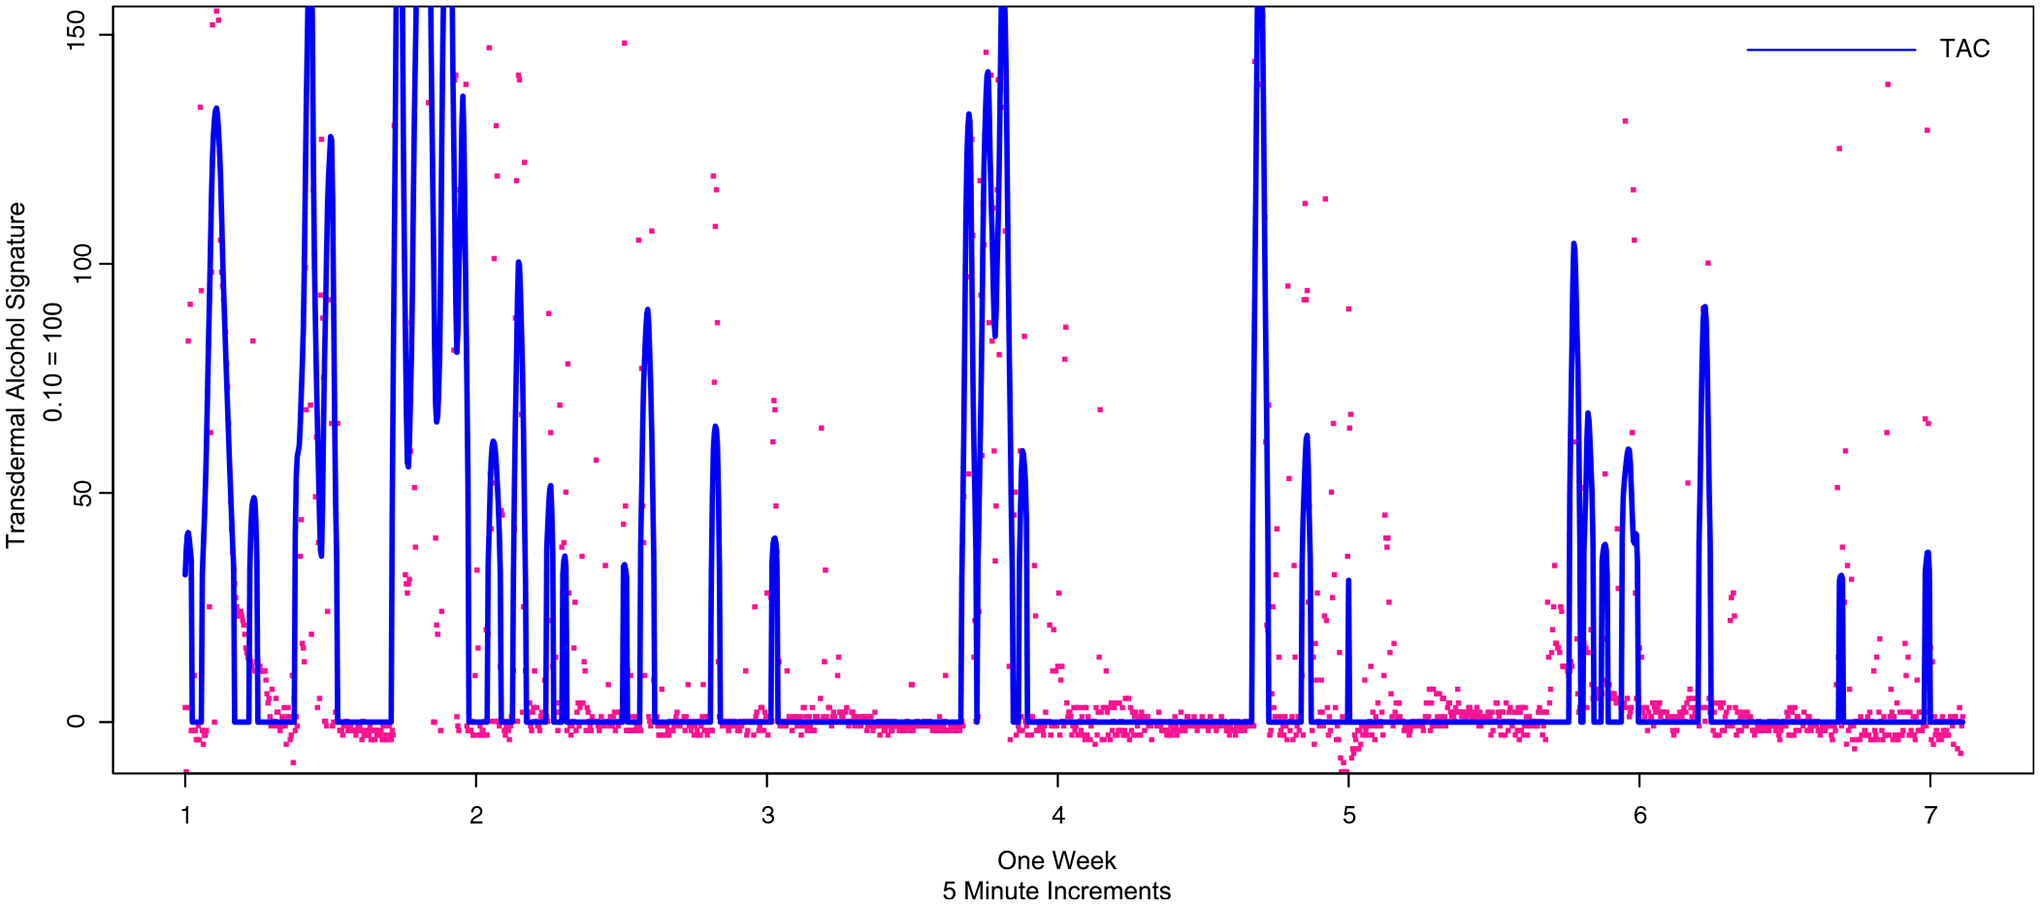
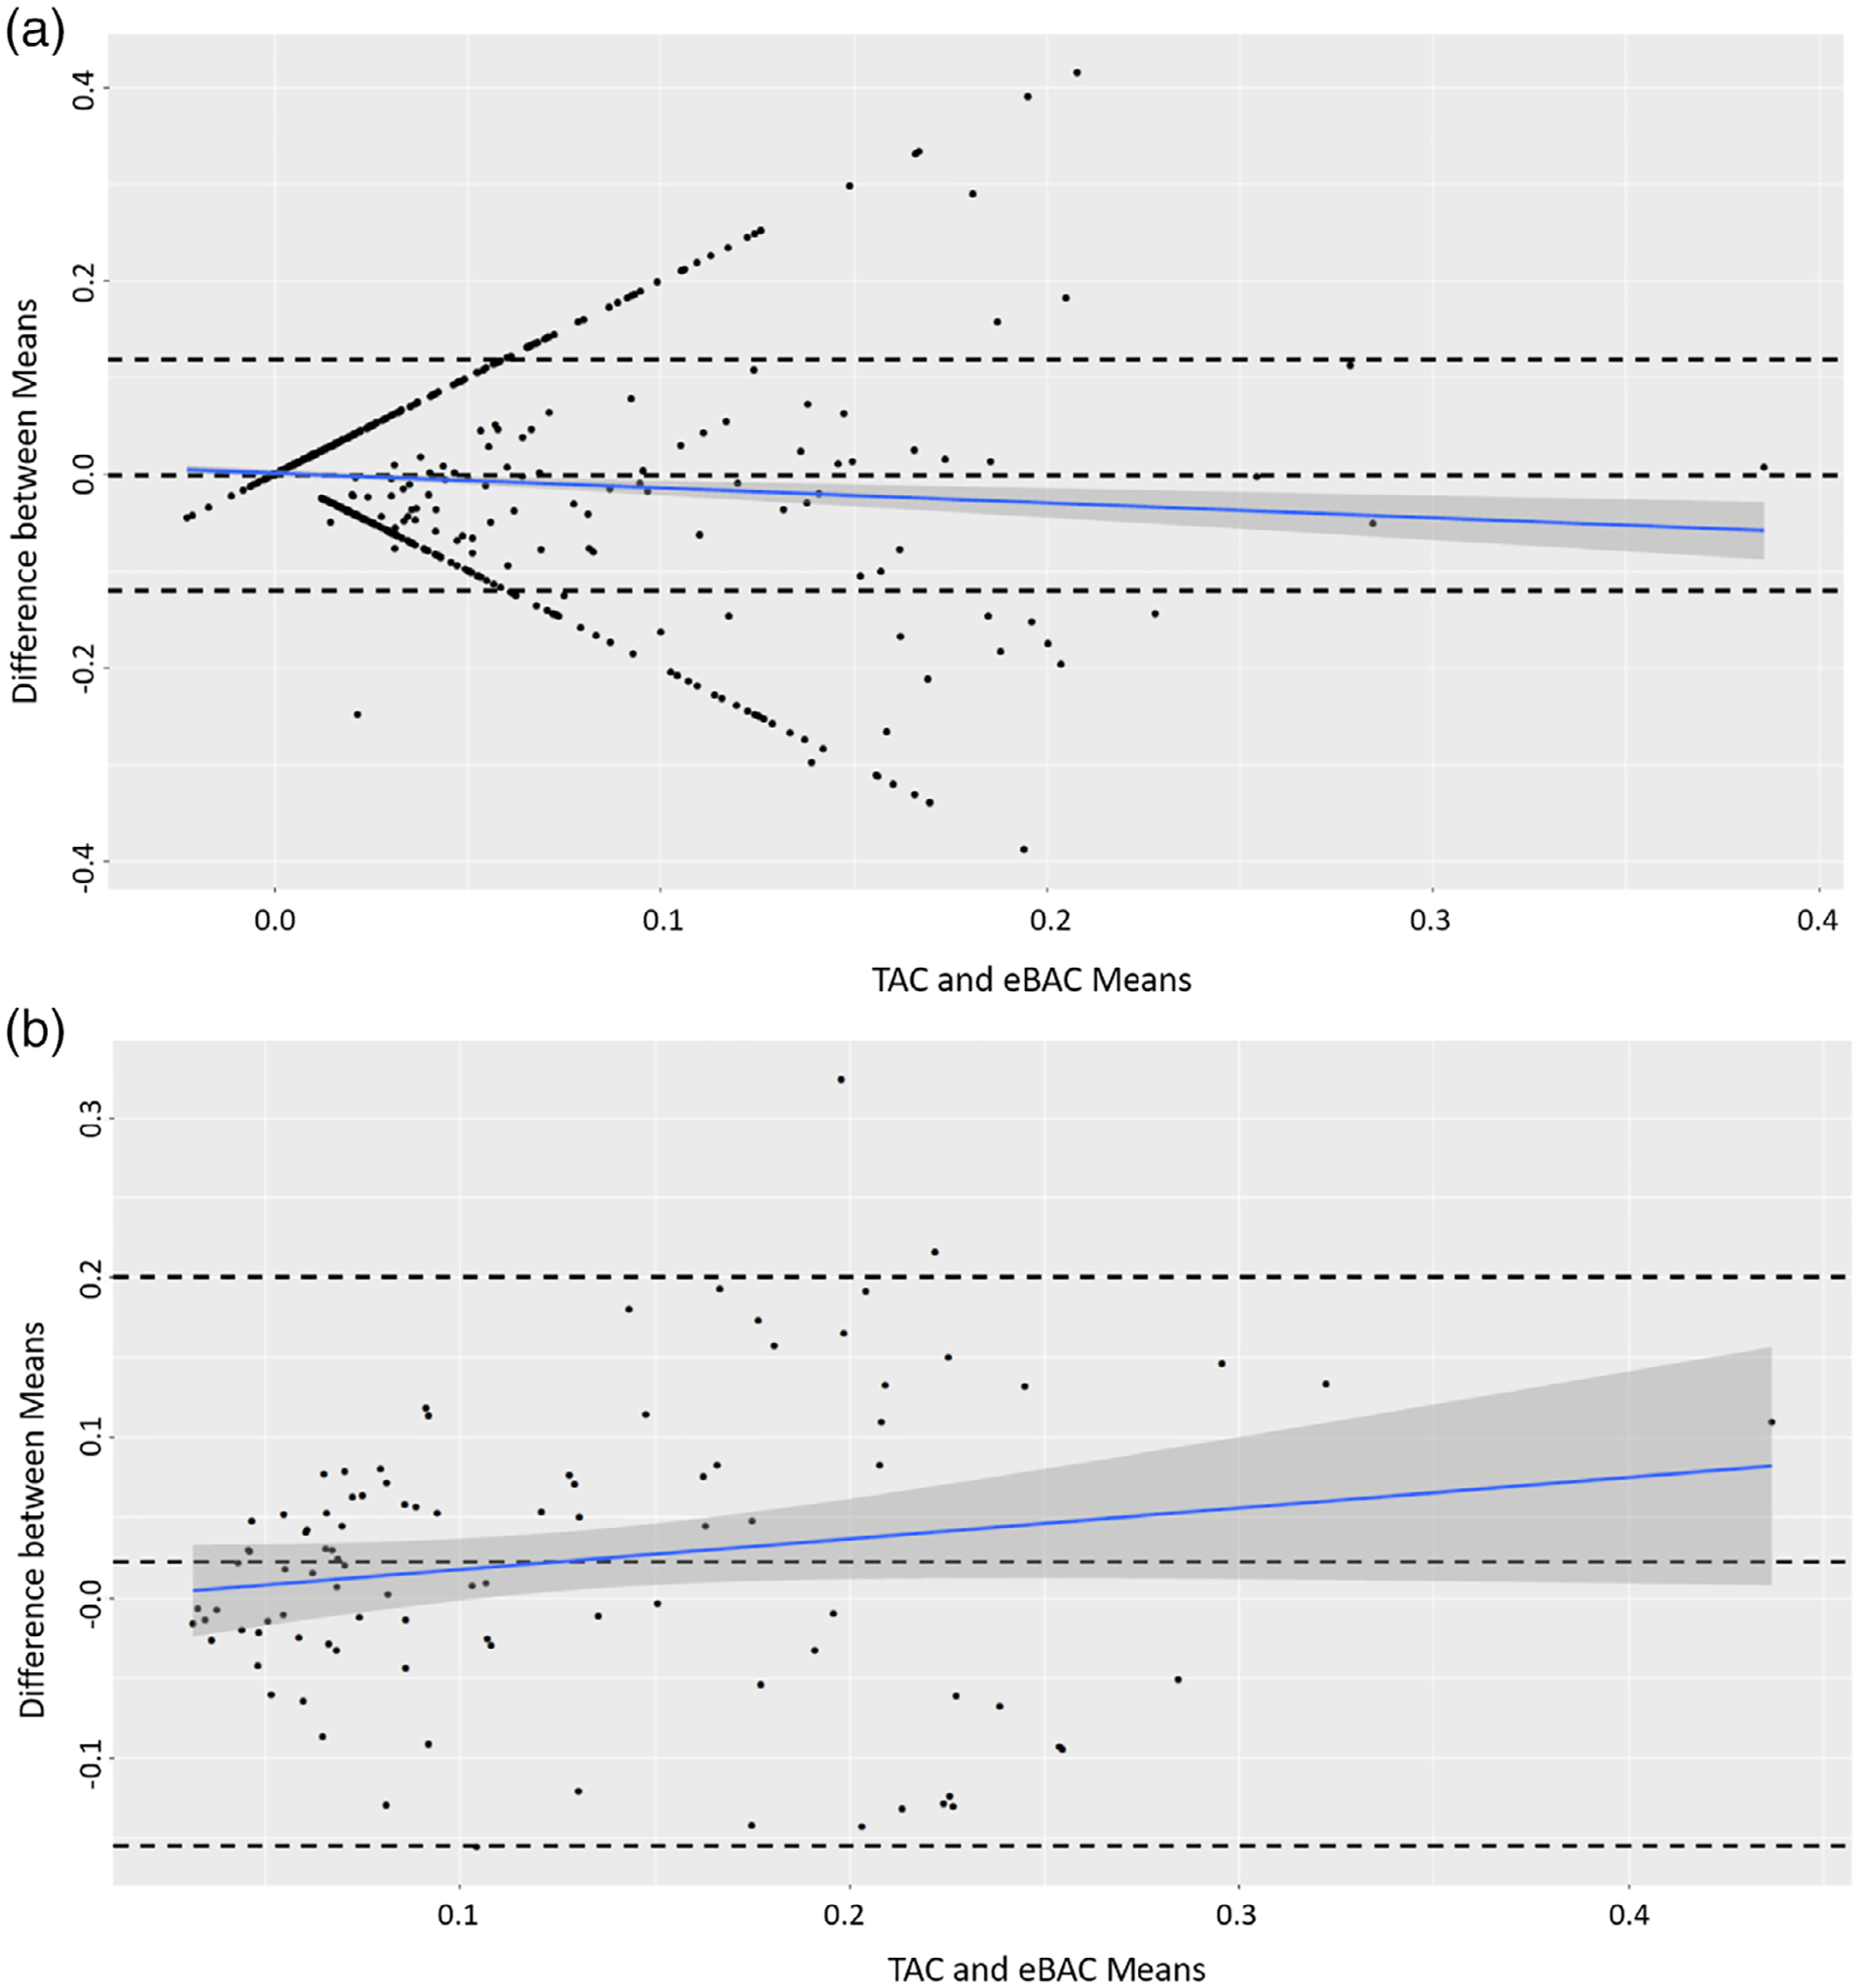
Design and methods: This trial included 59 female adolescents and young adults aged 14-24 years who reported drinking during the previous month. All participants were asked to wear a Giner Wrist Transdermal Alcohol Sensor (WrisTAS)-7 over a 1 month prospective study. Participants came to the research lab weekly to complete a detailed self-report of behaviours, including day of drinking events, amounts and types of alcohol use and length of drinking events. Estimates of blood alcohol concentration (eBAC) were computed from self-report data using the Matthew and Miller, NHTSA and Zhang equations. Daily transdermal alcohol concentration (TAC) peaks and calculated eBAC peak data were analysed with paired-samples t-tests and repeated measures correlations for validity comparisons.
Results: All participants (100%, n = 59) completed the trial, however, two participants were removed due to greater than 50% of missing transdermal alcohol sensor data. Of the 57 participants, the data included 1,722 days of continuous alcohol monitoring. Missing data was recorded more frequently among female adolescents at about (11.78%) as compared to female young adults (8.59%; χ2 = -18.40, P < 0.001). Participant self-report of drinking occurred with greater frequency (374 events) than detected by the WrisTAS transdermal alcohol sensors (243 events). On days when self-report and sensor data indicated a drinking event, participants' eBAC was moderately correlated with TAC, after accounting for repeated measures.
Discussion and conclusions: This study finds that transdermal alcohol sensors are moderately reliable when sensor data is paired with self-report. This objective data collection method may improve the ability to collect alcohol curves among adolescents.
Keywords: estimates of blood alcohol concentration; female adolescent; female young adult; transdermal alcohol concentration; transdermal alcohol sensor.
© 2020 Australasian Professional Society on Alcohol and other Drugs.
Conflict of interest statement
Conflict of Interest
The authors have no conflicts of interest to declare.
Figures
References
-
- Chen CM, Yoon Y, Faden VB. NIAAA Surveillance report #107: Trends in underage drinking the U.S. 1991–2015. Rockville, M.D.: Alcohol Res, 2017.
-
- Epstein JA, Botvin GJ, Diaz T, Schinke SP. The role of social factors and individual characteristics in promoting alcohol use among inner-city minority youths. J Stud Alcohol 1995;56:39–46. - PubMed
-
- Substance Abuse and Mental Health Services Administration. Key indicators in the US: Results from the 2016 National Survey on Drug Use and Health. (HHS publication number SMA 17–5044, NSDUH series H-52). Rockville, MD: Center for Behavioral Health Statistics and Quality, Substance Abuse and Mental Health Services Administration, 2017.
-
- Substance Abuse and Mental Health Services Administration. (2011). Results from the 2010 National Survey on drug use and health: summary of National Findings, NSDUH Series H-41, HHS Publication No. (SMA) 11–4658. Rockville, MD: Substance Abuse and Mental Health Services Administration.
Publication types
MeSH terms
Substances
Grants and funding
LinkOut - more resources
Full Text Sources
Medical
Miscellaneous
