

The Relationship Between Body Mass Index and Pain Intensity Among Veterans with Musculoskeletal Disorders: Findings from the MSD Cohort Study
- PMID: 32186722
- PMCID: PMC7778330
- DOI: 10.1093/pm/pnaa043
The Relationship Between Body Mass Index and Pain Intensity Among Veterans with Musculoskeletal Disorders: Findings from the MSD Cohort Study
Abstract
Objective: To examine the relationship between body mass index (BMI) and pain intensity among veterans with musculoskeletal disorder diagnoses (MSDs; nontraumatic joint disorder; osteoarthritis; low back, back, and neck pain).
Setting: Administrative and electronic health record data from the Veterans Health Administration (VHA).
Subjects: A national cohort of US military veterans with MSDs in VHA care during 2001-2012 (N = 1,759,338).
Methods: These cross-sectional data were analyzed using hurdle negative binomial models of pain intensity as a function of BMI, adjusted for comorbidities and demographics.
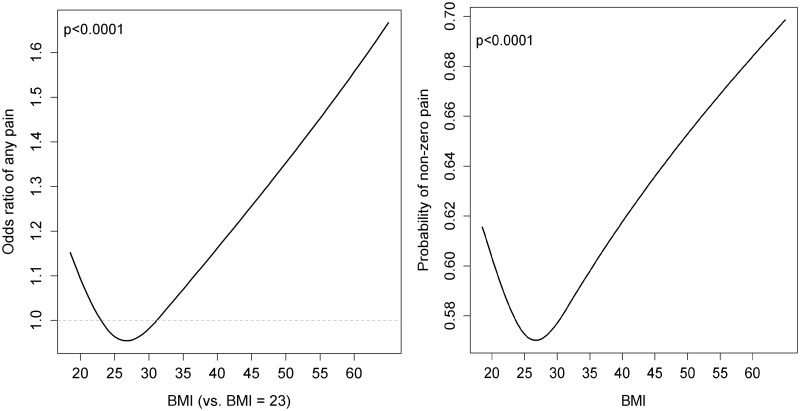
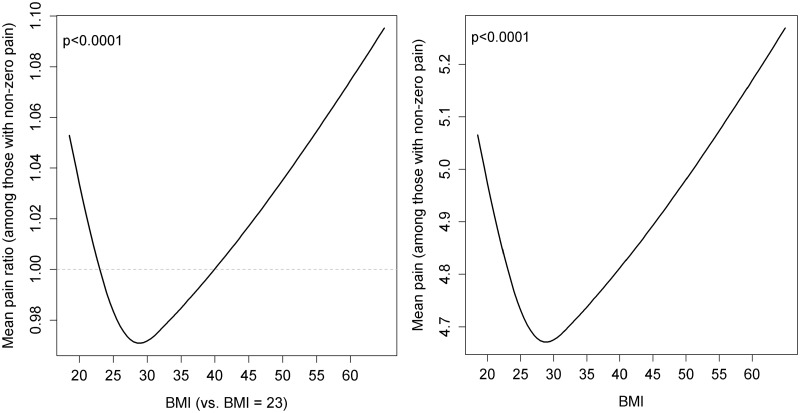
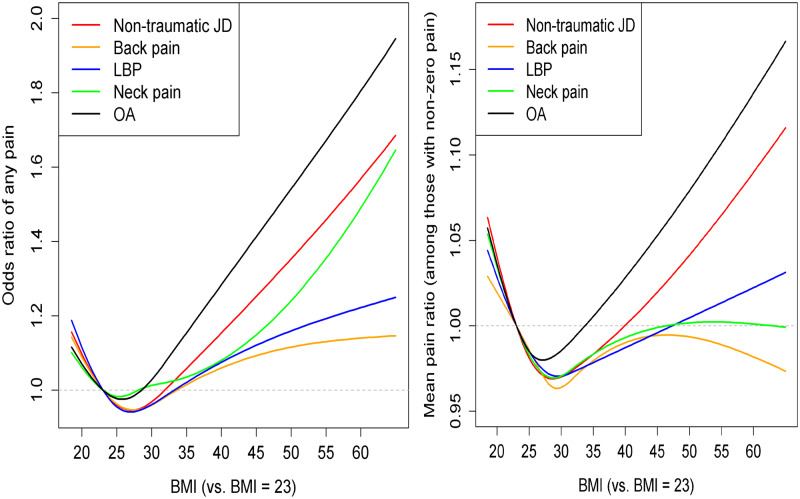
Results: The sample had a mean age of 59.4, 95% were male, 77% were white/Non-Hispanic, 79% were overweight or obese, and 42% reported no pain at index MSD diagnosis. Overall, there was a J-shaped relationship between BMI and pain (nadir = 27 kg/m2), with the severely obese (BMI ≥ 40 kg/m2) being most likely to report any pain (OR vs normal weight = 1.23, 95% confidence interval = 1.21-1.26). The association between BMI and pain varied by MSD, with a stronger relationship in the osteoarthritis group and a less pronounced relationship in the back and low back pain groups.
Conclusions: There was a high prevalence of overweight/obesity among veterans with MSD. High levels of BMI (>27 kg/m2) were associated with increased odds of pain, most markedly among veterans with osteoarthritis.
Keywords: Chronic Pain; Musculoskeletal; Obesity; Osteoarthritis.
© The Author(s) 2020. Published by Oxford University Press on behalf of the American Academy of Pain Medicine. All rights reserved. For permissions, please e-mail: journals.permissions@oup.com.
Figures
References
-
- Flegal KM. Prevalence and trends in obesity among US adults, 1999-2008. JAMA 2010;303(3):235–41. - PubMed
-
- Stone AA, Broderick JE.. Obesity and pain are associated in the United States. Obesity (Silver Spring) 2012;20(7):1491–5. - PubMed
-
- Jinks C, Jordan KP, Blagojevic M, et al. Predictors of onset and progression of knee pain in adults living in the community. A prospective study. Rheumatology (Oxford) 2007;47(3):368–74. - PubMed
-
- Shiri R, Karppinen J, Leino-Arjas P, et al. The association between smoking and low back pain: A meta-analysis. Am J Med 2010;123(1):87.e7–35. - PubMed
