. 2020 Jun;45(6):1644-1660.
doi: 10.3892/ijmm.2020.4537. Epub 2020 Mar 12.

Muscle metabolomics analysis reveals potential biomarkers of exercise‑dependent improvement of the diaphragm function in chronic obstructive pulmonary disease

Affiliations

Muscle metabolomics analysis reveals potential biomarkers of exercise‑dependent improvement of the diaphragm function in chronic obstructive pulmonary disease

Jian Li et al. Int J Mol Med. 2020 Jun.

Abstract

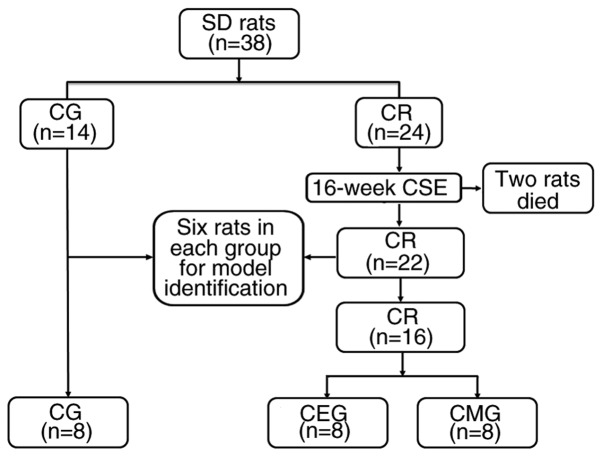
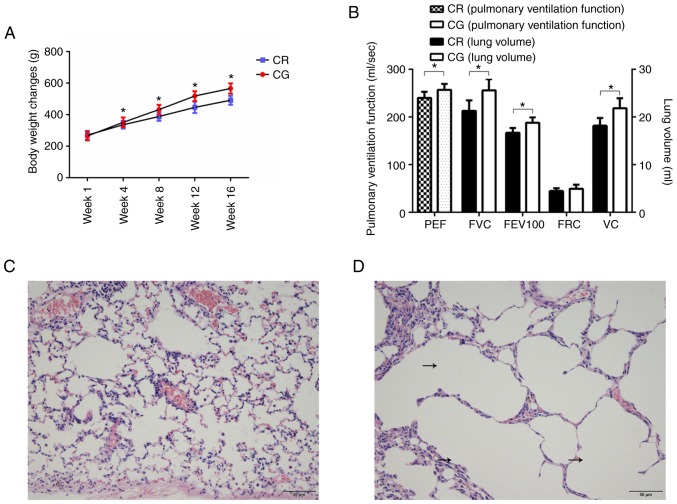
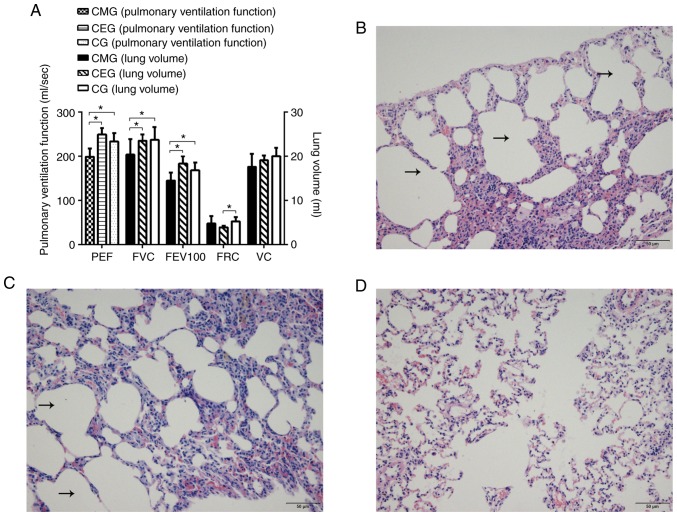
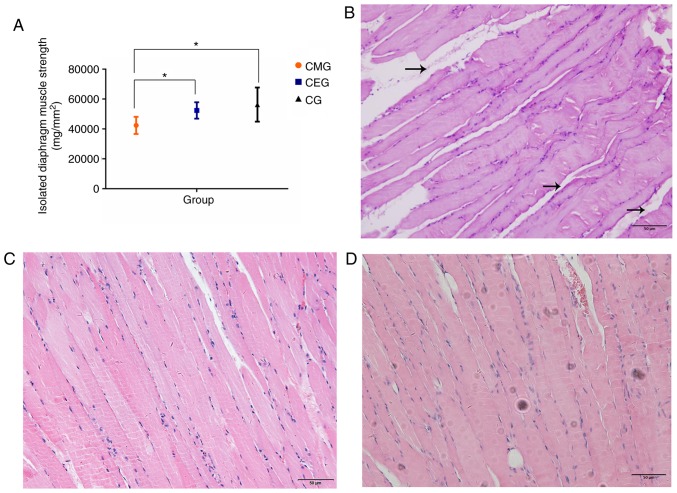
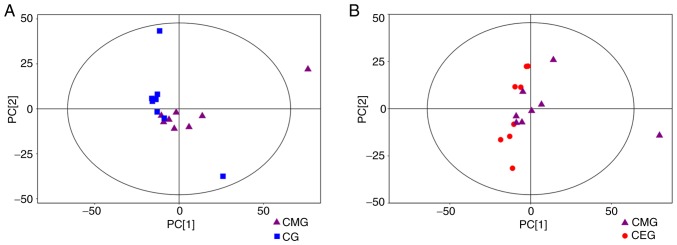
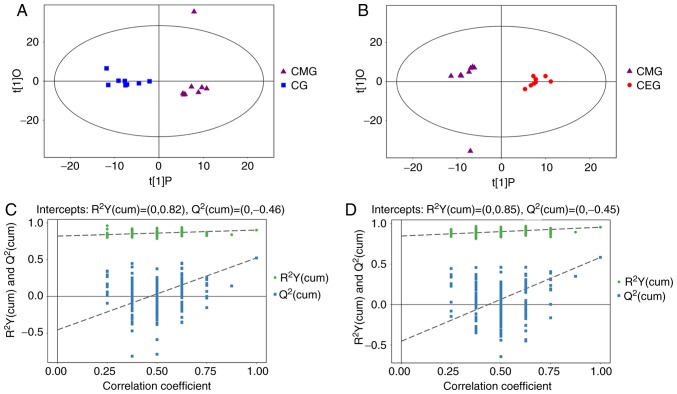
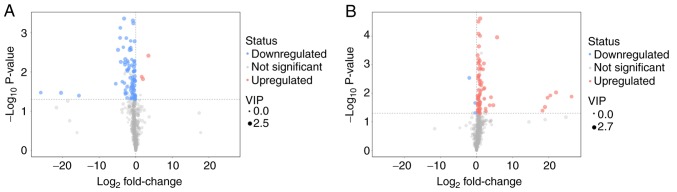
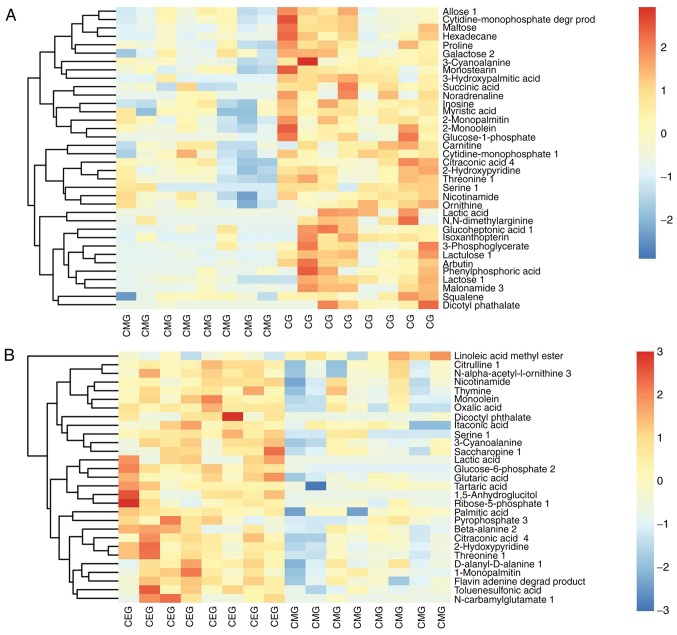
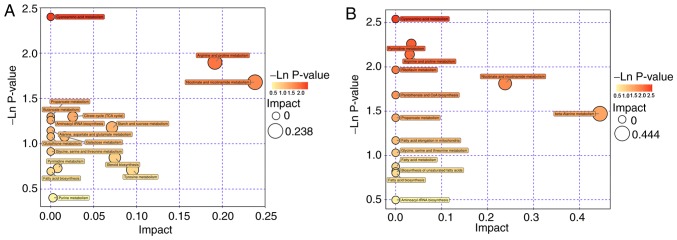
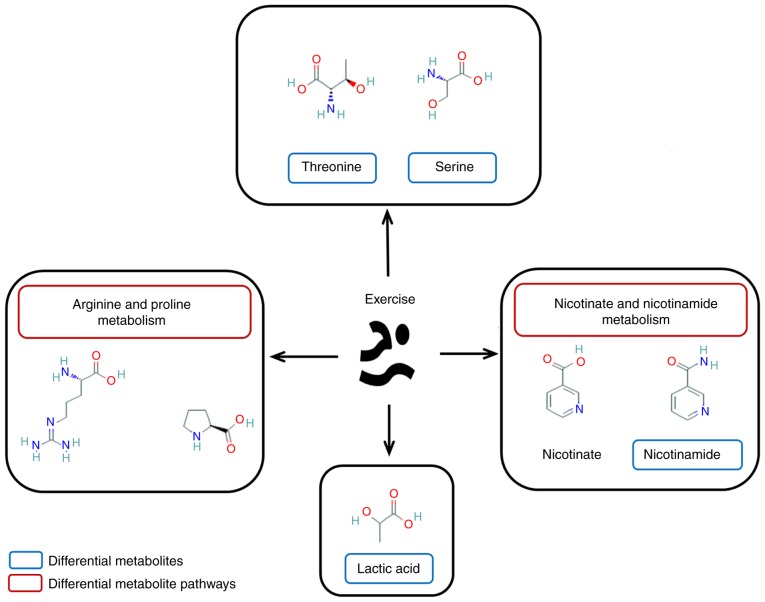
Decreased diaphragm function is a crucial factor leading to reduced ventilatory efficiency and worsening of quality of life in chronic obstructive pulmonary disease (COPD). Exercise training has been demonstrated to effectively improve the function of the diaphragm. However, the mechanism of this process has not been identified. The emergence of metabolomics has allowed the exploration of new ideas. The present study aimed to analyze the potential biomarkers of exercise‑dependent enhancement of diaphragm function in COPD using metabolomics. Sprague Dawley rats were divided into three groups: COPD + exercise group (CEG); COPD model group (CMG); and control group (CG). The first two groups were exposed to cigarette smoke for 16 weeks to establish a COPD model. Then, the rats in the CEG underwent aerobic exercise training for 9 weeks. Following confirmation that exercise effectively improved the diaphragm function, a gas chromatography tandem time‑of‑flight mass spectrometry analysis system was used to detect the differential metabolites and associated pathways in the diaphragm muscles of the different groups. Following exercise intervention, the pulmonary function and diaphragm contractility of the CEG rats were significantly improved compared with those of the CMG rats. A total of 36 different metabolites were identified in the comparison between the CMG and the CG. Pathway enrichment analysis indicated that these different metabolites were involved in 17 pathways. A total of 29 different metabolites were identified in the comparison between the CMG and the CEG, which are involved in 14 pathways. Candidate biomarkers were selected, and the pathways analysis of these metabolites demonstrated that 2 types of metabolic pathways, the nicotinic acid and nicotinamide metabolism and arginine and proline metabolism pathways, were associated with exercise‑induced pulmonary rehabilitation.


Figures

Figure 1
Figure 1
Flow chart of animal grouping. SD rats, Sprague-Dawley rats; CSE, cigarette smoke exposure; COPD, chronic obstructive pulmonary disease; CR, COPD rats; CG, control group; CMG, COPD model group; CEG, COPD + exercise group.
Figure 2
Figure 2
Bodyweight and pulmonary function and structure following model establishment. (A) Weight change during model establishment. (B) Comparison of pulmonary function between model rats and CG. (C) Pulmonary structure in CG. Scale bar=50 µm. (D) Pulmonary structure in model rats. Scale bar=50 µm. The black arrows indicate the enlarged alveoli. *P<0.05. PEF, peak expiratory flow; FVC, forced vital capacity; FEV100, 100 milliseconds forced expiratory volume; FRC, functional residual capacity; VC, vital capacity; peak expiratory flow; CR, chronic obstructive pulmonary disease rats; CG, control group.
Figure 3
Figure 3
Pulmonary function and histological changes following intervention. (A) Comparison of pulmonary function of rats in each group following intervention. (B) Histological structure of CMG lung tissues. The black arrows indicate the enlarged alveoli. Scale bar=50 µm. (C) Histological structure of CEG lung tissues. The black arrows indicate the enlarged alveoli. Scale bar=50 µm. (D) Histological structure of CG lung tissues. Scale bar=50 µm. *P<0.05. PEF, peak expiratory flow; FVC, forced vital capacity; FEV100, 100 milliseconds forced expiratory volume; FRC, functional residual capacity; VC, vital capacity; peak expiratory flow; COPD, chronic obstructive pulmonary disease; CMG, COPD model group; CEG, COPD + exercise group; CG, control group.
Figure 4
Figure 4
Changes in diaphragm muscle strength and histology after the intervention. (A) Diaphragm strength among three different groups following intervention. (B) Histological observations of the diaphragm tissues in the CMG. The black arrows indicate the enlarged muscle fiber gaps. Scale bar=50 µm. (C) Histological observations of the diaphragm tissues in the CEG. Scale bar=50 µm. (D) Histological observations of the diaphragm tissues in the CG. Scale bar=50 µm. *P<0.05. COPD, chronic obstructive pulmonary disease; CMG, COPD model group; CEG, COPD + exercise group; CG, control group.
Figure 5
Figure 5
Score scatter plot of the PCA model. (A) Score scatter plot of the PCA model for CG vs. CMG. (B) Score scatter plot of the PCA model for CMG vs. CEG. Most samples in the score plots were within the 95% Hotelling's T-squared ellipse. PCA, principal component analysis; COPD, chronic obstructive pulmonary disease; CMG, COPD model group; CEG, COPD + exercise group; CG, control group.
Figure 6
Figure 6
Results of OPLS-DA. (A) Score scatter plot of the OPLS-DA model for CG vs. CMG. (B) Score scatter plot of the OPLS-DA model for CMG vs. CEG. (C) Permutation test of the OPLS-DA model for CG vs. CMG. (D) Permutation test of the OPLS-DA model for CMG vs. CEG. CMG, COPD model group; CEG, COPD plus exercise group; CG, control group; OPLS-DA, orthogonal projections to latent structures-discriminant analysis; COPD, chronic obstructive pulmonary disease; CMG, COPD model group; CEG, COPD + exercise group; CG, control group.
Figure 7
Figure 7
Volcano plot. (A) Volcano plot for CG vs. CMG. (B) Volcano plot for CMG vs. CEG. VIP, Variable Importance in the Projection; COPD, chronic obstructive pulmonary disease; CMG, COPD model group; CEG, COPD + exercise group; CG, control group.
Figure 8
Figure 8
Heatmap of hierarchical clustering analysis. (A) Heatmap of hierarchical clustering analysis for CG vs. CMG. (B) Heatmap of hierarchical clustering analysis for CMG vs. CEG. CMG, COPD model group; CEG, COPD + exercise group; CG, control group.
Figure 9
Figure 9
Pathway analysis. (A) Pathway analysis for CG vs. CMG. (B) Pathway analysis for CMG vs. CEG. COPD, chronic obstructive pulmonary disease; CMG, COPD model group; CEG, COPD + exercise group; CG, control group.
Figure 10
Figure 10
Major metabolites and corresponding pathways affected by exercise. The shared expression of metabolites and their corresponding pathways in separate group comparisons were suggested to be involved in the potential mechanisms of action of exercise-induced diaphragm function enhancement.

Similar articles

Cited by

References

    1. Horner A, Soriano JB, Puhan MA, Studnicka M, Kaiser B, Vanfleteren LEGW, Gnatiuc L, Burney P, Miravitlles M, García-Rio F, et al. Altitude and COPD prevalence: Analysis of the PREPOCOL-PLATINO-BOLD-EPI-SCAN study. Respir Res. 2017;18:162. doi: 10.1186/s12931-017-0643-5. - DOI - PMC - PubMed
    1. Mesquita R, Donária L, Genz IC, Pitta F, Probst VS. Respiratory muscle strength during and after hospitalization for COPD exacerbation. Respir Care. 2013;58:2142–2149. doi: 10.4187/respcare.02393. - DOI - PubMed
    1. Hodgev VA, Kostianev SS. Maximal inspiratory pressure predicts mortality in patients with chronic obstructive pulmonary disease in a five-year follow-up. Folia Med. 2006;48:36–41. - PubMed
    1. Newell SZ, McKenzie DK, Gandevia SC. Inspiratory and skeletal muscle strength and endurance and diaphragmatic activation in patients with chronic airflow limitation. Thorax. 1989;44:903–912. doi: 10.1136/thx.44.11.903. - DOI - PMC - PubMed
    1. Fabbri LM, Rabe KF. From COPD to chronic systemic inflammatory syndrome? Lancet. 2007;370:797–799. doi: 10.1016/S0140-6736(07)61383-X. - DOI - PubMed