. 2020 May 7;48(8):4274-4297.
doi: 10.1093/nar/gkaa103.

High density of unrepaired genomic ribonucleotides leads to Topoisomerase 1-mediated severe growth defects in absence of ribonucleotide reductase

Affiliations

High density of unrepaired genomic ribonucleotides leads to Topoisomerase 1-mediated severe growth defects in absence of ribonucleotide reductase

Susana M Cerritelli et al. Nucleic Acids Res. .

Abstract

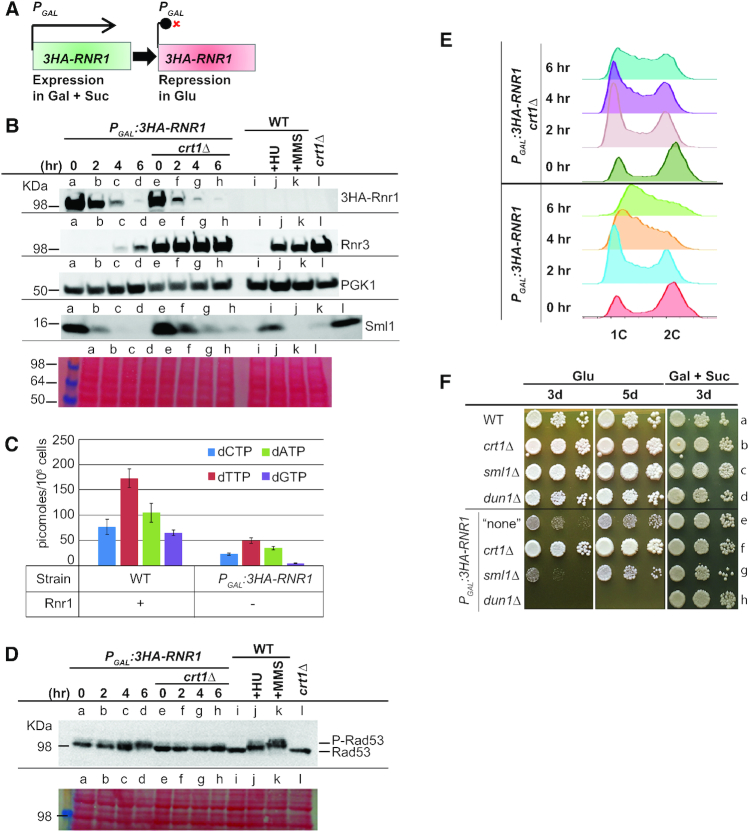
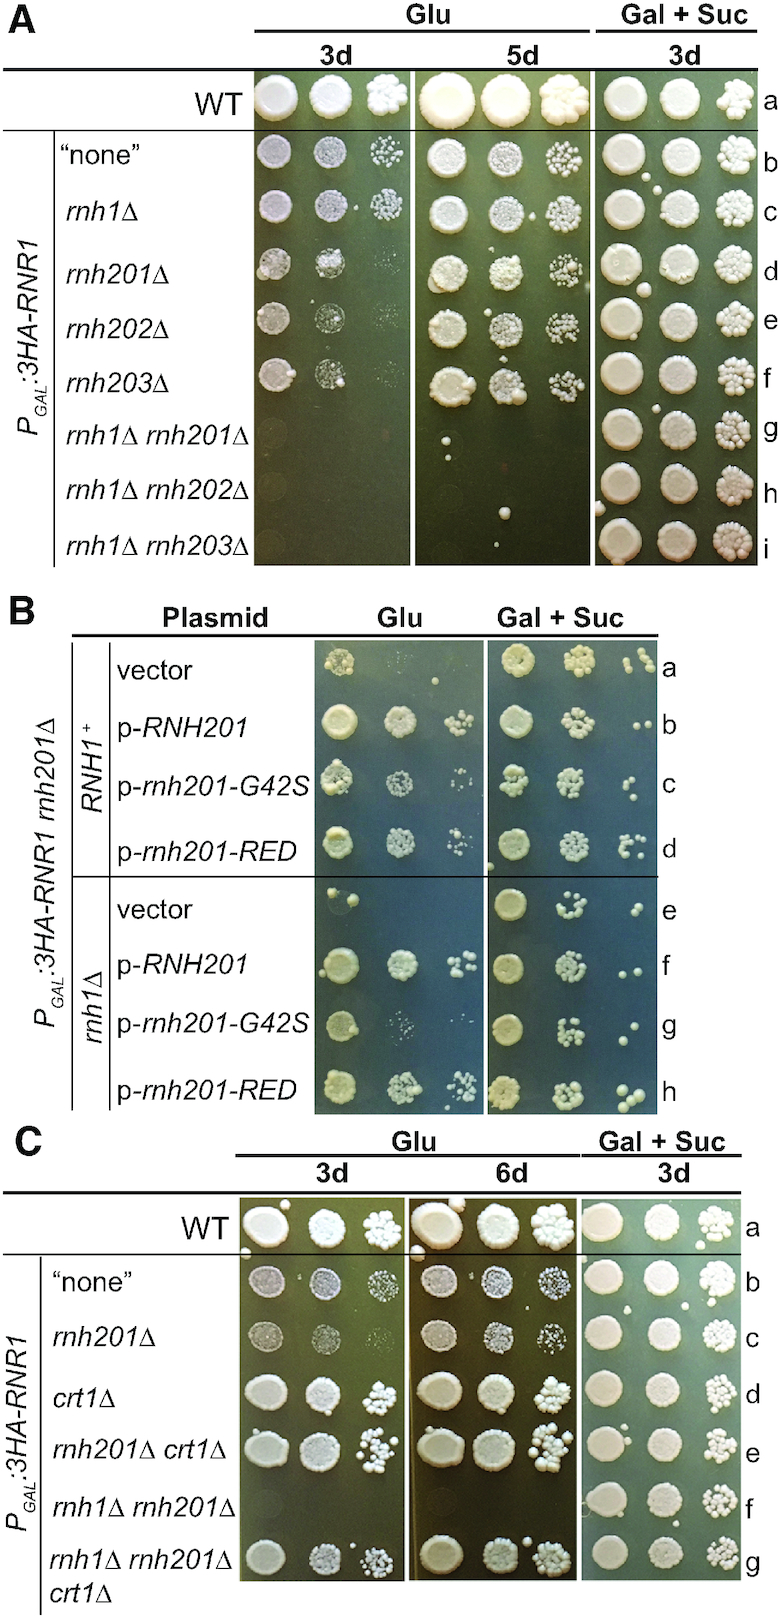
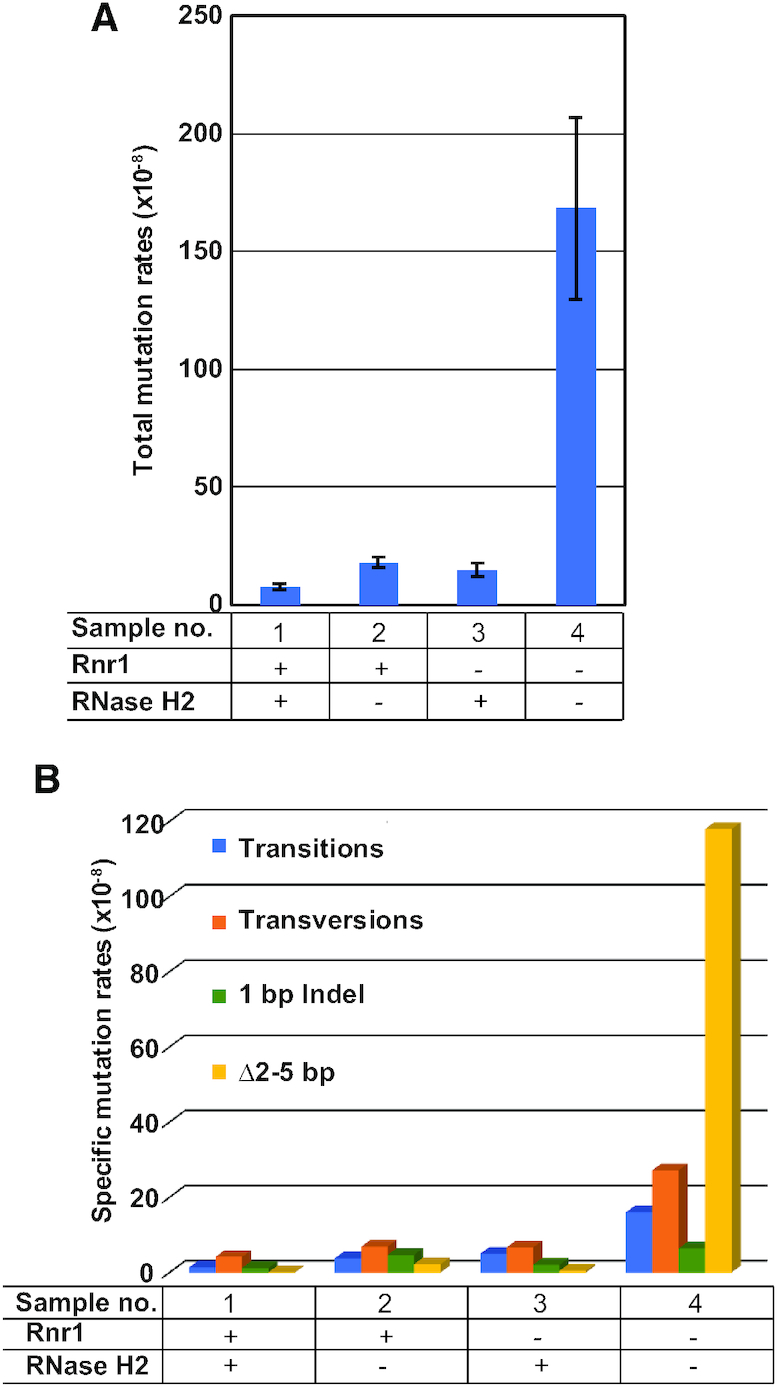
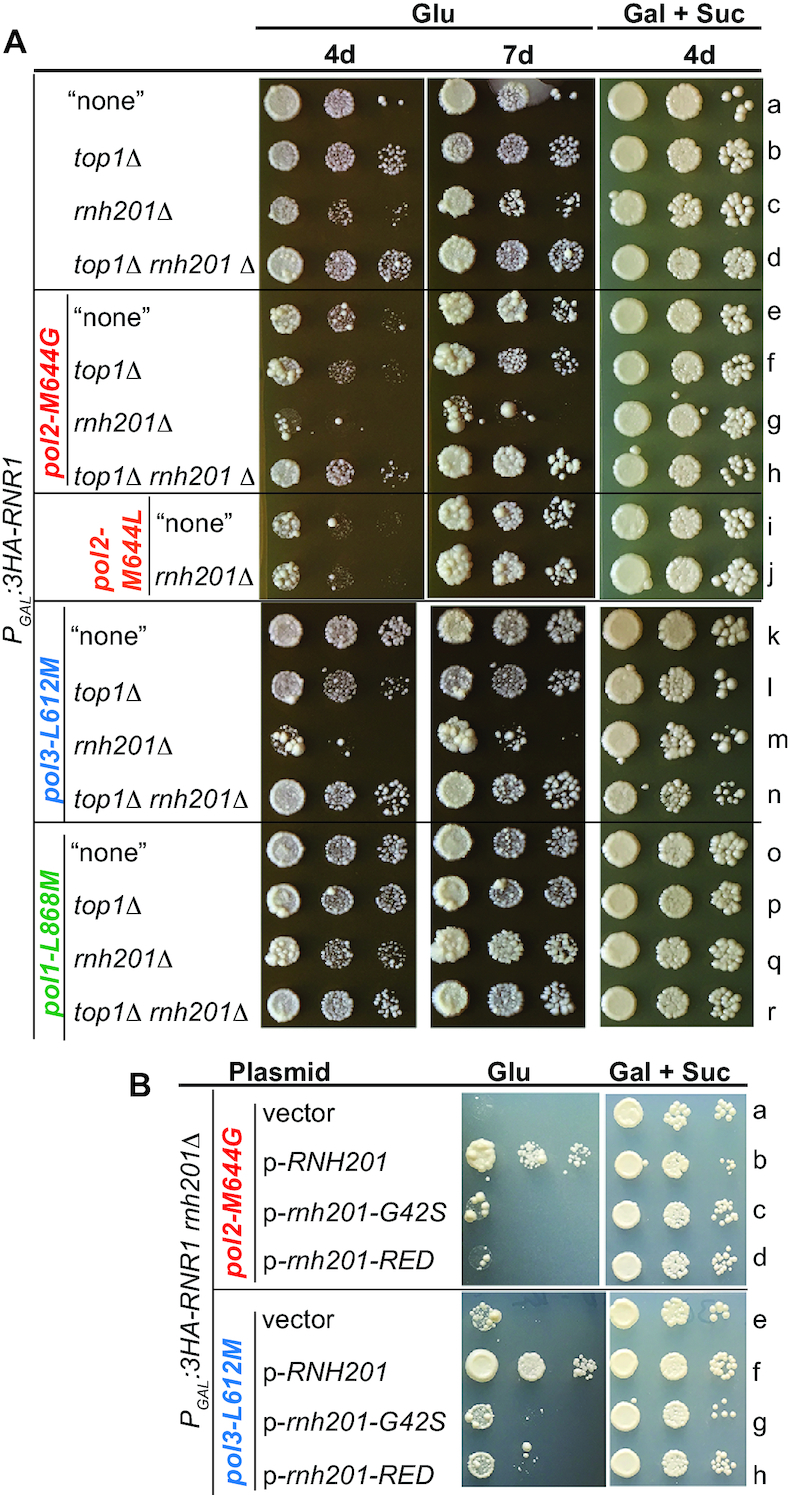
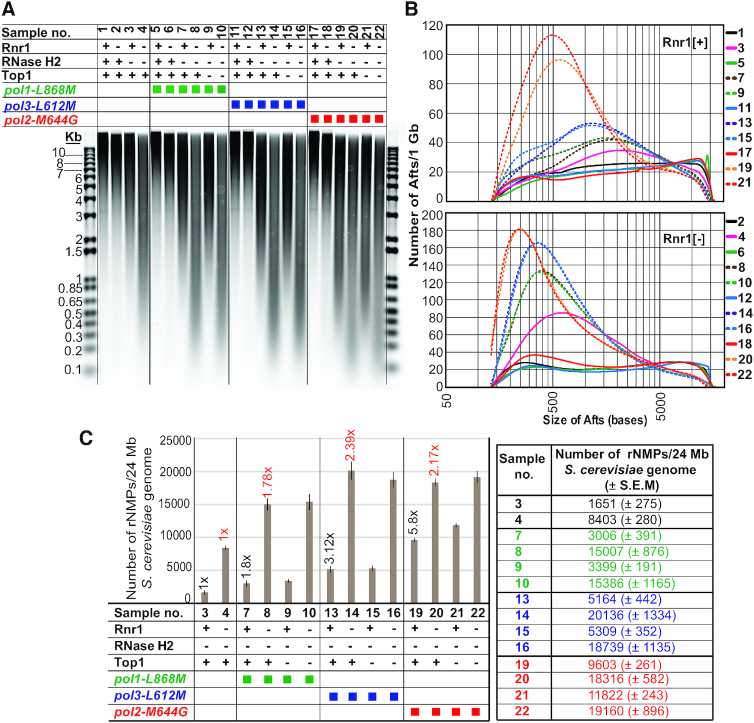
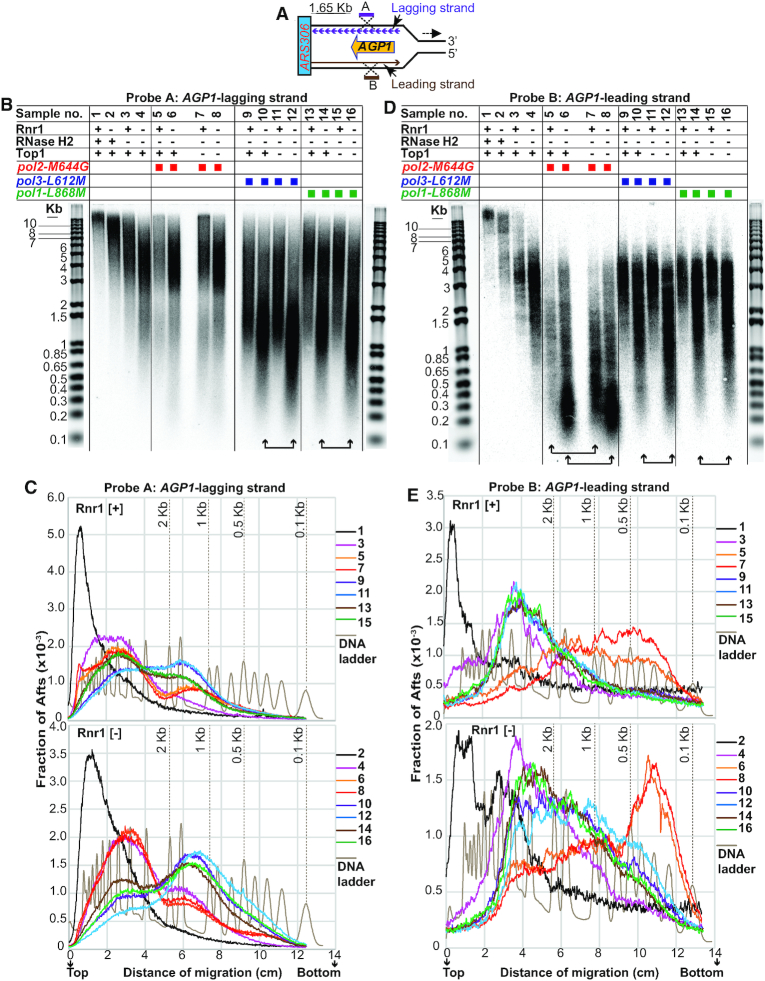
Cellular levels of ribonucleoside triphosphates (rNTPs) are much higher than those of deoxyribonucleoside triphosphates (dNTPs), thereby influencing the frequency of incorporation of ribonucleoside monophosphates (rNMPs) by DNA polymerases (Pol) into DNA. RNase H2-initiated ribonucleotide excision repair (RER) efficiently removes single rNMPs in genomic DNA. However, processing of rNMPs by Topoisomerase 1 (Top1) in absence of RER induces mutations and genome instability. Here, we greatly increased the abundance of genomic rNMPs in Saccharomyces cerevisiae by depleting Rnr1, the major subunit of ribonucleotide reductase, which converts ribonucleotides to deoxyribonucleotides. We found that in strains that are depleted of Rnr1, RER-deficient, and harbor an rNTP-permissive replicative Pol mutant, excessive accumulation of single genomic rNMPs severely compromised growth, but this was reversed in absence of Top1. Thus, under Rnr1 depletion, limited dNTP pools slow DNA synthesis by replicative Pols and provoke the incorporation of high levels of rNMPs in genomic DNA. If a threshold of single genomic rNMPs is exceeded in absence of RER and presence of limited dNTP pools, Top1-mediated genome instability leads to severe growth defects. Finally, we provide evidence showing that accumulation of RNA/DNA hybrids in absence of RNase H1 and RNase H2 leads to cell lethality under Rnr1 depletion.


Figures

Figure 1.
Figure 1.
Depletion of Rnr1 in BY4741 background mildly triggers the S-phase checkpoint, greatly reduces dNTP levels and significantly prolongs S-phase. (A) Cartoon depicting the gene RNR1 under the control of the inducible PGAL1/10 promoter. The promoter is induced in galactose plus sucrose (gal + suc) media and inhibited in glucose (glu) media. Rnr1 is epitope-tagged with 3x hemagglutinin (3HA) at its N-terminus. (B) Rnr3 protein is mildly expressed in single mutant PGAL:3HA-RNR1 depleted of Rnr1. Strains PGAL:3HA-RNR1 and PGAL:3HA-RNR1 crt1Δ were grown at 30°C in liquid minimal medium lacking histidine with 2% galactose and 2% sucrose. To trigger Rnr1 depletion, cells at OD600 ∼0.2 were transferred to liquid minimal medium lacking histidine with 2% glucose. Cells were harvested before transfer (0 h) and 2, 4 and 6 h after transfer to glucose-containing medium (see also Materials and Methods). Strain WT was grown in rich YEPD (2% glucose) medium at 30°C, in absence of drugs (i.e. unperturbed conditions), or for 3 h in presence of either 200 mM HU (labeled +HU) or 0.03% MMS (labeled +MMS) (see also Materials and Methods). Strain crt1Δ was grown in rich YEPD (2% glucose) medium at 30°C. Note that all cell samples were harvested in exponential phase. Total proteins were separated on a 4–20% SDS-polyacrylamide gel and then electro-blotted. The filter was stained with Ponceau Red (bottom sub-panel). The same filter was probed separately with antibodies against HA tag (3HA-Rnr1), Rnr3, PGK1 and Sml1. Relevant protein molecular weights (KDa) are indicated at the left-hand. For the ease of comparison, each well is allocated a unique Latin letter, which is repeated in each sub-panel. The length of Rnr1 depletion in hours (hr) is indicated above the wells a-d and e-h. One representative experiment is shown of at least three independent ones. (C) dNTP levels, particularly dGTPs, are greatly decreased in single mutant PGAL:3HA-RNR1 depleted of Rnr1. The WT strain was cultured in rich YEPD medium (2% glucose) at 30°C and harvested at OD600 ∼0.4. The single mutant PGAL:3HA-RNR1 was cultured as explained in (B) and harvested 6 h after transfer to glucose-containing media at OD600 ∼0.4. dNTP levels were normalized to rNTP levels and values were adjusted to the total number of cells used for the preparation. Error bars reflect S.E.M. of 2 independent repeats. Symbols on the organigram: + and – indicate that Rnr1 is present or absent, respectively. For the ease of comparison, WT strain and single mutant PGAL:3HA-RNR1 are also represented in Supplementary Figure S3A (see also Supplementary Table S4). (D) Rad53 is mildly phosphorylated in single mutant PGAL:3HA-RNR1 depleted of Rnr1. Strains and growth conditions are as in (B). Total proteins were separated on a 6.5% SDS-polyacrylamide gel. The Filter was probed with antibody against Rad53 (P-Rad53 represents the phosphorylated form of Rad53). For other details, see (B). (E) Cells depleted of Rnr1 accumulate significantly in S-phase in the presence of Crt1. Flow cytometry (FACS) histograms of cells from strains PGAL:3HA-RNR1 and PGAL:3HA-RNR1 crt1Δ, before (0 h), and 2, 4 and 6 h after transfer to glucose medium. One representative experiment is shown of at least three independent ones. Note that cell samples from the same cultures were used for FACS, western-blotting in (B) and (D), and RT-qPCR in Supplementary Figure S2. (F) Cells depleted of Rnr1 grow much slower than the WT strain, but their growth is fully restored in the absence of Crt1. Drop test growth assays of strain WT, strains deleted of the gene CRT1, SML1, or DUN1, and strains carrying PGAL:3HA-RNR1 without gene deletion (labeled “none"), or with deletion of the gene CRT1, SML1 or DUN1. Cells were pre-grown in YPGS (2% galactose and 1% sucrose) liquid medium overnight. Serial dilutions were plated on YEPD (2% glucose) and YPGS solid media. Plates were incubated at 25°C. Photographs were taken at the indicated number of days (d). For the ease of comparison, a unique Latin alphabet letter is allocated for each row. ‘Glu’ stands for glucose and ‘Gal + Suc’ stands for galactose plus sucrose. The horizontal line across the images is included for clarity. See Supplementary Table S1 for the list of strains. One representative experiment is shown of at least three independent ones.
Figure 2.
Figure 2.
The lethality of Rnr1-depleted triple mutants lacking RNases H1 and H2 is suppressed by the variant Rnh201-RED. (A) Depletion of Rnr1 in mutants lacking RNase H1, RNase H2 or both enzymes has different effects on their growth. Drop test growth assays of strain WT, and strains carrying PGAL:3HA-RNR1 without gene deletion (labeled “none"), or with deletion of the gene RNH1, RNH201, RNH202, or RNH203, or both genes RNH1 and RNH201, or RNH1 and RNH202, or RNH1 and RNH203. Cells were grown in YPGS (2% galactose and 1% sucrose) liquid medium overnight at 30°C. Serial dilutions were plated on YEPD (2% glucose) and YPGS solid media. Plates were incubated at 30°C. Photographs were taken at the indicated number of days (d). ‘Glu’ stands for glucose. ‘Gal + Suc’ stands for galactose plus sucrose. The horizontal line across the images is included for clarity. See Supplementary Table S1 for the list of strains. For the ease of comparison, a unique Latin alphabet letter is allocated for each row. One representative experiment is shown of at least three independent ones. (B) The variant Rnh201-G42S suppresses less well the growth defects of Rnr1-depleted triple mutants lacking RNases H1 and H2 than the variant Rnh201-RED. Drop test growth assays of strains PGAL:3HA-RNR1 rnh201Δ and PGAL:3HA-RNR1 rnh201Δ rnh1Δ that have an empty vector, or a plasmid expressing WT Rnh201, variant Rnh201-G42S, or variant Rnh201-RED. Cells were grown overnight in liquid minimal medium lacking leucine with 2% galactose and 1% sucrose at 30°C. Serial dilutions were plated on solid minimal medium lacking leucine with either 2% glucose, or 2% galactose and 1% sucrose. Photographs were taken after 7 days of incubation at 30°C. For other details, see (A). (C) Cells depleted of Rnr1 and lacking RNases H1 and H2 grow like the WT strain in absence of Crt1. Drop test growth assays of strain WT, and strains carrying PGAL:3HA-RNR1 without gene deletion (labeled “none"), or with deletion of the gene RNH201 or CRT1, or both genes RNH201 and CRT1, or RNH1 and RNH201, or the three genes RNH1, RNH201 and CRT1. For other details, see (A).
Figure 3.
Figure 3.
Total and Δ2–5 bp mutation rates of CAN1 are highly increased in RER-deficient Rnr1-depleted double mutant. (A) Total mutation rate is highly increased in cells lacking RNase H2 and depleted of Rnr1. WT strain (sample 1), single mutant rnh201Δ (sample 2), single mutant PGAL:3HA-RNR1 (sample 3), and double mutant PGAL:3HA-RNR1 rnh201Δ (sample 4), were grown in rich YEPD (2% glucose) solid medium. In these growth conditions, Rnr1 should be expressed at WT levels in samples 1 and 2, and Rnr1 should be depleted in samples 3 and 4. Total mutation rates are plotted on the Y-axis. The graph represents the average and S.E.M. of 4 independent experiments. See also Supplementary Table S3. Symbols on the organigram below the plot: + and – indicate that the protein is present or absent, respectively. (B) Δ2–5 bp specific mutation rate is highly increased in cells lacking RNase H2 and depleted of Rnr1. Specific mutation rates of CAN1 (mutation-spectra) for the same strains and growth conditions as in (A). Specific mutation rates are plotted on the Y-axis. The different types of mutations are color-coded. ‘1 bp Indel’ stands for 1 base pair insertion/deletion. ‘Δ2–5 bp’ stands for 2–5 base pairs deletion. See also Supplementary Table S3. For other details see (A).
Figure 4.
Figure 4.
RER-deficient Rnr1-depleted triple mutants bearing Pol ϵ-M644G or δ-L612M, but not α-L868M, show Top1-dependent severe growth defects. (A) RER-deficient mutants depleted of Rnr1 and bearing Pol ϵ-M644G or δ-L612M show severe growth defects, but these defects are suppressed in absence of Top1. Drop test growth assays of strains carrying PGAL:3HA-RNR1 without gene deletion (labeled “none"), or with deletion of the gene TOP1 or RNH201, or both genes TOP1 and RNH201, and strains carrying both PGAL:3HA-RNR1 and allele pol2-M644G, pol3-L612M, or pol1-L868M, without gene deletion (labeled “none"), or with deletion of the gene TOP1 or RNH201, or both genes TOP1 and RNH201, and strains carrying both PGAL:3HA-RNR1 and allele pol2-M644L, without gene deletion (labeled “none"), or with deletion of the gene RNH201. Cells were grown in YPGS (2% galactose and 1% sucrose) liquid medium overnight at 30°C. Serial dilutions were plated on YEPD (2% glucose) and YPGS solid media. Plates were incubated at 30°C. Photographs were taken at the indicated number of days (d). The images for each incubation time are from the same plate. The horizontal lines across the images are included for clarity. ‘Glu’ stands for glucose. ‘Gal + Suc’ stands for galactose plus sucrose. For the ease of comparison, a unique Latin alphabet letter is allocated for each row. See Supplementary Table S1 for the list of strains. One representative experiment is shown of at least three independent ones. (B) The variant Rnh201-RED does not suppress the severe growth defects of RER-deficient mutants depleted of Rnr1 and bearing Pol ϵ-M644G or δ-L612M. Drop test growth assays of strains PGAL:3HA-RNR1 pol2-M644G rnh201Δ and PGAL:3HA-RNR1 pol3-L612M rnh201Δ that have the same plasmids as in Figure 2B. Cells were grown overnight in liquid minimal medium lacking leucine with 2% galactose and 1% sucrose at 30°C. Serial-dilutions were plated on solid minimal medium lacking leucine with 2% glucose, or with 2% galactose and 1% sucrose. Photographs were taken after incubation for 7 days at 30°C. The images for each growth condition are from the same plate. The horizontal line across the images is included for clarity. For other details, see (A).
Figure 5.
Figure 5.
Determination of the numbers of genomic rNMPs by alkali-fragmentation of ribonucleotide-containing total DNA. (A) Resolution by gel electrophoresis of alkali-fragments from total DNA (Afts). The following strains (see Supplementary Table S1 for the list of strains) are represented by symbols on the organigram. Rnr1 [+] condition (Rnr1 indicated by ‘+’ on organigram): 1. WT. 3. rnh201Δ. 5. pol1-L868M. 7. pol1-L868M rnh201Δ. 9. pol1-L868M rnh201Δtop1Δ. 11. pol3-L621M. 13. pol3-L621M rnh201Δ. 15. pol3-L621M rnh201Δtop1Δ. 17. pol2-M644G. 19. pol2-M644G rnh201Δ. 21. pol2-M644G rnh201Δtop1Δ. Rnr1 [−] condition (Rnr1 indicated by ‘−’ on organigram): 2. PGAL:3HA-RNR1. 4. PGAL:3HA-RNR1 rnh201Δ. 6. PGAL:3HA-RNR1 pol1-L868M. 8. PGAL:3HA-RNR1 pol1-L868M rnh201Δ. 10. PGAL:3HA-RNR1 pol1-L868M rnh201Δ top1Δ. 12. PGAL:3HA-RNR1 pol3-L621M. 14. PGAL:3HA-RNR1 pol3-L621M rnh201Δ. 16. PGAL:3HA-RNR1 pol3-L621M rnh201Δtop1Δ. 18. PGAL:3HA-RNR1 pol2-M644G. 20. PGAL:3HA-RNR1 pol2-M644G rnh201Δ. 22. PGAL:3HA-RNR1 pol2-M644G rnh201Δ top1Δ. For Rnr1 [+] condition (Rnr1 expression at WT levels), strains carrying the gene RNR1 under the control of its native promoter were cultured in rich YEPD (2% glucose) medium at 30°C and harvested in exponential phase at OD600 ∼0.5–0.6. For Rnr1 [−] condition (Rnr1 depletion), strains carrying PGAL:3HA-RNR1 were cultured at 30°C in liquid minimal medium lacking histidine with 2% galactose and 2% sucrose. Cells at OD600 ∼0.2 were transferred to liquid minimal medium lacking histidine with 2% glucose, maintained in exponential phase, and harvested 6 h after transfer to glucose-containing medium (see also Material and Methods). Alkali-treated DNA samples (∼2 μg per lane) together with the DNA ladder (in duplicate) were resolved on an alkaline 1% agarose gel. The gel was neutralized and stained with SYBR gold (see also Materials and Methods). Selected molecular weights of the left-hand DNA ladder are labeled in kb. The vertical lines along the image of the gel are included for clarity. Symbols on the organigram: + and – indicate that the protein is present or absent, respectively; green, blue and red squares depict the alleles pol1-L868M, pol3-L612M and pol2-M644G, respectively. (B) Distribution of Afts sizes. Densitometry of SYBR-stain signal from samples in (A) was measured at 0.01 mm intervals and the values were normalized to the length of the DNA fragment (for mathematical modeling of the data see the section ‘Quantitation of genomic ribonucleotides’ in Materials and Methods). The number of Afts of a given size per 1Gb of total DNA is plotted on the Y-axis. Sizes of Afts in bases are plotted on the X-axis. 50, 500 and 5000 bases are indicated on the X-axis of the lower-plot. Units on the Y-axis (per 1 Gb) were chosen arbitrarily. Because the yeast haploid genome size is 24 Mb, the expected number of Afts of a given size in a single yeast genome is approximately 1/42 of the numbers shown on the Y-axis. Note also the logarithmic scale of the X-axis. For the ease of comparison, histograms for conditions Rnr1 [+] and Rnr1 [−] are represented separately in the upper- and lower-plots, respectively. See also Supplementary Figure S4 for averaged data from 4 independent repeats with S.E.M. (C) Numbers of total genomic rNMPs. Total genomic rNMPs present in the 24 Mb haploid yeast genome of selected samples from (A) are plotted on the Y-axis. Shown are averaged data for four independent repeats with S.E.M. For the ease of comparison, averaged data of total genomic rNMPs are also indicated on the small table to the right-hand of the bar plot. The fold differences of samples 7, 13 and 19 relative to sample 3 are indicated above the bars on the plot by black numbers, and the fold differences of samples 8, 14 and 20 relative to sample 4 are indicated above the bars on the plot by red numbers (for P-values, see Supplementary Table S5). Symbols on the organigram (below the bar plot) are as described in (A). For the calculation of the total numbers of DNA breaks by mathematical modeling, see section ‘Quantitation of genomic ribonucleotides’ in Material and Methods (numbers of DNA breaks from four independent experiments are represented in Supplementary Table S5). For the calculations of total numbers of genomic rNMPs (see Supplementary Table S5), in order to account for DNA breaks that may occur during alkaline heat-treatment independently of incorporated ribonucleotides, the number of DNA breaks in the WT strain (sample 1, not represented on the plot and small table) was subtracted from every other Rnr1 [+] strain (samples 3, 7, 9, 13, 15, 19 and 21), and the number of DNA breaks in the single mutant PGAL:3HA-RNR1 depleted of Rnr1 (sample 2, not represented on the plot and small table) was subtracted from every other Rnr1 [−] strain (samples 4, 8, 10, 14, 16, 20 and 22).
Figure 6.
Figure 6.
Southern analyses showing that Top1 cleaves genomic ribonucleotides in Rnr1-depleted RER-deficient triple mutants bearing Pol ϵ-M644G, δ-L612M or α-L868M. (A) Scheme depicting the RF encompassing the locus AGP1, which is located at ∼1.65 Kb distance from the right side of the bidirectional origin ARS306 on chromosome III (the direction of replication, left to right, is indicated by a black horizontal arrow). For clarity, the RF to the left side of ARS306 is omitted. OFs in the nascent lagging strand, which are synthesized by Pols α and δ, are depicted by small purple arrows. The nascent leading strand, which is mainly synthesized by Pol ϵ, is depicted by a long brown arrow. Template lagging and leading strands are depicted by black lines. Single-stranded probes A and B (length ∼660 nt) hybridize to AGP1-lagging strand DNA (bottom strand) and AGP1-leading strand DNA (top strand), respectively, at ∼2 Kb distance from the right side of ARS306 (for primer sequences see Supplementary Table S2). (B–E) The following strains (see Supplementary Table S1 for the list of strains) are represented by symbols on the organigrams in (B) and (D). Rnr1 [+] condition: 1. WT; 3. rnh201Δ; 5. pol2-M644G rnh201Δ; 7. pol2-M644G rnh201Δ top1Δ; 9. pol3-L621M rnh201Δ; 11. pol3-L621M rnh201Δtop1Δ; 13. pol1-L868M rnh201Δ; 15. pol1-L868M rnh201Δ top1Δ. Rnr1 [−] condition: 2. PGAL:3HA-RNR1; 4. PGAL:3HA-RNR1 rnh201Δ; 6. PGAL:3HA-RNR1 pol2-M644G rnh201Δ; 8. PGAL:3HA-RNR1 pol2-M644G rnh201Δtop1Δ; 10. PGAL:3HA-RNR1 pol3-L621M rnh201Δ; 12. PGAL:3HA-RNR1 pol3-L621M rnh201Δ top1Δ; 14. PGAL:3HA-RNR1 pol1-L868M rnh201Δ; 16. PGAL:3HA-RNR1 pol1-L868M rnh201Δ top1Δ. For the description of Rnr1 [+] and Rnr1 [−] conditions and symbols on the organigrams see legend of Figure 5A. Alkali-treated DNA samples were separated on two alkaline 1% agarose gels (5 μg DNA per lane and per gel). The gels were neutralized, stained with SYBR gold (see pictures in Supplementary Figure S7) and capillary-blotted. Each membrane was hybridized with one radiolabeled probe (see also Material and Methods). Represented is an example of two independent repeats. (B) Blot showing Southern hybridization of AGP1-lagging strand DNA with probe A. For the ease of comparison, SYBR-stained DNA ladders from the picture of the gel represented in Supplementary Figure S7A were superimposed on the image of the blot. Selected molecular weights are labeled in kb on the left-hand ladder. Double-arrowed horizontal bars on the bottom of the blot point towards prominent differences between Top1+ and Top1– strains. The vertical lines along the image of the blot are included for clarity. (C) Signal densitometry histograms of samples in (B). Densitometry of radioactive signal was measured at 0.01 mm intervals and the background subtracted within each lane. To account for differences in loading between DNA samples, the densitometry of each interval was normalized to the sum of densitometries of all intervals within each lane. Normalized values are plotted on the Y-axis as a fraction of Afts. Distances of migration of Afts on the gel are plotted on the X-axis. For the ease of comparison, histograms for Rnr1 [+] and Rnr1 [−] conditions are represented separately in the upper- and lower-plot, respectively. The densitometry histogram of the DNA ladder is superimposed on each plot. Selected DNA molecular weights are labeled in Kb. The distance (in cm) and direction (top to bottom) of migration of Afts are indicated below the X-axis of the lower-plot. (D) Blot showing Southern hybridization of AGP1-leading strand DNA with probe B. SYBR-stained DNA ladders from the picture of the gel in Supplementary Figure S7B were superimposed on the image of the blot. For other details, see (B). (E) Signal densitometry histograms of samples in (D). For other details, see (C).

Similar articles

Cited by

References

    1. Burgers P.M.J., Kunkel T.A.. Eukaryotic DNA replication fork. Annu. Rev. Biochem. 2017; 86:417–438. - PMC - PubMed
    1. Stodola J.L., Burgers P.M.. Mechanism of lagging-strand DNA replication in eukaryotes. Adv. Exp. Med. Biol. 2017; 1042:117–133. - PubMed
    1. Aria V., Yeeles J.T.P.. Mechanism of bidirectional leading-strand synthesis establishment at eukaryotic DNA replication origins. Mol. Cell. 2018; 73:199–211. - PMC - PubMed
    1. Daigaku Y., Keszthelyi A., Muller C.A., Miyabe I., Brooks T., Retkute R., Hubank M., Nieduszyski C.A., Carr A.M.. A global profile of replicative polymerase usage. Nat. Struct. Mol. Biol. 2015; 22:192–198. - PMC - PubMed
    1. Garbacz M.A., Lujan S.A., Burkholder A.B., Cox P.B., Wu Q., Zhou Z.X., Haber J.E., Kunkel T.A.. Evidence that DNA polymerase delta contributes to initiating leading strand DNA replication in Saccharomyces cerevisiae. Nat. Commun. 2018; 9:858. - PMC - PubMed

Publication types

MeSH terms