. 2020 May 7;48(8):4081-4099.
doi: 10.1093/nar/gkaa161.

Epigenetic engineering of yeast reveals dynamic molecular adaptation to methylation stress and genetic modulators of specific DNMT3 family members

Affiliations

Epigenetic engineering of yeast reveals dynamic molecular adaptation to methylation stress and genetic modulators of specific DNMT3 family members

Alex I Finnegan et al. Nucleic Acids Res. .

Abstract

Cytosine methylation is a ubiquitous modification in mammalian DNA generated and maintained by several DNA methyltransferases (DNMTs) with partially overlapping functions and genomic targets. To systematically dissect the factors specifying each DNMT's activity, we engineered combinatorial knock-in of human DNMT genes in Komagataella phaffii, a yeast species lacking endogenous DNA methylation. Time-course expression measurements captured dynamic network-level adaptation of cells to DNMT3B1-induced DNA methylation stress and showed that coordinately modulating the availability of S-adenosyl methionine (SAM), the essential metabolite for DNMT-catalyzed methylation, is an evolutionarily conserved epigenetic stress response, also implicated in several human diseases. Convolutional neural networks trained on genome-wide CpG-methylation data learned distinct sequence preferences of DNMT3 family members. A simulated annealing interpretation method resolved these preferences into individual flanking nucleotides and periodic poly(A) tracts that rotationally position highly methylated cytosines relative to phased nucleosomes. Furthermore, the nucleosome repeat length defined the spatial unit of methylation spreading. Gene methylation patterns were similar to those in mammals, and hypo- and hypermethylation were predictive of increased and decreased transcription relative to control, respectively, in the absence of mammalian readers of DNA methylation. Introducing controlled epigenetic perturbations in yeast thus enabled characterization of fundamental genomic features directing specific DNMT3 proteins.


Figures

Figure 1.
Figure 1.
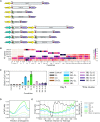
Combinatorial knock-in of DNMT genes methylates the K. phaffii genome. (A) Schematic representation of expression cassettes for knock-in of DNMT genes. (B) Expression levels (FPKM) of knocked-in genes in each experiment scaled by maximum knock-in expression in each row. White cells in the matrix indicate that a particular DNMT isoform was excluded from alignment to prevent multi-mapping (Materials and Methods). (C) Genome-wide 5mC fraction in CpG context averaged over two replicates. Error bars show results for the minimum and maximum replicate. (D) Metagene plot of mCpG rates averaged across K. phaffii genes. CpG-context cytosines were assigned to a metagene coordinate, with the distance downstream of the TSS scaled by gene length. Solid lines indicate average mCpG rate of cytosines in sliding metagene coordinate windows. Shading indicates 95% Bayesian credible interval (Materials and Methods). (E) Profiles of mCpG rates and nucleosome occupancy aligned at TSS and averaged across K. phaffii genes. Lines and shaded credible intervals were calculated using a sliding window method similar to (D).
Figure 2.
Figure 2.
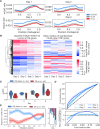
DNMT expression causes broad transcriptional changes including differential expression patterns that reduce SAM availability in the 3B1-3L condition. (A) Principal component analysis of transcriptome-wide mRNA levels. Open circles and arrows, labelled d1 through d4, indicate the mean of triplicates for each time-course day. (B) Numbers of genes differentially expressed in time course compared to control. Node labels and size indicate the number of differentially expressed genes on each day after DNMT induction. Edge labels and color indicate the number of genes transitioning between differential expression states. (C) Time-course differential expression status of methionine cycle genes relative to control. (D) Log2 fold-change of methionine cycle genes and SAM-consuming genes in the 3B1-3L condition relative to control. SAM-consuming genes were defined as the union of genes belonging to co-clustered GO terms related to SAM function and the set of spermine synthesis genes SPE3, SEP4, MEU1. Error bars show standard deviation over a total of 59 genes. (E) Time-course differential expression status of methionine cycle, spermine synthesis and related genes.
Figure 3.
Figure 3.
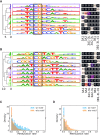
Changes in expression are inversely related to gene methylation by DNMT3B1-3L throughout time course. (A) Metagene plot of mCpG rates averaged across ‘DE down,’ ‘no DE’ and ‘DE up’ genes on each day. (B) Clustering of differentially expressed genes by log2 fold-change in expression relative to control (left panel) and heat map of average gene mCpG rate in metagene interval [–0.2, 0.4] (right panel). The right panel heat map is organized by expression-based clustering, shows medians over blocks of 100 genes and is standardized on each day. (C) Distribution of auROC across 10 CV folds for classification of test data belonging to each time-course day. (D) ROC for classification of test set data in ‘DE down versus rest’ task (top) and log ratio of distributions of minimum false positive rates for correct classification of PER and non-PER ‘DE down’ genes (bottom). Solid lines in ROC indicate mean true positive rate for given false positive rate taken across CV folds; shading indicates 95% confidence interval. (E) Regression coefficients for logistic regression classifiers. Solid lines and bar heights indicate parameters learned from all time-course data. Shading indicates 95% confidence interval estimated by bootstrap resampling of time-course data (see also Supplementary Figure S16).
Figure 4.
Figure 4.
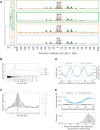
Performance of deep convolutional neural networks (CNN) for predicting DNA methylation. (A) Metagene plot of predicted and observed CpG methylation averaged across K. phaffii genes. Shading indicates 95% Bayesian credible interval for observed mCpG rates and 95% confidence interval for prediction. (B) Fraction of informative sequences in the test set. An informative sequence is defined as a sequence whose loss is in the top 10% of the distribution of losses for inputs obtained by sequence permutation. Dotted line shows expected percentage when sequence is not useful for prediction. (C) Clustering of conditions based on prediction-based dissimilarity (PBD) (Materials and Methods).
Figure 5.
Figure 5.
Local nucleotide patterns preferred or avoided by DNMTs. (A) Motif logos representing distinct patterns of nucleotide preferences identified in 300 iterations of SA interpretation. The table on the right shows composition of each motif cluster in terms of SA knock-in conditions. (B) Similar to (A), but for motif logos representing disfavored nucleotides. (C) Distributions of mCpG rates at CpG cytosines contained versus not contained in motifs preferred by 3A1-3L. (D) Distributions of mCpG rates at CpG cytosines contained versus not contained in motifs avoided by 3A1-3L.
Figure 6.
Figure 6.
Global sequence features preferred by DNMT3A suggest a rotational positioning of CpG with respect to local chromatin structure. (A) Global sequence preferences of 3A1-3L learned by the CNN. (B) Average amplitude of discrete fast Fourier transform (DFFT) applied to 3-mer counts in individual sequences sampled by SA for the 3A1-3L condition. The top five 3-mers with highest amplitude at 10.5 bp are shown individually and amplitudes of the remaining 3-mers are summarized by their mean and standard deviation (Materials and Methods). (C) Periodic poly(A) pattern is in phase between the 5′ and 3′ region of CpG. Curves show the Fourier amplitude for count data obtained by shifting the AAA counts 3′ of central CpG by the indicated amount of bases. (D) Dyad-aligned nucleosome occupancy and corresponding mCpG rate of 3A1-3L. Shading indicates 95% confidence interval. (E) (Top) Mutual information (MI) of methylation status at two distinct CpG sites as a function of their separation distance, normalized by entropy. MI was estimated from the empirical joint distribution of methylation status at CpG pairs separated by a genomic distance within each indicated horizontal 30 bp window. Simulated negative control is based on independent sampling of binary methylation status from the site-specific mCpG rates. (Bottom) Distribution of distance between adjacent nucleosome dyads flanking a highly methylated CpG.

References

    1. Costello J.F. DNA methylation in brain development and gliomagenesis. Front. Biosci. 2003; 8:s175–s184. - PubMed
    1. Doi A., Park I.H., Wen B., Murakami P., Aryee M.J., Irizarry R., Herb B., Ladd-Acosta C., Rho J., Loewer S. et al. .. Differential methylation of tissue- and cancer-specific CpG island shores distinguishes human induced pluripotent stem cells, embryonic stem cells and fibroblasts. Nat. Genet. 2009; 41:1350–1353. - PMC - PubMed
    1. Meissner A., Mikkelsen T.S., Gu H., Wernig M., Hanna J., Sivachenko A., Zhang X., Bernstein B.E., Nusbaum C., Jaffe D.B. et al. .. Genome-scale DNA methylation maps of pluripotent and differentiated cells. Nature. 2008; 454:766–770. - PMC - PubMed
    1. Lister R., Pelizzola M., Dowen R.H., Hawkins R.D., Hon G., Tonti-Filippini J., Nery J.R., Lee L., Ye Z., Ngo Q.M. et al. .. Human DNA methylomes at base resolution show widespread epigenomic differences. Nature. 2009; 462:315–322. - PMC - PubMed
    1. Maunakea A.K., Nagarajan R.P., Bilenky M., Ballinger T.J., D'Souza C., Fouse S.D., Johnson B.E., Hong C., Nielsen C., Zhao Y. et al. .. Conserved role of intragenic DNA methylation in regulating alternative promoters. Nature. 2010; 466:253–257. - PMC - PubMed

Publication types

MeSH terms