. 2020 Mar 17;52(3):513-527.e8.
doi: 10.1016/j.immuni.2020.02.006.

Diapedesis-Induced Integrin Signaling via LFA-1 Facilitates Tissue Immunity by Inducing Intrinsic Complement C3 Expression in Immune Cells

Affiliations

Diapedesis-Induced Integrin Signaling via LFA-1 Facilitates Tissue Immunity by Inducing Intrinsic Complement C3 Expression in Immune Cells

Martin Kolev et al. Immunity. .

Abstract

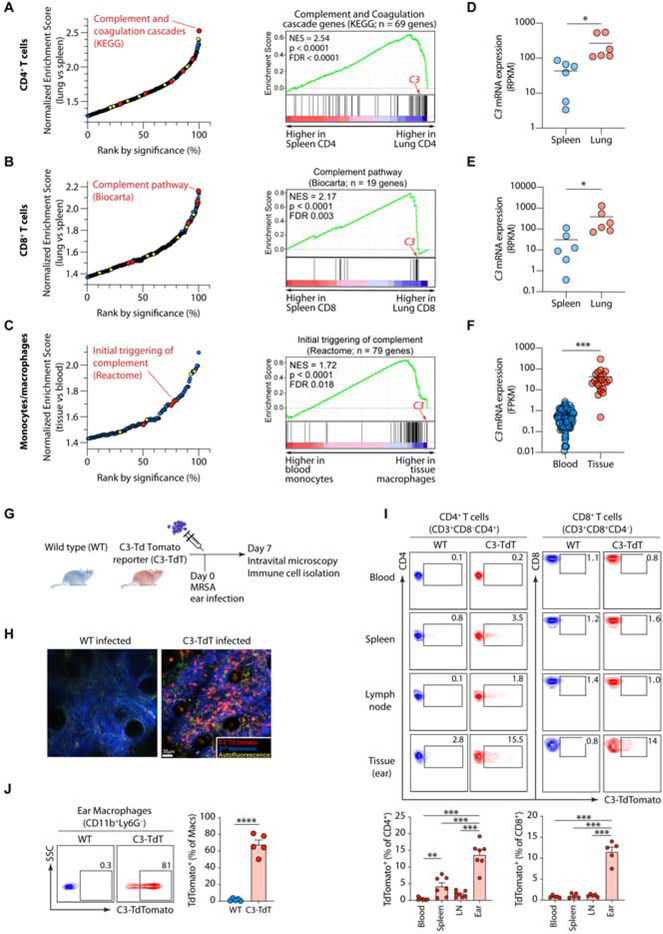
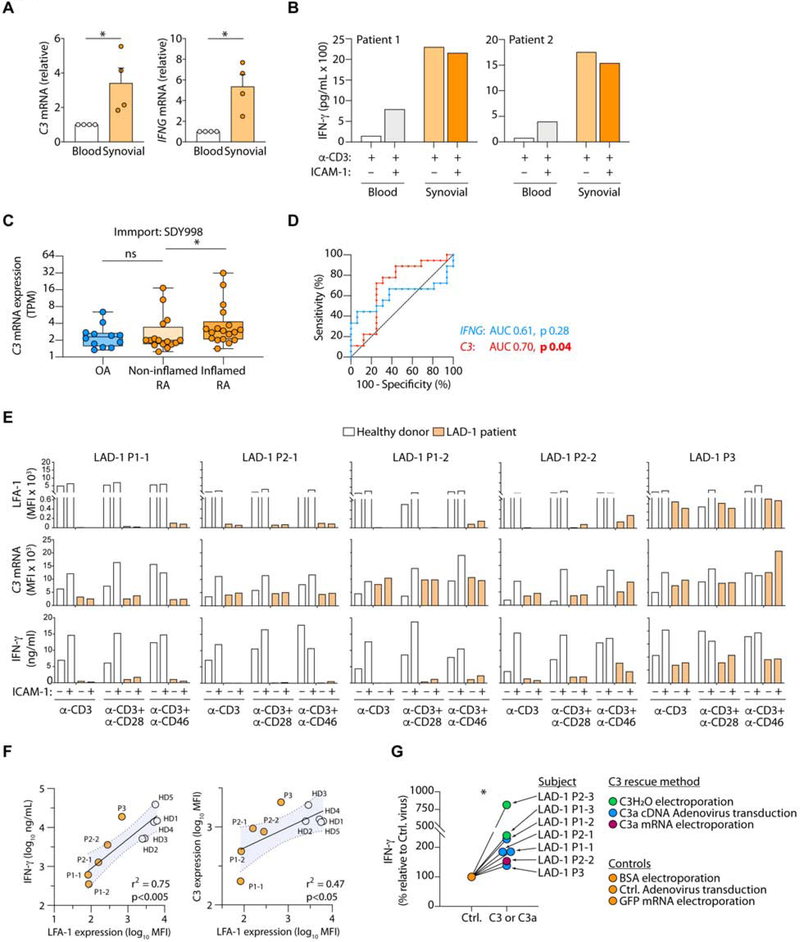
Intrinsic complement C3 activity is integral to human T helper type 1 (Th1) and cytotoxic T cell responses. Increased or decreased intracellular C3 results in autoimmunity and infections, respectively. The mechanisms regulating intracellular C3 expression remain undefined. We identified complement, including C3, as among the most significantly enriched biological pathway in tissue-occupying cells. We generated C3-reporter mice and confirmed that C3 expression was a defining feature of tissue-immune cells, including T cells and monocytes, occurred during transendothelial diapedesis, and depended on integrin lymphocyte-function-associated antigen 1 (LFA-1) signals. Immune cells from patients with leukocyte adhesion deficiency type 1 (LAD-1) had reduced C3 transcripts and diminished effector activities, which could be rescued proportionally by intracellular C3 provision. Conversely, increased C3 expression by T cells from arthritis patients correlated with disease severity. Our study defines integrins as key controllers of intracellular complement, demonstrates that perturbations in the LFA-1-C3-axis contribute to primary immunodeficiency, and identifies intracellular C3 as biomarker of severity in autoimmunity.

Keywords: LAD-1; LFA-1; T cells; Th1 cells; autoimmunity; biomarker; complosome; integrins; intracellular complement; lymphocyte adhesion deficiency type 1; metabolism.


Conflict of interest statement

Declaration of Interests The authors declare no competing interests.

Figures

Figure 1:
Figure 1:. Complement C3 gene transcription is a feature of immune cells in tissues.
(A-C) Significantly enriched canonical pathways by GSEA comparing transcriptomes of human CD4+ (A) and CD8+ T cells (B) isolated from lung versus spleen (data from GSE94964) and monocytes and macrophages (C) isolated from tissues versus blood (data from GSE117970). Left, pathways ranked by significance (false-discovery rate q-values), with complement pathways highlighted in red and integrin pathways in yellow. Right, GSEA plots for the top complement pathways in A-C, respectively. (D-F) Expression of C3 mRNA in CD4+ (D) and CD8+ (E) T cells isolated from lung versus spleen (data from GSE94964) and monocytes and macrophages (F) isolated from tissues versus blood (data from GSE117970). (G) Schematic depicting the methicillin-resistant Staphylococcus aureus (MRSA) ear infection model. Wild type (WT) or C3-Td Tomato reporter mice (C3-TdT) were infected in the ear followed by intravital microscopy and blood and organ harvest at day 7 post-infection. (H) Still capture of an intravital imaging movie (see Movie S1) of an MRSA-infected ear section of a WT (left) and C3-TdT reporter mouse (right) at day 7 post-infection. Bar, 30 μm. (I) Representative FACS analysis (top) and cumulative data (below) showing Td Tomato reporter activity in CD4+ (n=7) and CD8+ (n=5) T cells of WT and C3-TdT mice from different tissues at day 7. (J) Representative FACS analysis (left) and cumulative data (right) showing Td Tomato reporter activity in tissue macrophages of WT and C3-TdT mice from the site of infection at day 7 (n=5). I-J show cumulative data from 3–5 experiments. Bars show mean + SEM. * p<0.05, ** p <0.01, ***p < 0.001, ****p < 0.0001. See also Figure S1 and Table S1.
Figure 2:
Figure 2:. ICAM-1 is a key driver of C3 gene transcription in CD4+ T cells.
(A) Schematic depicting the integrins and selectins (with respective binding partners in parentheses) involved in rolling, adhesion and transmigration assessed for C3-dependent Th1 induction. (B) Reporter activity of splenic CD4+ T cells from the C3-Td tomato reporter mouse activated with antibodies to CD3 or CD3+CD28 with or without increasing concentrations of immobilized ICAM-1 for seven days and C3-Td Tomato signal measured by flow cytometry. Shown are cumulative data from n=5 independent experiments. (C) C3 mRNA (above) and protein (below) expression over time in healthy donor naive and memory CD4+ T cells cultured in the presence or absence of ICAM-1 alone. Cumulative data (mean ± SEM; n=3 independent experiments); both the C3 mRNA and protein expression curves are higher for both memory and naive cells with ICAM-1 compared to without ICAM-1 (p<0.001 for mRNA expression in both cell types; p<0.0001 for C3 protein in naive T cells and p<0.01 for C3 protein in memory T cells). (D-E) Confocal images for C3 mRNA (using the PrimeFlow assay) and IFN-γ protein (D) and flow cytometry histograms for C3 mRNA (PrimeFlow assay) (E) in bulk CD4+ T cells activated for 36h in the presence and absence of ICAM-1. Shown are representative examples of four independent experiments (n=4). Size bar in ‘D’, 2 μm. Bars show mean + SEM throughout. *p < 0.05, **p < 0.01, ****p < 0.0001. See also Figure S2.
Figure 3.
Figure 3.. ICAM-1–LFA-1 interaction during diapedesis is required for C3 gene transcription.
(A) Schematic representation of the in vitro transmigration assay utilizing a trans-well system with HUVEC cells and sorted naive and memory CD4+ T cells. (B-D) Transmigration (B) of healthy donor naïve and memory CD4+ T cells across a trans-well system in the presence and absence of IL-1β (induces ICAM-1 expression by HUVEC cells), with and without DEL-1 (a specific inhibitor of LFA-1/ICAM-1 interaction) and expression of C3 (C) and IFNG (D) mRNA by transmigrated cells. Cumulative data from n=6–9 independent experiments. Bars show mean ± SEM. *p < 0.05, **p < 0.01, ***p < 0.005. See also Figure S3.
Figure 4:
Figure 4:. ICAM-1 drives C3-dependent metabolic reprogramming during T cell activation.
(A) IFN-γ secretion (left) and intracellular C3a generation (right) by healthy donor CD4+ T cells activated as shown in the presence and absence of ICAM-1 with and without a cell-permeable cathepsin L inhibitor (CTSLi) for 72h (n=4 independent experiments). (B) Representative flow cytometry plots from n=4 independent experiments showing C3 mRNA and the mTOR down-stream target S6 kinase phosphorylated at ser235/ser236 (p-S6) in healthy donor CD4+ T cells activated as shown in the presence or absence of ICAM-1 for 36h. (C) Extracellular acidification rate (ECAR, a measure of glycolysis) and oxygen consumption rate (OCR, a measure of oxidative phosphorylation) in healthy donor naive CD4+ T cells activated as shown in the presence or absence of ICAM-1 with and without a CTSL inhibitor for 36h. Shown are representative ECAR (above) and OCR (middle) graphs together with cumulative data of the maximal respiration and glycolysis (below) from n=3 independent experiments. NA, non-activated; FCCP, p-trifluoromethoxyphenyl hydrazone; OM, oligomycin; ROT, rotenone. Bars show mean ± SEM. *p < 0.05, **p < 0.01, ***p < 0.005, ****p < 0.001. See also Figure S4.
Figure 5:
Figure 5:. LFA-1 induces C3 gene expression in CD4+ T cells via AP-1.
(A-D) C3 mRNA expression in naive (A and B) and memory (C and D) CD4+ T cells activated as indicated in the presence or absence of ICAM-1 with and without a cell-permeable AP-1 inhibitor (AP-1 inh.) or DMSO carrier control at 72h post activation. Shown are representative flow cytometry histograms of (A and C) and cumulative data from n=5 (B) and n=4 (D) independent experiments. NA, non-activated. Error bars represent mean + SEM. **p < 0.01 ***, p < 0.005, ****p < 0.001. See also Figure S5.
Figure 6:
Figure 6:. LAD-1 disease causes failure of C3 expression and Th1 induction.
(A) Steady-state expression of C3 and IFNG mRNA in paired CD4+ T cells drawn from blood and synovial fluid of pediatric patients with juvenile idiopathic oligo-arthritis (n=4; Table S2). Bars show mean + SEM. (B) IFN-γ secretion by paired CD4+ T cells drawn from blood and synovial fluid of two patients with rheumatoid arthritis (RA) activated in vitro with antibodies against CD3 with, or without, ICAM-1. (C-D) C3 mRNA expression by synovial T cells of patients with either oligo-arthritis (OA), non-inflamed RA or inflamed RA derived from an independent dataset (Zhang et al., 2019) (C) and receiver operating characteristic curves showing performance of C3 and IFNG mRNA expression in synovial T cells as biomarkers to distinguish inflamed from un-inflamed RA (D). (E) LFA-1 expression (top), C3 mRNA (middle) and IFN-γ secretion (bottom) by peripheral blood CD4+ T cells from patients with LFA-1 mutations (LAD-1 disease) (see Table S3) and age- and sex-matched controls activated in vitro as shown with, and without ICAM-1 for 72h. Data are from three patients, two of whom donated twice, and five controls. Bars represent mean of duplicate measurements per subject. (F) regression lines showing correlation between IFN-γ and LFA-1 expression (left) and between C3 mRNA and LFA-1 expression (right) from primary data in (E). 95% confidence intervals of the regression line are shown and individual donors are marked. (G) IFN-γ secretion by peripheral blood CD4+ T cells from three patients with LAD-1 disease after transduction with control adenovirus or adenovirus encoding C3a, electroporation with mRNA encoding GFP or C3a or electroporation with BSA or C3H2O protein, as indicated. Cells were activated with anti-CD3+CD46+ICAM-1 after transduction or electroporation. Each patient has been labelled, two of whom donated three times, and the over-expression method shown by color-coding. *p<0.05. See also Figure S6 and Tables S2 and S3.

Similar articles

Cited by

References

    1. Abraham C, Griffith J, and Miller J (1999). The dependence for leukocyte function-associated antigen-1/ICAM-1 interactions in T cell activation cannot be overcome by expression of high density TCR ligand. J Immunol 162, 4399–4405. - PubMed
    1. Alcaide P, Maganto-Garcia E, Newton G, Travers R, Croce KJ, Bu DX, Luscinskas FW, and Lichtman AH (2012). Difference in Th1 and Th17 lymphocyte adhesion to endothelium. J Immunol 188, 1421–1430. - PMC - PubMed
    1. Alford SK, Longmore GD, Stenson WF, and Kemper C (2008). CD46-induced immunomodulatory CD4+ T cells express the adhesion molecule and chemokine receptor pattern of intestinal T cells. J Immunol 181, 2544–2555. - PMC - PubMed
    1. Arbore G, and Kemper C (2016). A novel “complement-metabolism-inflammasome axis” as a key regulator of immune cell effector function. Eur J Immunol 46, 1563–1573. - PMC - PubMed
    1. Arbore G, West EE, Rahman J, Le Friec G, Niyonzima N, Pirooznia M, Tunc I, Pavlidis P, Powell N, Li Y, et al. (2018). Complement receptor CD46 co-stimulates optimal human CD8. Nat Commun 9, 4186. - PMC - PubMed

Publication types

MeSH terms