. 2020 Mar 17;30(11):3932-3947.e6.
doi: 10.1016/j.celrep.2020.02.091.

Defining Epidermal Basal Cell States during Skin Homeostasis and Wound Healing Using Single-Cell Transcriptomics

Affiliations

Defining Epidermal Basal Cell States during Skin Homeostasis and Wound Healing Using Single-Cell Transcriptomics

Daniel Haensel et al. Cell Rep. .

Abstract

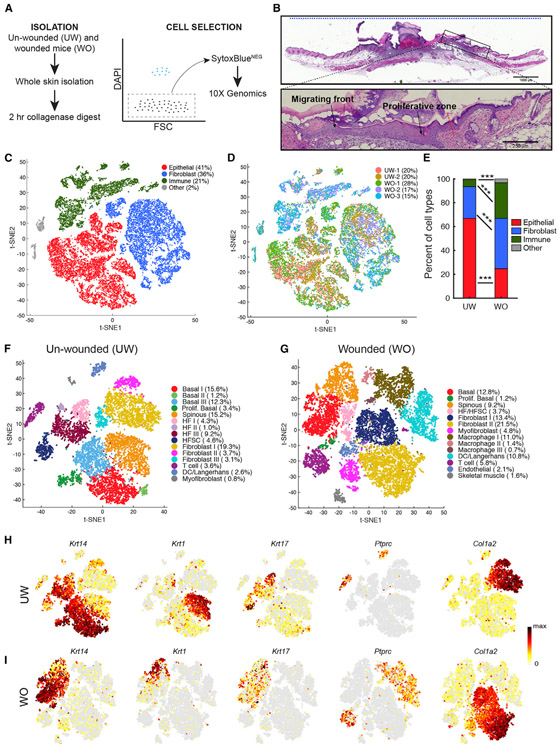
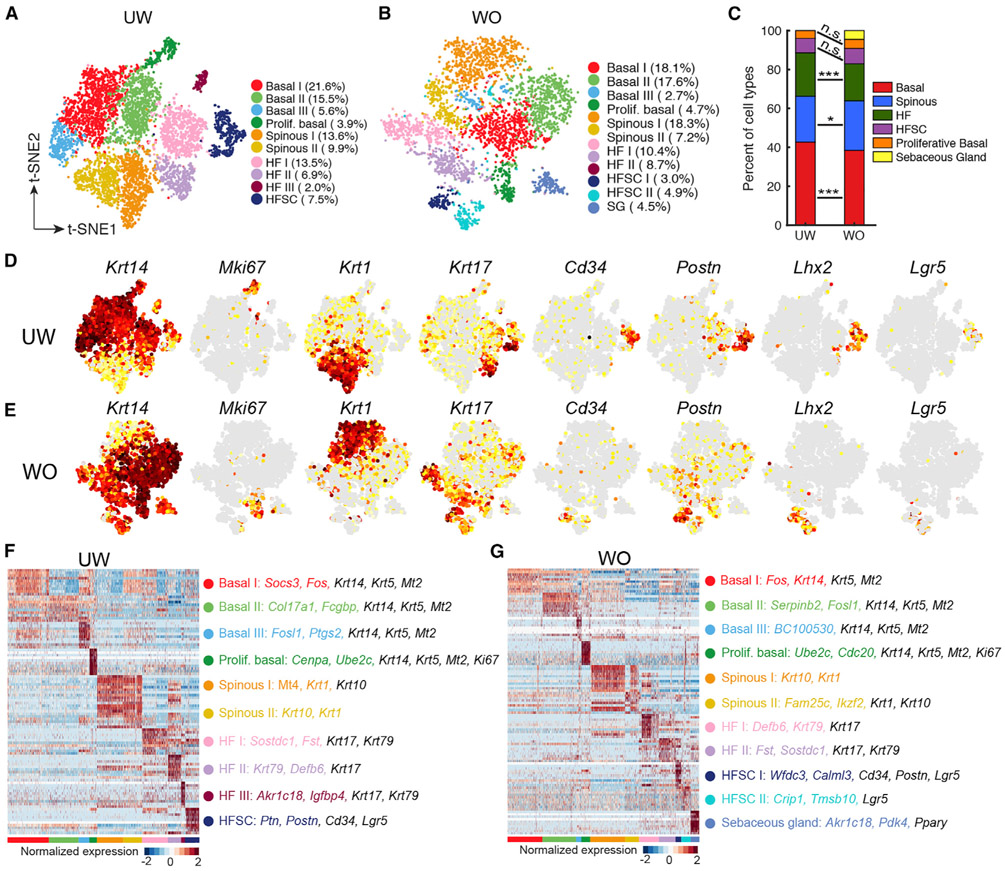
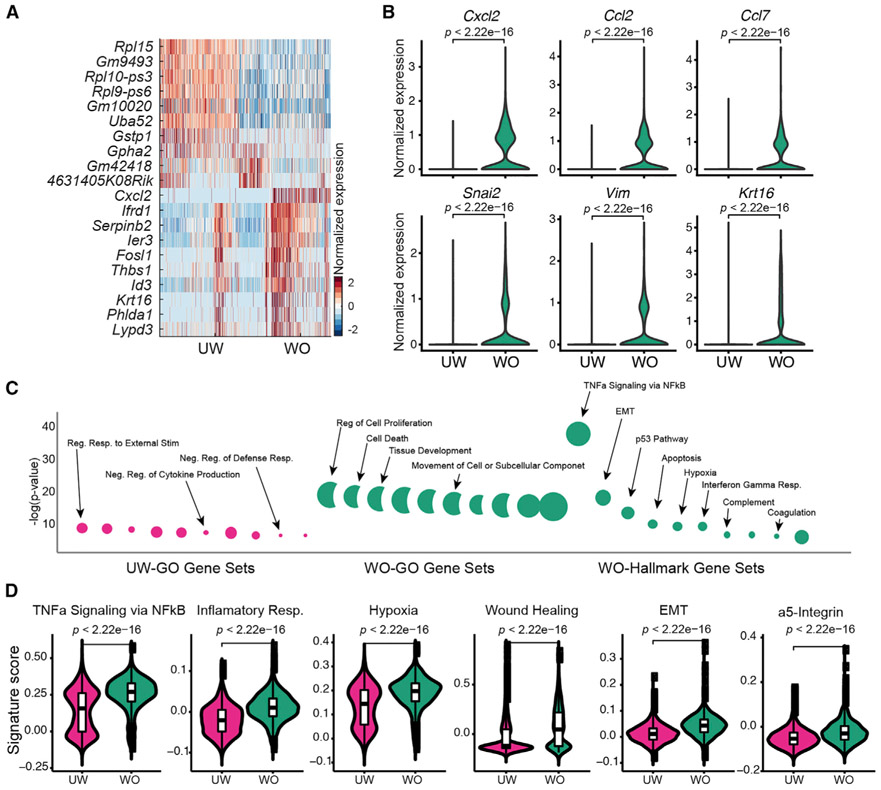
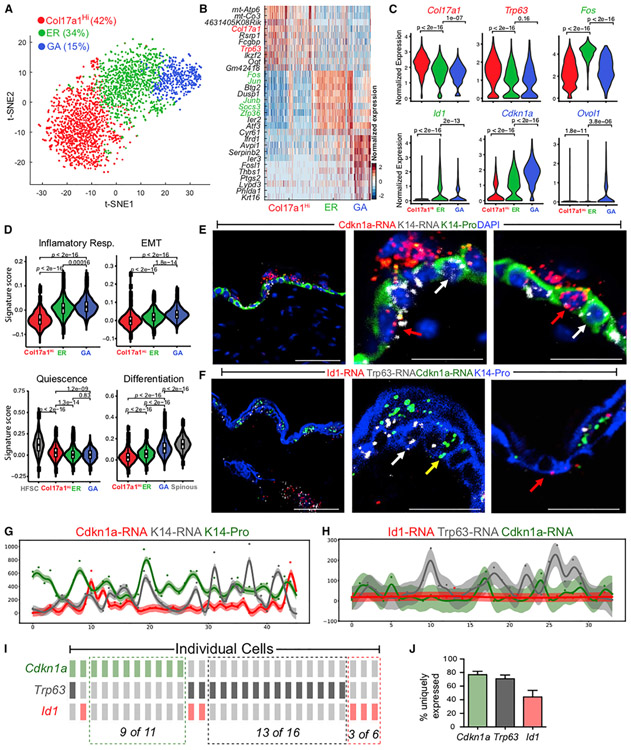
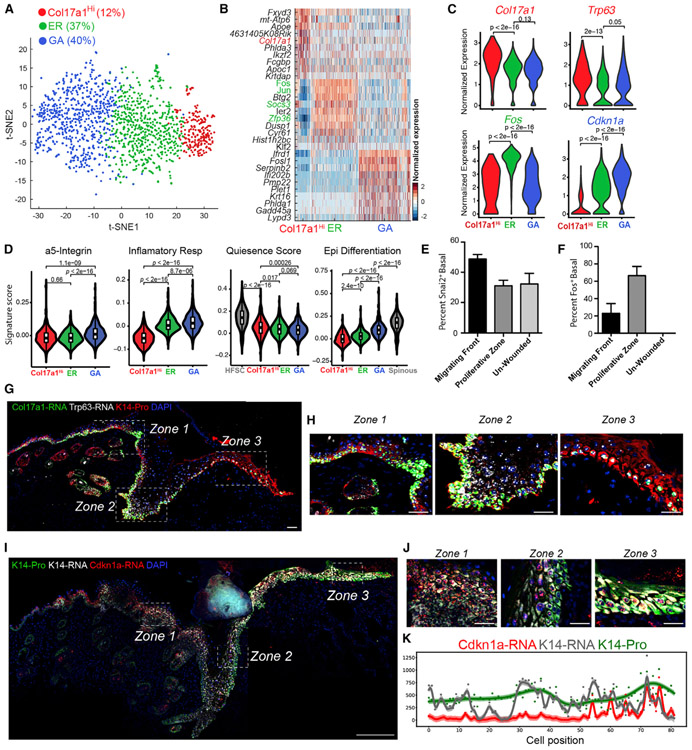
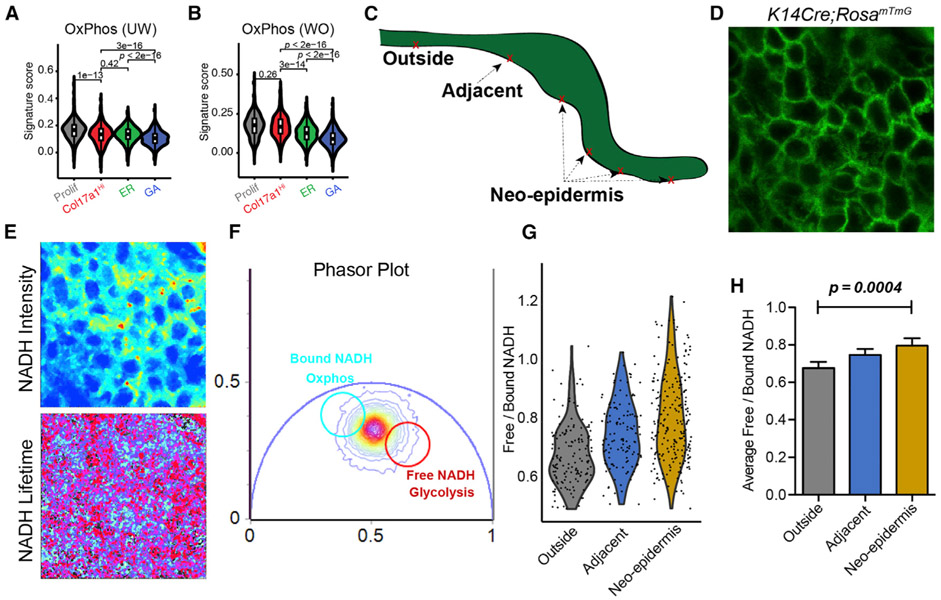
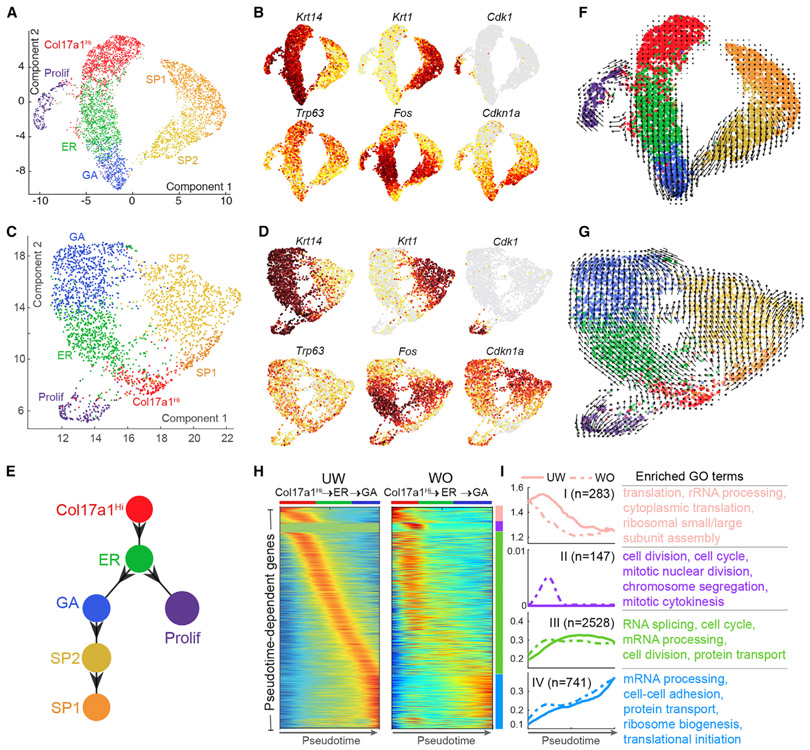
Our knowledge of transcriptional heterogeneities in epithelial stem and progenitor cell compartments is limited. Epidermal basal cells sustain cutaneous tissue maintenance and drive wound healing. Previous studies have probed basal cell heterogeneity in stem and progenitor potential, but a comprehensive dissection of basal cell dynamics during differentiation is lacking. Using single-cell RNA sequencing coupled with RNAScope and fluorescence lifetime imaging, we identify three non-proliferative and one proliferative basal cell state in homeostatic skin that differ in metabolic preference and become spatially partitioned during wound re-epithelialization. Pseudotemporal trajectory and RNA velocity analyses predict a quasi-linear differentiation hierarchy where basal cells progress from Col17a1Hi/Trp63Hi state to early-response state, proliferate at the juncture of these two states, or become growth arrested before differentiating into spinous cells. Wound healing induces plasticity manifested by dynamic basal-spinous interconversions at multiple basal transcriptional states. Our study provides a systematic view of epidermal cellular dynamics, supporting a revised "hierarchical-lineage" model of homeostasis.

Keywords: FLIM; basal cell state; cellular transition dynamics; epidermis; metabolism; plasticity; single-cell RNA sequencing; skin; stem cell; wound healing.


Conflict of interest statement

Declaration of Interests The authors declare no competing interests.

Figures

Figure 1.
Figure 1.. scRNA-Seq Analysis of All Cells in the UW and WO Skin
(A) Schematic diagram detailing the single-cell isolation and live-cell selection strategy. (B) H&E analysis of WO skin showing a region equivalent to those used for scRNA-Seq. The blue dashed line at the top indicates a representative 10-mm region used for single-cell suspension. Enlarged image of the boxed area in top panel is shown at the bottom to highlight the wound migrating front and proliferative zone. Red dashed line points to the wound margin. (C) t-Distributed Stochastic Neighbor Embedding (tSNE) plot for all five samples with the major cell type populations highlighted, and their relevant percentage per total number (26,779) of all cells indicated in parenthesis. The two small clusters in gray (labeled as “other”) are endothelial cells and skeletal muscle cells (see Figure S1C). (D) Cells are colored by replicate identity in the tSNE plot. (E) Bar graph representing major cell type populations. Chi-square test was used to determine the statistical significance of differences in the relative proportion of each cell type between UW and WO samples. ***p < 0.0005. (F) tSNE plot for the two aggregated UW replicate datasets. The percentage of cells present in each cluster per total number (10,615) of cells under analysis is indicated. Markers associated with the indicated cell types are listed in Figure S2B and Table S1A. (G) tSNE plot for the three aggregated WO replicate datasets (total 16,164 cells). Markers associated with the indicated cell types are listed in Figure S2C and Table S1B. (H) Feature plots showing expression of the indicated genes in the UW replicates in (F). Normalized expression levels for each cell are color-coded and overlaid onto the t-SNE plot. (I) Feature plots in the WO replicates in (G).
Figure 2.
Figure 2.. scRNA-Seq Analysis Reveals Mild Changes in Epithelial Cellular Makeup during Wound Healing
(A) tSNE plot for all epithelial cells from UW skin with cell each type indicated. The percentage of cells in each cluster per total number (7,099) of cells under analysis is indicated in parenthesis. (B) tSNE plot for all epithelial cells (4,021) from WO skin. (C) Bar graph representing the major epithelial cell type populations in the UW and WO samples. Chi-square test was performed (*p < 0.05; ***p < 0.0005). (D) Feature plots highlighting the expression of key genes in UW epithelial cells. (E) Feature plots highlighting the expression of key genes in WO epithelial cells. (F) Heatmap for the top 10 genes enriched in each cluster from the UW skin. Top two marker genes for each cluster are colored to match cluster identity, and additional genes used in the final annotations are colored in black. All marker genes are listed in Table S3A. (G) Heatmap for the top 10 genes enriched in each cluster from the WO skin. All marker genes are listed in Table S3B.
Figure 3.
Figure 3.. Gene Expression Differences between Epidermal Basal Cells of the UW and WO Skin
(A) Heatmap showing the top 10 markers for basal cells from the UW and WO samples. All the identified markers are listed in Table S4. (B) Expression of select genes in UW and WO basal cells. p values are from two-sided Wilcoxon rank-sum tests. (C) GO analysis of the identified markers (listed in Table S4) of UW and WO basal cells using GO (left) and Hallmark (right; defined by fewer genes) gene sets. (D) Gene scoring analysis using the indicated molecular signatures. p values are from two-sided Wilcoxon rank-sum tests.
Figure 4.
Figure 4.. scRNA-Seq and RNAScope Data Revealing Heterogeneity within UW Epidermal Basal Cells
(A) tSNE plot for NP basal cells from two UW replicates. The percentage of each subpopulation per total number (2,838) of basal cells was indicated. (B) Heatmap of top 10 markers for each subcluster in (A). Genes used to annotate cell identity are indicated by the corresponding colors. A complete list of marker genes is provided in Table S5. (C) Violin plots showing expression of key marker genes. p values are from two-sided Wilcoxon rank-sum tests. (D) Gene scoring analysis using the indicated molecular signatures. HFSCs and spinous cells from the UW sample were used as positive controls. p values are from two-sided Wilcoxon rank-sum tests. (E) RNAScope data showing spatial distribution of Cdkn1a and Krt14 transcripts and K14 protein in UW skin. Shown are both low (left)- and high (middle, right)-magnification images. Red and white arrows indicate Cdkn1a+ and Cdkn1a basal cells, respectively. DAPI stains the nuclei. Scale bars: 50 μm in low-magnification image; 10 μm in high-magnification images. (F) Spatial distribution of Cdkn1a, Trp63, and Id1 transcripts and K14 protein in UW skin. Red, white, and yellow arrows indicate Id1+, Trp63+, and Cdkn1a+ basal cells, respectively. Scale bars represent the same as in (E). (G) Quantification of fluorescence intensity (represented by a color-coded dot) for Cdkn1a and Krt14 transcripts and K14 protein in each individual cell from a representative section. The curve represents a Gaussian process regression (GPR), and a 95% confidence interval is shown as shaded area. (H) Quantification of fluorescence intensity for Cdkn1a, Trp63, and Id1 transcripts and K14 protein in each individual cell from a representative section. (I) OncoPrint representation of Cdkn1a, Trp63, and Id1 expression in individual cells where a rectangle represents an individual cell. A color-coded rectangle indicates high expression of the corresponding marker gene. The cells are sorted based on the onor off state of the markers to show mutually exclusive expression pattern. (J) Bar graph showing percentage of cells that exclusively express Cdkn1a, Trp63, or Id1 per total number of cells that express the particular gene (n = 3 replicates). Error bars represent mean ± SEM.
Figure 5.
Figure 5.. Basal Cell Heterogeneity in WO Skin
(A) tSNE plot for NP basal cells from two WO replicates. WO-2 was not included in this analysis given its low basal cell number. The percentage of each subpopulation per total number (1,555) of basal cells was indicated. (B) Heatmap of top 10 markers for each subcluster. A complete list of marker genes is provided in Table S6. (C) Violin plots showing expression of key marker genes. p values are from two-sided Wilcoxon rank-sum tests. (D) Gene scoring analysis using the indicated molecular signatures. p values are from two-sided Wilcoxon rank-sum tests. (E) Quantitative analysis of immunofluorescence data for Snai2 protein. Percent Snai2+ cells in the basal layer of different regions in WO skin is shown here, and representative images are shown in Figure S6F. (F) Quantitative analysis of immunofluorescence data for Fos protein. Percent Fos+ cells in the basal layer of different regions in WO skin is shown here and representative images are shown in Figure S6G. (G) RNAScope data showing spatial distribution of Col17a1 and Trp63 transcripts and K14 protein in WO skin. DAPI stains the nuclei. Scale bar: 50 μm. (H) Enlarged images of the boxed areas in (G). Zones 1–3 correspond to regions that are distal from the wound (zone 1), hyperproliferative (zone 2), and in migrating front (zone 3). Scale bar: 50 μm. (I) RNAScope data showing spatial distribution of Cdkn1a and Krt14 transcripts and K14 protein in WO skin. DAPI stains the nuclei. Scale bar: 50 μm. (J) Enlarged images of the boxed areas in (I). See legends for (H) for zone definition. Scale bar: 50 μm. (K) Quantification of fluorescence intensity for Cdkn1a and Krt14 transcripts and K14 protein in each individual cell from a representative WO skin section. The curve represents a GPR, and a 95% confidence interval is shown as shaded area.
Figure 6.
Figure 6.. FLIM Data Validating scRNA-Seq-Predicted Metabolic Heterogeneity in WO Skin
(A) Gene scoring analysis of all four UW basal subclusters using an oxidative phosphorylation signature. p values are from two-sided Wilcoxon rank-sum tests. (B) Gene scoring analysis of all four WO basal subclusters. p values are from two-sided Wilcoxon rank-sum tests. (C) Sketch diagram of wound epithelium showing the areas probed with FLIM. (D) A representative image of wound epidermal cells indicated by GFP expression. (E) Representative images of NADH signal and NADH lifetime signals. (F) A representative phasor plot with cell phasor fingerprint, which is a representation of the fluorescence lifetime decay of all cells in the region of interest (ROI) after fast Fourier transformation. (G) Violin plot incorporating all cells and their corresponding free/bound NADH ratios from four biological replicates (156 cells from the outside region, 127 cells from the adjacent region, and 231 cells from the neo-epidermis). (H) Quantification of average free/bound NADH ratios from multiple cells from the four biological replicates of various regions of the wound. For statistical analysis we used an unpaired two-tailed Student’s t test. Error bars represent mean ± SEM.
Figure 7.
Figure 7.. Pseudotemporal Dynamics Analysis of Interfollicular Epidermal Cells in UW and WO Skin
(A) UMAP dimensional reduction of all UW epidermal cells. Cells are colored by the annotated identity. (B) Feature plots of (A) for the indicated genes. Cells are colored by the normalized expression, with dark red indicating the highest expression. (C) UMAP of all WO epidermal cells. (D) Feature plots of (C) for the indicated genes. (E) scEpath-predicted lineage differentiation diagram. (F) Projection of non-linear RNA velocity fields onto the UMAP space in (A). (G) Projection of non-linear RNA velocity fields onto the UMAP space in (C). (H) Pseudotemporal dynamics of the 3,699 UW pseudotime-dependent genes along the Col17a1Hi-to-GA path in UW and WO samples. Each row (i.e., gene) is normalized to its peak value along the pseudotime. Distinct stages during pseudotime are represented by colored bars on the side. Cell identity is indicated on the top of each heatmap generated by the smoothed, normalized gene expression. (I) Average expression patterns (left) and enriched biological processes (right) of the four gene clusters along pseudotime in (H). Solid and dashed lines indicate the average expression of a particular gene cluster in UW and WO samples, respectively. The number of genes in each gene cluster is indicated in parenthesis, and the enriched GO terms in each gene cluster are listed.

References

    1. Andl T, Ahn K, Kairo A, Chu EY, Wine-Lee L, Reddy ST, Croft NJ, Cebra-Thomas JA, Metzger D, Chambon P, et al. (2004). Epithelial Bmpr1a regulates differentiation and proliferation in postnatal hair follicles and is essential for tooth development. Development 131, 2257–2268. - PubMed
    1. Andrianne M, Assabban A, La C, Mogilenko D, Salle DS, Fleury S, Doumont G, Van Simaeys G, Nedospasov SA, Blackshear PJ, et al. (2017).Tristetraprolin expression by keratinocytes controls local and systemic inflammation. JCI Insight 2, e92979. - PMC - PubMed
    1. Aragona M, Dekoninck S, Rulands S, Lenglez S, Mascré G, Simons BD, and Blanpain C (2017). Defining stem cell dynamicsand migration during wound healing in mouse skin epidermis. Nat. Commun 8, 14684. - PMC - PubMed
    1. Briso EM, Guinea-Viniegra J, Bakiri L, Rogon Z, Petzelbauer P, Eils R, Wolf R, Rincón M, Angel P, and Wagner EF (2013). Inflammation-mediated skin tumorigenesis induced by epidermal c-Fos. Genes Dev. 27, 1959–1973. - PMC - PubMed
    1. Butler A, Hoffman P, Smibert P, Papalexi E, and Satija R (2018). Integrating single-cell transcriptomic data across different conditions, technologies, and species. Nat. Biotechnol 36, 411–420. - PMC - PubMed

Publication types