

ATM-CHK2-Beclin 1 axis promotes autophagy to maintain ROS homeostasis under oxidative stress
- PMID: 32187724
- PMCID: PMC7232007
- DOI: 10.15252/embj.2019103111
ATM-CHK2-Beclin 1 axis promotes autophagy to maintain ROS homeostasis under oxidative stress
Abstract
The homeostatic link between oxidative stress and autophagy plays an important role in cellular responses to a wide variety of physiological and pathological conditions. However, the regulatory pathway and outcomes remain incompletely understood. Here, we show that reactive oxygen species (ROS) function as signaling molecules that regulate autophagy through ataxia-telangiectasia mutated (ATM) and cell cycle checkpoint kinase 2 (CHK2), a DNA damage response (DDR) pathway activated during metabolic and hypoxic stress. We report that CHK2 binds to and phosphorylates Beclin 1 at Ser90/Ser93, thereby impairing Beclin 1-Bcl-2 autophagy-regulatory complex formation in a ROS-dependent fashion. We further demonstrate that CHK2-mediated autophagy has an unexpected role in reducing ROS levels via the removal of damaged mitochondria, which is required for cell survival under stress conditions. Finally, CHK2-/- mice display aggravated infarct phenotypes and reduced Beclin 1 p-Ser90/Ser93 in a cerebral stroke model, suggesting an in vivo role of CHK2-induced autophagy in cell survival. Taken together, these results indicate that the ROS-ATM-CHK2-Beclin 1-autophagy axis serves as a physiological adaptation pathway that protects cells exposed to pathological conditions from stress-induced tissue damage.
Keywords: ROS; Beclin 1; CHK2; autophagy; oxidative stress.
© 2020 The Authors.
Conflict of interest statement
The authors declare that they have no conflict of interest.
Figures
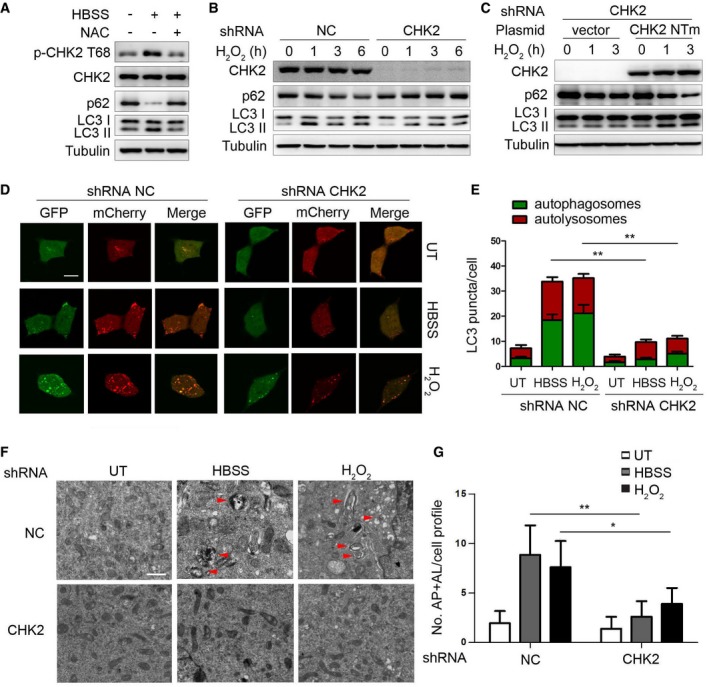
Western blot detection of p‐CHK2 Thr68, CHK2, p62, and LC3 in H1299 cells in normal medium (HBSS “−”) or after 1 h HBSS starvation (HBSS “+”) pretreated with or without NAC (3 mM).
Western blot detection of p62 and LC3 in H1299 cells transfected with the indicated shRNA in normal medium or after H2O2 (500 μM) treatment.
Western blot detection of p62 and LC3 in H1299 cells cotransfected with the indicated shRNA and the indicated plasmid and cultured in normal medium or after H2O2 (500 μM) treatment. CHK2 NTm, a shRNA nontargetable mutant CHK2 rescue plasmid.
Autophagic flux is shown by representative confocal microscopic images of 293 cells stably expressing GFP‐mCherry‐LC3 transfected with the indicated shRNA following HBSS starvation and H2O2 (500 μM) treatment for 3 h. Scale bar, 10 μm.
Quantitation of autophagosomal (yellow) and autolysosomal (red) LC3 puncta following HBSS starvation and H2O2 (500 μM) treatment for 1 h (n = 30). Data are presented as mean ± s.e.m. from three independent experiments; **P < 0.01 (Student's t‐test).
Representative electron microscopic image of autophagic vesicles or autophagosomes in H1299 cells transfected with the indicated shRNA in normal medium or after 3 h HBSS starvation or treated with H2O2 (500 μM). Scale bars, 500 nm. The red arrows indicate double‐membraned autophagic structures.
Electron microscopic quantification of autophagy vacuole in H1299 cells transfected with the indicated shRNA in normal medium or after 3 h HBSS starvation or treated with H2O2 (500 μM). Data are presented as mean ± s.e.m. from three independent experiments; *P < 0.05; **P < 0.01 (Student's t‐test).
- A
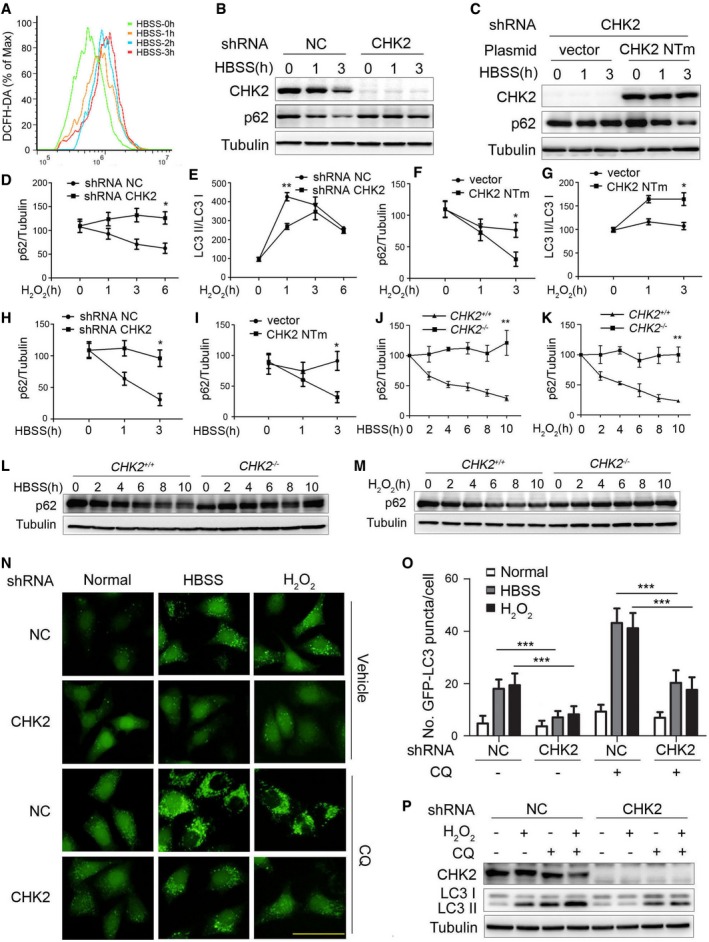
Intracellular ROS levels detected in H1299 cells treated with HBSS starvation.
- B
Western blot detection of p62 in H1299 cells transfected with the indicated shRNA in normal medium or after HBSS starvation.
- C
Western blot detection of p62 in H1299 cells cotransfected with the indicated shRNA and plasmid and cultured in normal or HBSS starvation medium. CHK2 NTm, shRNA nontargetable mutant CHK2 rescue plasmid.
- D, E
Quantification of p62 and LC3‐II/I protein levels in H1299 cells transfected with the indicated shRNA in normal medium or after H2O2 (500 μM) treatment. Results are presented as mean ± s.e.m. from three independent experiments, *P < 0.05, **P < 0.01 (Student's t‐test).
- F, G
Quantification of p62 and LC3‐II/I protein levels in H1299 cells cotransfected with the indicated shRNA and plasmid and cultured in normal medium or after H2O2 (500 μM) treatment. Results are presented as mean ± s.e.m. from three independent experiments, *P < 0.05 (Student's t‐test).
- H
Quantification of p62 protein levels in H1299 cells transfected with the indicated shRNA in normal medium or after HBSS starvation. Results are presented as mean ± s.e.m. from three independent experiments, *P < 0.05 (Student's t‐test).
- I
Quantification of p62 protein levels in H1299 cells cotransfected with the indicated shRNA and plasmid and cultured in normal medium or after HBSS starvation. Results are presented as mean ± s.e.m. from three independent experiments, *P < 0.05 (Student's t‐test).
- J
Quantification of p62 protein levels in MEFs of indicated genotype during growth in normal medium or after HBSS starvation. Results are presented as mean ± s.e.m. from three independent experiments, **P < 0.01 (Student's t‐test).
- K
Quantification of p62 protein levels in MEFs of the indicated genotype during growth in normal medium or after H2O2 (500 μM) treatment. Results are presented as mean ± s.e.m. from three independent experiments, **P < 0.01 (Student's t‐test).
- L
Western blot detection of p62 in MEFs of the indicated genotype during growth in normal medium or after HBSS starvation.
- M
Western blot detection of p62 in MEFs of the indicated genotype during growth in normal medium or after H2O2 (500 μM) treatment.
- N
Representative images of GFP‐LC3 puncta in HeLa/GFP‐LC3 cells transfected with the indicated shRNA, pretreated with 60 nM CQ or vehicle (DMSO), and cultured for 1 h in normal, HBSS starvation medium or treated with H2O2 (500 μM). Scale bar, 50 μm.
- O
Quantification of GFP‐LC3 puncta in HeLa/GFP‐LC3 cells transfected with the indicated shRNA, pretreated with 60 nM CQ or vehicle (DMSO), and cultured for 1 h in normal, HBSS starvation medium or treated with H2O2 (500 μM; n = 30). Results are presented as mean ± s.e.m. from three independent experiments, ***P < 0.001 (Student's t‐test).
- P
Western blot detection of LC3 in H1299 cells transfected with the indicated shRNA, pretreated with 60 nM CQ or vehicle (DMSO), and cultured for 3 h in normal or treated with H2O2 (500 μM).
- A
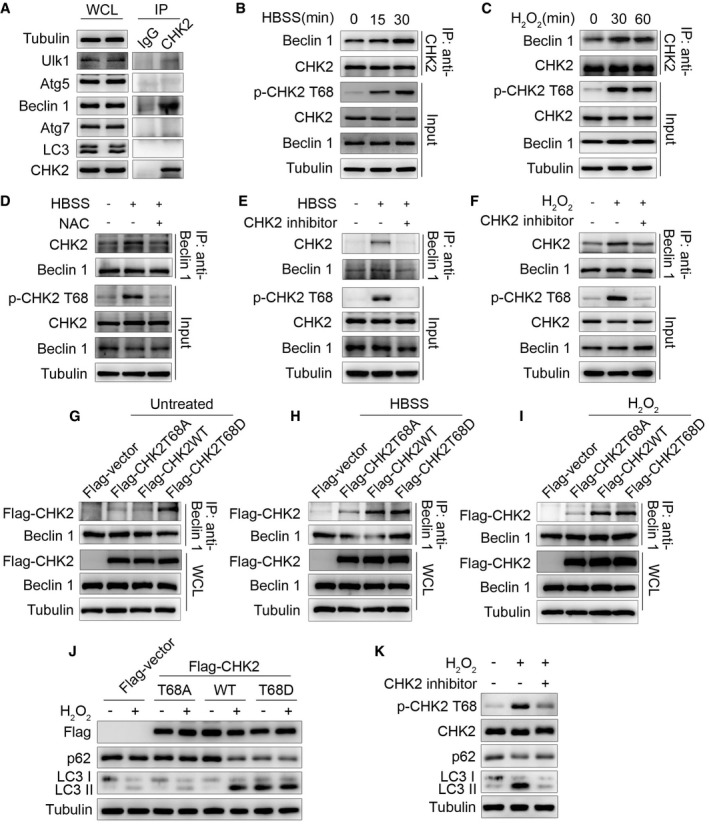
Immunoprecipitation assays testing the physical interaction between CHK2 and proteins encoded by autophagy‐related genes in HCT116 cells. Lysates were extracted for immunoprecipitation with CHK2‐specific antibody or control IgG, followed by probing with antibodies specific for Ulk1, Atg5, Beclin 1, Atg7, or LC3.
- B
Interaction between endogenous CHK2 and Beclin 1 in HCT116 cells under fed conditions (t = 0) and after HBSS starvation in the cytoplasmic fractions.
- C
Interaction between endogenous CHK2 and Beclin 1 in HCT116 cells under fed conditions (t = 0) and after H2O2 (500 μM) stimulation in the cytoplasmic fractions.
- D
HCT116 cells were pretreated with NAC in RPMI 1640 complete medium for 4 h and then cultured for 1 h in HBSS starvation. The cytoplasmic lysates were subjected to immunoprecipitation with anti‐Beclin 1 antibody followed by immunoblotting with anti‐CHK2 and anti‐Beclin 1 antibodies. The expression of p‐CHK2 Thr68, CHK2, and Beclin 1 was monitored by immunoblotting in the cytoplasmic fractions. Tubulin was used as a loading control.
- E, F
HCT116 cells were pretreated with CHK2 inhibitor II in RPMI 1640 complete medium for 4 h and then cultured for 1 h in HBSS starvation (E) or H2O2 (500 μM) stimulation (F). The cytoplasmic lysates were subjected to immunoprecipitation with anti‐Beclin 1 antibody followed by immunoblotting with anti‐CHK2 and anti‐Beclin 1 antibodies. The expression of p‐CHK2 Thr68, CHK2, and Beclin 1 was monitored by immunoblotting in the cytoplasmic fractions. Tubulin was used as a loading control.
- G–I
HCT116 cells were transiently transfected with the expression plasmids as indicated. After 36 h post‐transfection, cells were treated or untreated (G) with HBSS starvation (H) or H2O2 (500 μM) stimulation (I) for 1 h and then collected for immunoprecipitation and Western blotting analysis. Immunoprecipitation was performed using anti‐Beclin 1 antibody followed by immunoblotting with anti‐Flag or anti‐Beclin 1 antibody.
- J
Western blot detection of p62 and LC3 in H1299 cells transfected with indicated plasmid in normal medium or after H2O2 (500 μM) cultured for 3 h.
- K
H1299 cells were pretreated with CHK2 inhibitor II in complete medium for 4 h and then cultured for 3 h in H2O2 (500 μM) stimulation. Western blot detection of p‐CHK2 Thr68, CHK2, p62, and LC3.
- A
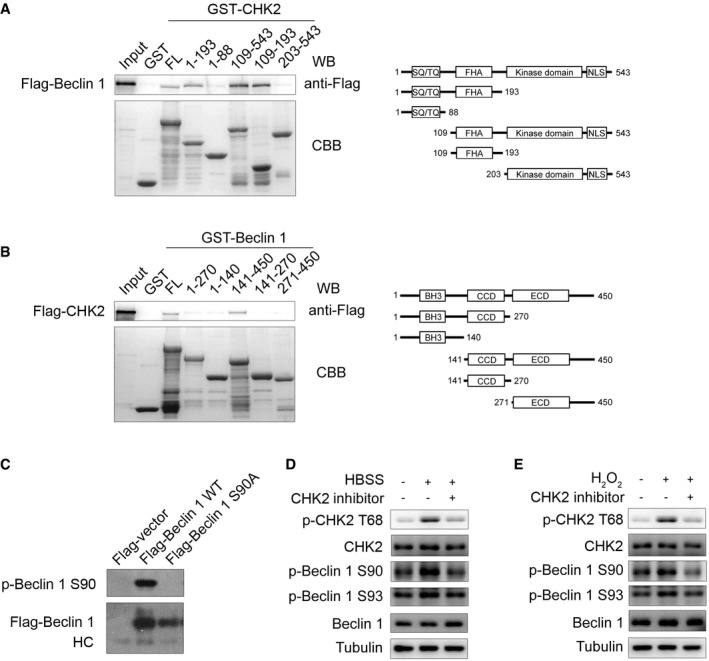
GST‐CHK2 full‐length (FL) and fragments fusion proteins were expressed in bacteria and purified; these proteins were then incubated with in vitro‐translated Flag‐Beclin 1 protein. Western blotting was performed to detect the interaction of Beclin 1 with CHK2.
- B
GST‐Beclin 1 FL and fragments fusion proteins were expressed in bacteria and purified; these proteins were then incubated with in vitro‐translated Flag‐CHK2 protein. Western blotting was performed to detect the interaction of CHK2 with Beclin 1.
- C
Cell lysates from 293 cells transfected with WT or mutant forms of Flag‐Beclin 1 were immunoprecipitated with Flag‐M2 beads followed by Western blot using antibody against Beclin 1 Ser90 or Flag.
- D, E
H1299 cells were pretreated with CHK2 inhibitor II in complete medium for 4 h and then cultured for 1 h in HBSS starvation (D) or H2O2 (500 μM) stimulation (E). Western blot detection of p‐CHK2 Thr68, CHK2, p‐Beclin 1 Ser90, p‐Beclin 1 Ser93, and Beclin 1.
- A
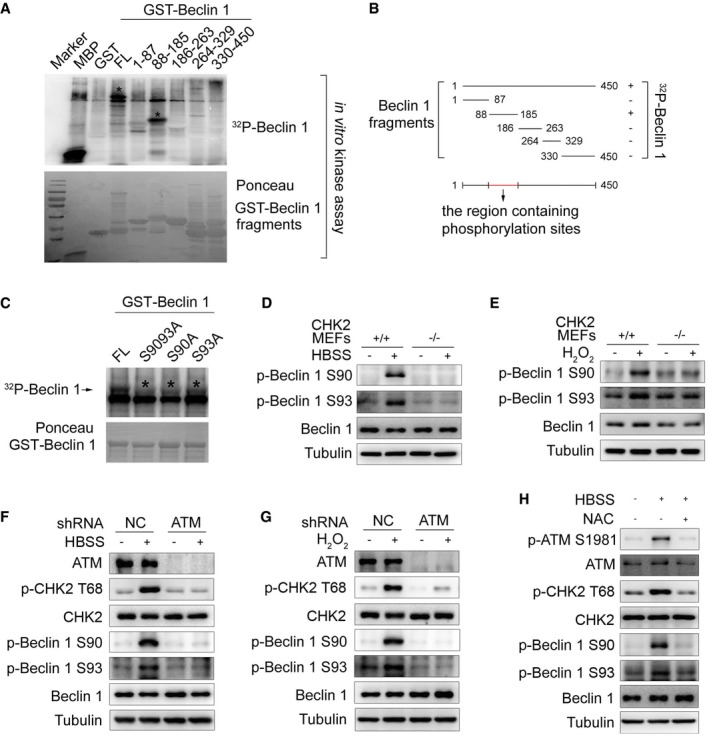
The indicated recombinant fragments of GST‐Beclin 1 were incubated with recombinant CHK2 in the presence of 32P‐labeled ATP for in vitro kinase assays. MBP was used as a positive control. Ponceau staining indicates the expression of GST‐Beclin 1 fragments for in vitro kinase assays. The asterisks in the blot indicate the domain of phosphorylated Beclin 1.
- B
Schematic representation of recombinant fragments of Beclin 1.
- C
In vitro kinase assays to test the ability of recombinant CHK2 to phosphorylate recombinant GST‐Beclin 1 WT, S9093A (AA), S90A, and S93A protein. Reactions were analyzed by SDS–PAGE followed by autoradiography. The asterisks in the blot indicate the phosphorylation of Beclin 1 mutants.
- D, E
Western blot detection of p‐Beclin 1 Ser90, p‐Beclin 1 Ser93, and Beclin 1 in MEFs indicated genotype in normal medium or after 1 h HBSS starvation (D) or H2O2 (500 μM) stimulation (E).
- F, G
Western blot detection of ATM, p‐CHK2 Thr68, CHK2, p‐Beclin 1 Ser90, p‐Beclin 1 Ser93, and Beclin 1 in H1299 cells transfected with indicated shRNA in normal medium or after HBSS starvation (F) or H2O2 (500 μM) stimulation (G).
- H
Western blot detection of p‐ATM Ser1981, ATM, p‐CHK2 Thr68, CHK2, p‐Beclin 1 Ser90, p‐Beclin 1 Ser93, and Beclin 1 in H1299 cells pretreated with NAC for 4 h and then cultured for 1 h in HBSS starvation.
- A
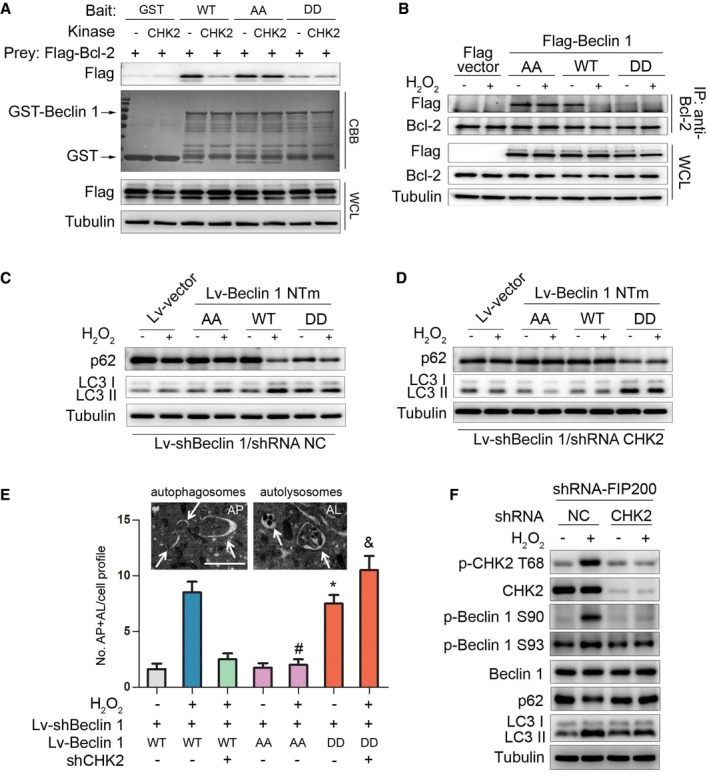
The effect of Beclin 1 Ser90/93 phosphorylation on the interaction between Beclin 1 and Bcl‐2. GST‐Beclin 1 WT, AA mutant, and DD mutant (bait) were incubated with or without recombinant CHK2 in the presence of ATP and then incubated with Flag‐Bcl‐2 (preys).
- B
Immunoprecipitation of Bcl‐2 with Flag‐Beclin 1 WT, AA mutant, and DD mutant in HCT116 cells in normal medium or after H2O2 (500 μM) treatment for 1 h.
- C, D
Autophagy levels were determined in Beclin 1‐depleted H1299 cells with reconstituted expression of Beclin 1 WT, AA mutant, or DD mutant in normal medium or after H2O2 (500 μM) treatment for 3 h in the presence (C) or absence (D) of CHK2.
- E
Representative electron microscopic image of an autophagosome (arrow, left panel, AP) and an autolysosome (arrow, right panel, AL) in H1299 Beclin 1 WT cells treated with H2O2 (500 μM) for 6 h. Scale bars, 500 nm. Electron microscopic quantification of autophagosomes (AP) and autolysosomes (AL) in H1299 cells with the indicated plasmids cultured for 6 h in normal or H2O2 (500 μM) treatment. All quantitative data are presented as mean ± s.e.m. from three independent experiments; *P < 0.001 compared to Beclin 1 WT; # P < 0.001 compared to Beclin 1 WT treated with H2O2; & P < 0.001 compared to Beclin 1 WT treated with H2O2 in the absence of CHK2.
- F
Western blot detection of p‐CHK2 Thr68, CHK2, p‐Beclin 1 Ser90, p‐Beclin 1 Ser93, Beclin 1, p62, and LC3 in H1299 cells transfected with the indicated shRNA in normal medium or after H2O2 (500 μM) treatment for 3 h.
- A
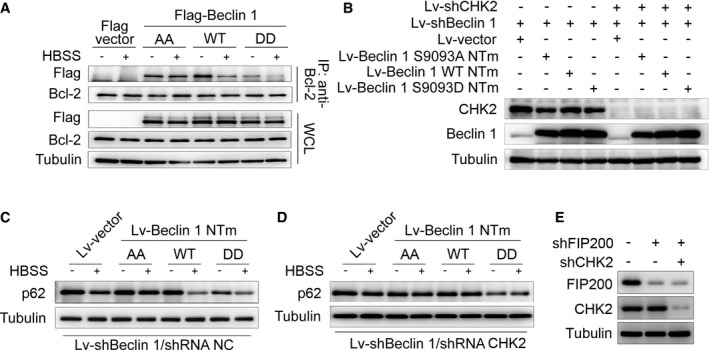
Immunoprecipitation of Bcl‐2 with Flag‐Beclin 1 WT, AA mutant, and DD mutant in HCT116 cells in normal medium or after HBSS starvation.
- B
Beclin 1‐depleted H1299 cells with reconstituted expression of the indicated proteins.
- C, D
Autophagy level was determined in Beclin 1‐depleted H1299 cells with reconstituted expression of Beclin 1 WT, AA mutant, or DD mutant in normal medium or after HBSS starvation in the presence (C) or absence (D) of CHK2.
- E
FIP200‐ and CHK2‐depleted H1299 cells with reconstituted expression of the indicated proteins.
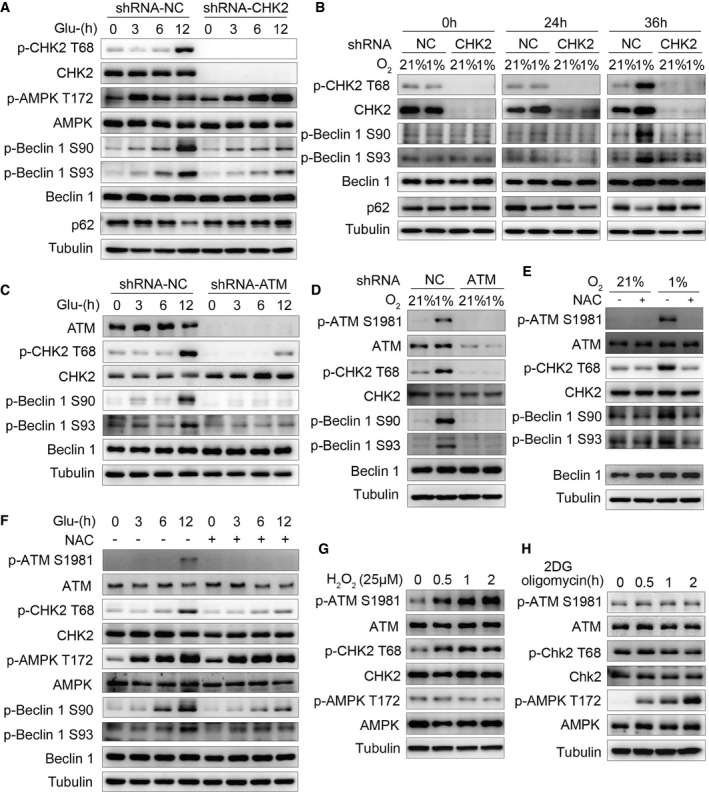
Western blot detection of p‐CHK2 Thr68, CHK2, p‐AMPKα Thr172, AMPKα, p‐Beclin 1 Ser90, p‐Beclin 1 Ser93, and Beclin 1 in H1299 cells transfected with the indicated shRNA in normal medium or after glucose starvation.
Western blot detection of p‐CHK2 Thr68, CHK2, p‐Beclin 1 Ser90, p‐Beclin 1 Ser93, and Beclin 1 in H1299 cells transfected with the indicated shRNA in normal medium or after hypoxia.
Western blot detection of ATM, p‐CHK2 Thr68, CHK2, p‐Beclin 1 Ser90, p‐Beclin 1 Ser93, and Beclin 1 in H1299 cells transfected with the indicated shRNA in normal medium or after glucose starvation.
Western blot detection of p‐ATM Ser1981, ATM, p‐CHK2 Thr68, CHK2, p‐Beclin 1 Ser90, p‐Beclin 1 Ser93, and Beclin 1 in H1299 cells transfected with the indicated shRNA in normal medium or after hypoxia.
P‐ATM Ser1981, ATM, p‐CHK2 Thr68, CHK2, p‐Beclin 1 Ser90, p‐Beclin 1 Ser93, and Beclin 1 were analyzed in H1299 cells, and the cells were subjected to hypoxia with or without pretreatment with NAC.
P‐ATM Ser1981, ATM, p‐CHK2 Thr68, CHK2, p‐AMPKα Thr172, AMPKα, p‐Beclin 1 Ser90, p‐Beclin 1 Ser93, and Beclin 1 were analyzed in H1299 cells, and the cells were subjected to glucose starvation with or without pretreatment with NAC.
Western blot detection of p‐ATM Ser1981, ATM, p‐CHK2 Thr68, CHK2, p‐AMPKα Thr172, and AMPKα in H1299 cells in normal medium or after H2O2 (25 μM) stimulation.
Western blot detection of p‐ATM Ser1981, ATM, p‐CHK2 Thr68, CHK2, p‐AMPKα Thr172, and AMPKα in H1299 cells in normal medium or after 2DG (5 mM) and oligomycin (2.5 μM) treatment.
- A
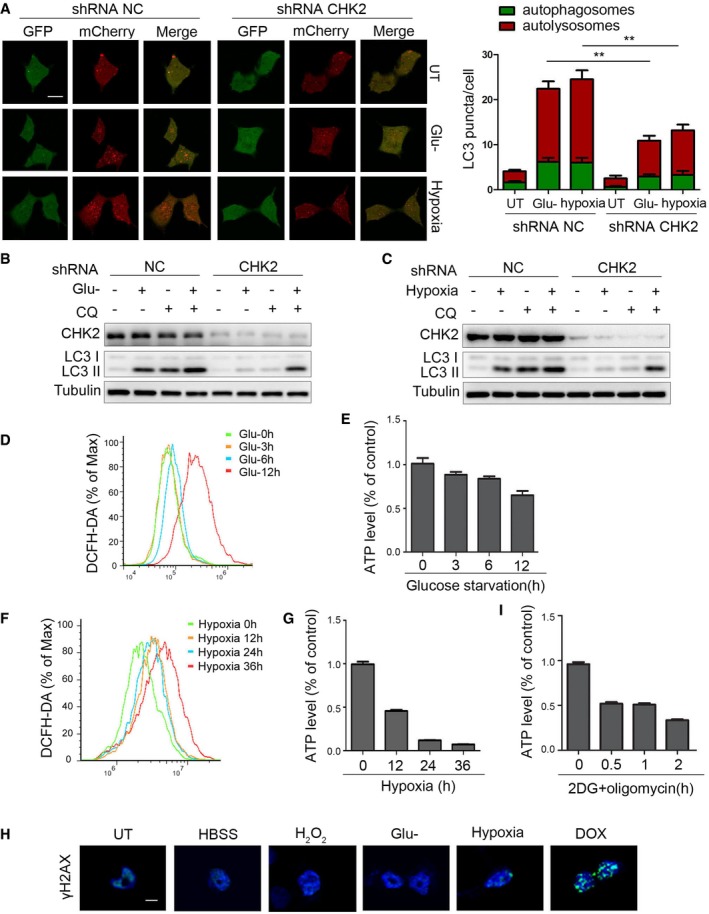
Autophagic flux is shown by representative confocal microscopic images for 293 cells stably expressing GFP‐mCherry‐LC3 transfected with the indicated shRNA. Scale bar, 10 μm. Quantitation of autophagosomal (green) and autolysosomal (red) LC3 puncta following 12‐h glucose starvation and 36‐h hypoxia (n = 30). Data are presented as mean ± s.e.m. from three independent experiments; **P < 0.01 (Student's t‐test).
- B
Western blot detection of LC3 in H1299 cells transfected with the indicated shRNA, pretreated with 30 nM CQ or vehicle (DMSO), and cultured for 12 h in normal or glucose starvation.
- C
Western blot detection of LC3 in H1299 cells transfected with the indicated shRNA, pretreated with 30 nM CQ or vehicle (DMSO), and cultured for 36 h in normal or hypoxia.
- D, E
Intracellular ROS (D) or ATP (E) levels detected in H1299 cells treated with glucose starvation. Data are presented as mean ± s.e.m. from three independent experiments.
- F, G
Intracellular ROS (F) or ATP (G) levels detected in H1299 cells treated with hypoxia. Data are presented as mean ± s.e.m. from three independent experiments.
- H
H1299 cells detected with γH2AX staining followed by HBSS starvation (1 h), H2O2 treatment (200 μM, 3 h), glucose starvation (10 h), hypoxia (36 h), and DOX (0.5 μM, 3 h). Scale bar, 10 μm.
- I
Intracellular ATP levels detected in H1299 cells treated with 2DG (5 mM) and oligomycin (2.5 μM) treatment. Data are presented as mean ± s.e.m. from three independent experiments.
- A, B
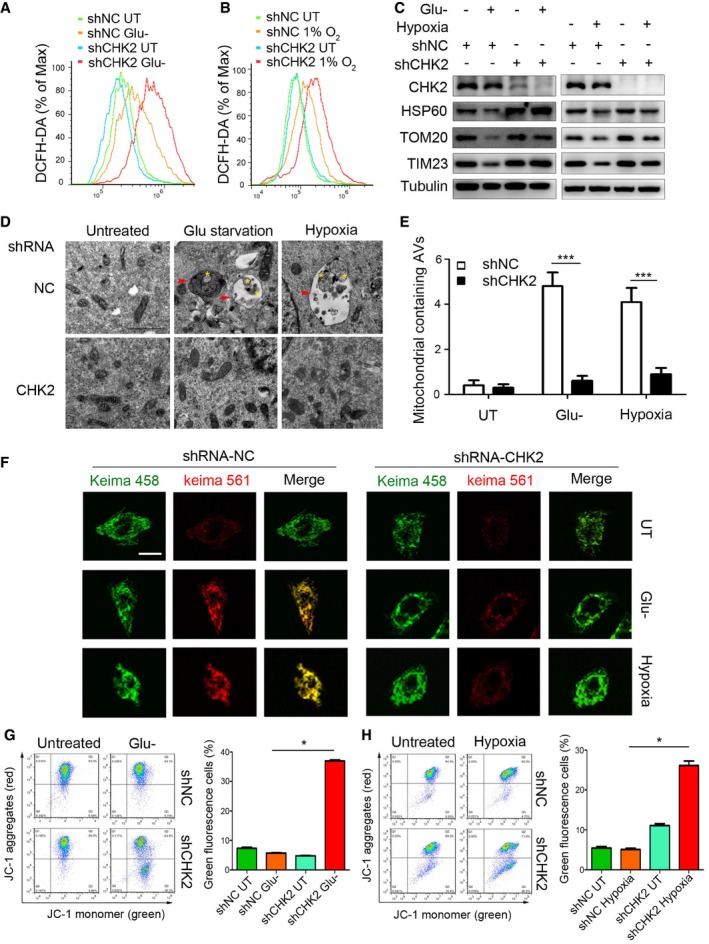
Intracellular ROS levels detected in H1299 cells transfected with the indicated shRNA in normal medium or after 12‐h glucose starvation (Glu‐) (A) or 36‐h hypoxia (B).
- C
Western blot detection of CHK2, HSP60, TOM20, and TIM23 in H1299 cells transfected with the indicated shRNA in normal medium or after 12‐h glucose starvation (Glu‐) or 36‐h hypoxia.
- D, E
Transmission electron microscopy of indicated H1299 cells cultured in glucose starvation (Glu‐) medium or hypoxia. The yellow asterisks mark mitochondria. The red arrows indicate autophagic structures. All quantitative data are presented as mean ± s.e.m. from three independent experiments; ***P < 0.001 compared to shNC treated with H2O2 or hypoxia (Mann–Whitney test); Scale bar, 1 μm.
- F
Representative confocal images of the shift in the fluorescence emission of Keima from 458 to 561 nm. Scale bar, 10 μm.
- G, H
The mitochondrial membrane potential analysis of 293 cells transfected with the indicated shRNA in normal medium or after 18‐h glucose starvation (G) or 48‐h hypoxia (H). All results are from three independent experiments. All quantitative data are presented as mean ± s.e.m. from three independent experiments; *P < 0.05 (Mann–Whitney test).
- A, B
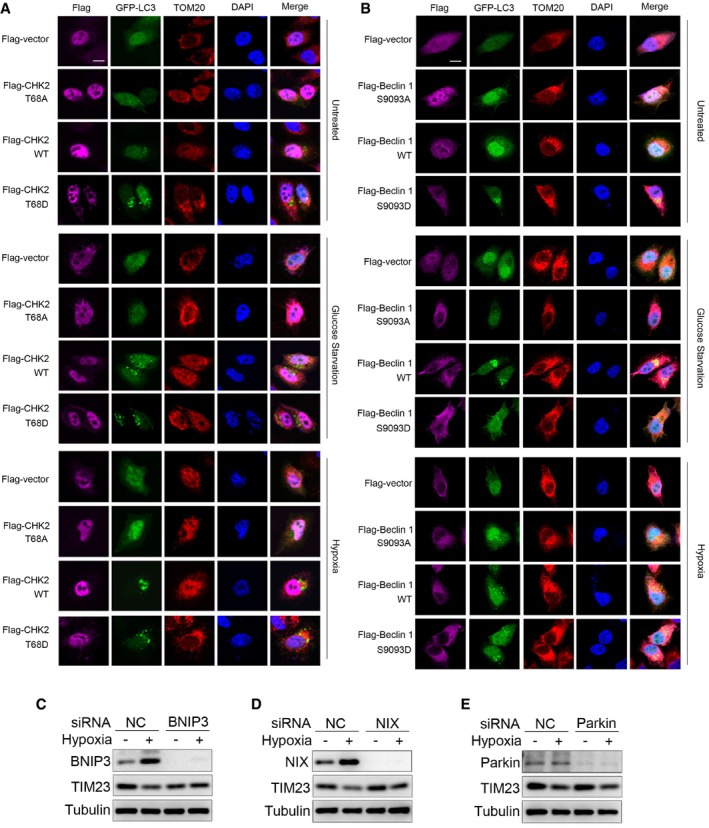
Fluorescence microscopy of the colocalization of GFP‐LC3 with mitochondria (identified with the mitochondrial stain TOM20) in H1299 cells transfected with the indicated plasmid and cultured in untreated (UT), glucose starvation for 12 h, or subjected to hypoxia for 36 h. DAPI, DNA‐binding dye. Scale bar, 10 μm.
- C
Western blot detection of BNIP3 and TIM23 in H1299 cells transfected with the indicated siRNA and untreated or subjected to hypoxia for 36 h.
- D
Western blot detection of NIX and TIM23 in H1299 cells transfected with the indicated siRNA and untreated or subjected to hypoxia for 36 h.
- E
Western blot detection of parkin and TIM23 in H1299 cells transfected with the indicated siRNA and untreated or subjected to hypoxia for 36 h.
- A, B
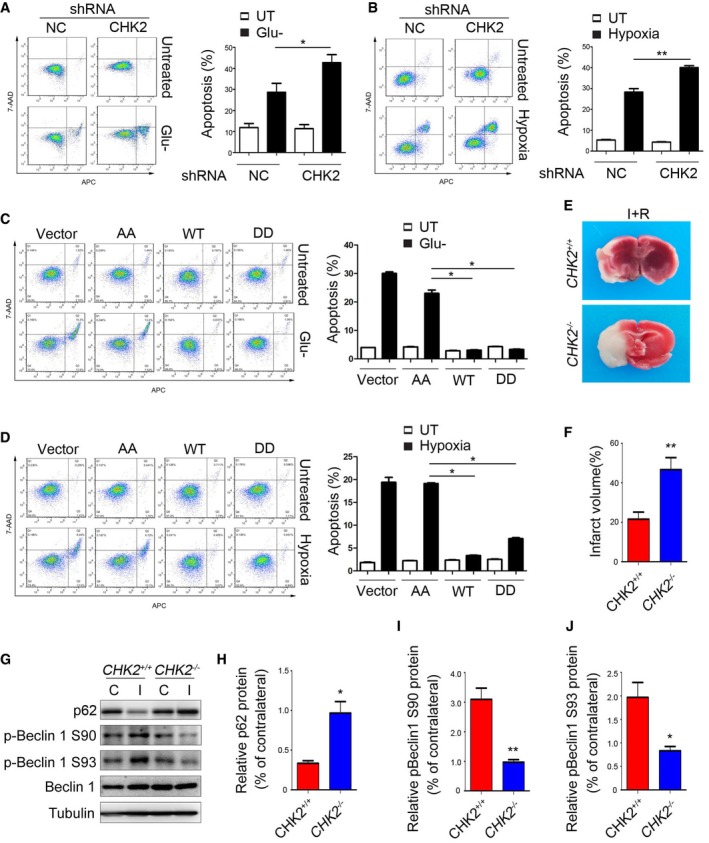
H1299 cells transfected with the indicated shRNA in normal medium or after 12‐h glucose starvation (A) or 48‐h hypoxia stimulation (B). Representative FACS analysis of apoptosis. Data are presented as mean ± s.e.m. from three independent experiments; *P < 0.05 compared to NC glucose starvation (A); **P < 0.01 compared to NC hypoxia (B) (Student's t‐test).
- C, D
H1299 cells transfected with the indicated plasmids in normal medium or after 12‐h glucose starvation (C) or 48‐h hypoxia stimulation (D). Representative FACS analysis of apoptosis. Results from three independent experiments are presented as a histogram. Data are presented as mean ± s.e.m. from three independent experiments; *P < 0.05 compared to Beclin 1 S9093A (AA) treated with H2O2 or hypoxia (Mann–Whitney test).
- E
CHK2 +/+ and CHK2 −/− mice were subjected to MCAO for 1 h and reperfusion for 12 h. Contralateral (C) and ipsilateral (I) tissues of the mouse brain were coronally sectioned and stained with 2% TTC.
- F
The infarct volume was determined by measuring infarct size relative to normal in the slice. (n = 5 mice). Data are presented as mean ± s.e.m.; **P < 0.01 (Student's t‐test).
- G–J
Immunoblots for p62, p‐Beclin 1 Ser90, p‐Beclin 1 Ser93, and Beclin 1 in the cortical extracts from ischemia‐ and reperfusion‐treated CHK2 +/+ and CHK2 −/− mice. Quantification of p62, p‐Beclin 1 Ser90, and p‐Beclin 1 Ser93 protein levels (n = 3 mice). Data are presented as mean ± s.e.m.; *P < 0.05, **P < 0.01 (Student's t‐test).
References
-
- Bakkenist CJ, Kastan MB (2003) DNA damage activates ATM through intermolecular autophosphorylation and dimer dissociation. Nature 421: 499–506 - PubMed
-
- Choi SL, Kim SJ, Lee KT, Kim J, Mu J, Birnbaum MJ, Soo Kim S, Ha J (2001) The regulation of AMP‐activated protein kinase by H(2)O(2). Biochem Biophys Res Commun 287: 92–97 - PubMed
Publication types
MeSH terms
Substances
Grants and funding
- IRT13101/17R107/Ministry of Education Innovation Team Development Plan/International
- 31300963/National Natural Science Foundation of China (NSF)/International
- 81702738/National Natural Science Foundation of China (NSF)/International
- 81502400/National Natural Science Foundation of China (NSF)/International
- 2016YFC1302400/National Key R&D Program of China/International
LinkOut - more resources
Full Text Sources
Medical
Molecular Biology Databases
Research Materials
Miscellaneous
