

Protein phosphatase PP2A regulates microtubule orientation and dendrite pruning in Drosophila
- PMID: 32187821
- PMCID: PMC7202222
- DOI: 10.15252/embr.201948843
Protein phosphatase PP2A regulates microtubule orientation and dendrite pruning in Drosophila
Abstract
Pruning that selectively eliminates inappropriate projections is crucial for sculpting neural circuits during development. During Drosophila metamorphosis, ddaC sensory neurons undergo dendrite-specific pruning in response to the steroid hormone ecdysone. However, the understanding of the molecular mechanisms underlying dendrite pruning remains incomplete. Here, we show that protein phosphatase 2A (PP2A) is required for dendrite pruning. The catalytic (Microtubule star/Mts), scaffolding (PP2A-29B), and two regulatory subunits (Widerborst/Wdb and Twins/Tws) play important roles in dendrite pruning. Functional analyses indicate that PP2A, via Wdb, facilitates the expression of Sox14 and Mical prior to dendrite pruning. Furthermore, PP2A, via Tws, governs the minus-end-out orientation of microtubules (MTs) in the dendrites. Moreover, the levels of Klp10A, a MT depolymerase, increase when PP2A is compromised. Attenuation of Klp10A fully rescues the MT orientation defects in mts or pp2a-29b RNAi ddaC neurons, suggesting that PP2A governs dendritic MT orientation by suppressing Klp10A levels and/or function. Taken together, this study sheds light on a novel function of PP2A in regulating dendrite pruning and dendritic MT polarity in sensory neurons.
Keywords: Klp10A; dendrite pruning; microtubule orientation; neuron; protein phosphatase.
© 2020 Temasek Life Sciences Laboratory Limited.
Conflict of interest statement
The authors declare that they have no conflict of interest.
Figures
- A
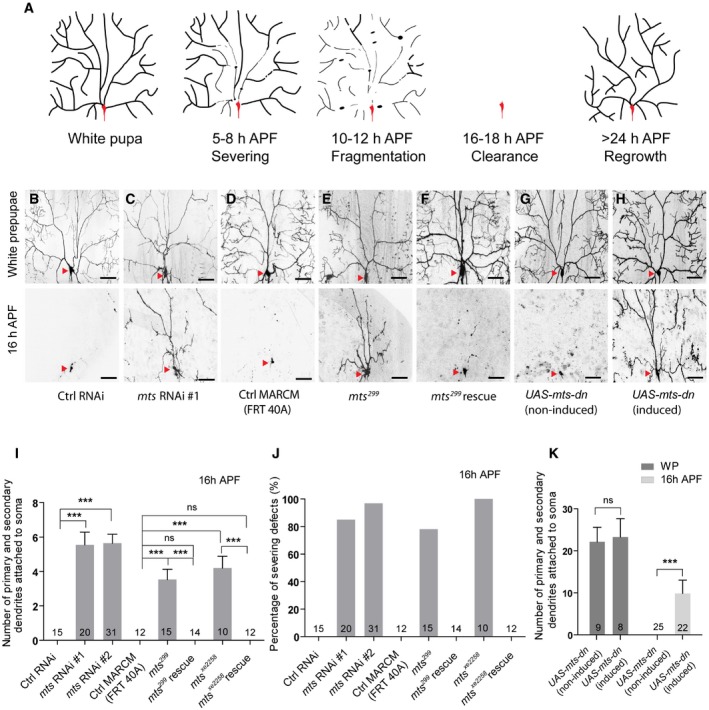
A Schematic representation of dendrite pruning in ddaC neurons.
- B–F
Live confocal images of ddaC neurons expressing UAS‐mCD8‐GFP driven by ppk‐Gal4 at WP and 16 h APF stages. Dendrites of ctrl RNAi (B), mts RNAi #1 (C), ctrl MARCM (D), mts 299 MARCM (E), and mts 299 rescue (F) ddaC neurons at WP and 16 h APF stages. Red arrowheads point to the ddaC somas.
- G, H
UAS‐mts‐dn ddaC neurons from animals in RU486‐induced condition (H) driven by GeneSwitch‐Gal4‐2295 exhibited normal arbors at WP stage and severe dendrite pruning defects at 16 h APF, compared to those in a non‐induced condition (G). Red arrowheads point to the ddaC somas.
- I–K
Quantification of number of primary and secondary dendrites attached to soma and percentage of severing defects at 16 h APF.
- A
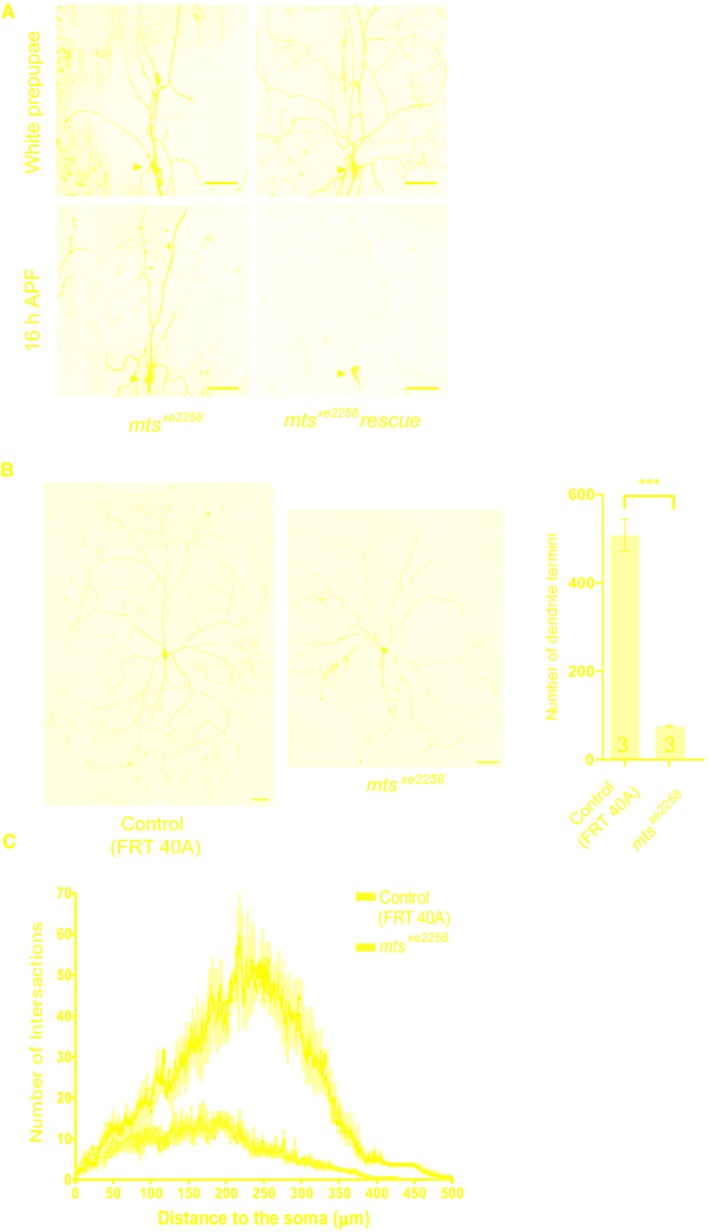
Live confocal images of ddaC neurons expressing mCD8‐GFP driven by ppk‐Gal4 at WP and 16 h APF stages. Dendrites of mts xe2258 MARCM and mts xe2258 rescue ddaC neurons at WP and 16 h APF stages. Red arrowheads point to the ddaC somas.
- B, C
Live confocal images of ddaC neurons visualized by ppk‐Gal4‐driven mCD8::GFP expression at wL3 stage. ddaC neurons of mts xe2258 MARCM clone exhibited simplified dendrite arbors at WP stage. The rightest panel in B is the quantification of number of dendrite terminal and sholl analysis (C) for control and mts xe2258 MARCM ddaC clones.
- A–E
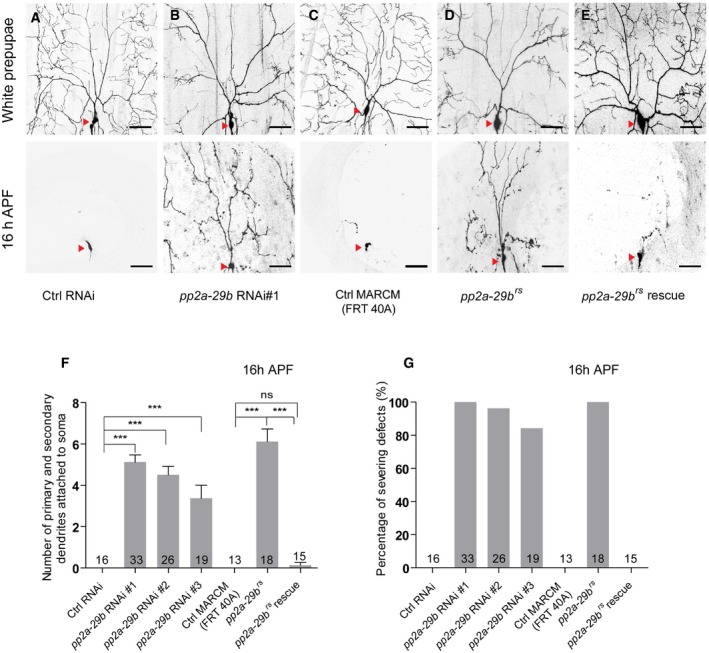
Live confocal images of ddaC neurons expressing UAS‐mCD8‐GFP driven by ppk‐Gal4 at WP and 16 h APF stages. Dendrites of ctrl RNAi (A), pp2a‐29b RNAi #1 (B), ctrl MARCM (C), pp2a‐29b rs MARCM (D), and pp2a‐29b rs rescue (E) ddaC neurons at WP and 16 h APF stages. Red arrowheads point to the ddaC somas.
- F, G
Quantification of number of primary and secondary dendrites attached to soma and percentage of severing defects at 16 h APF.
- A–H
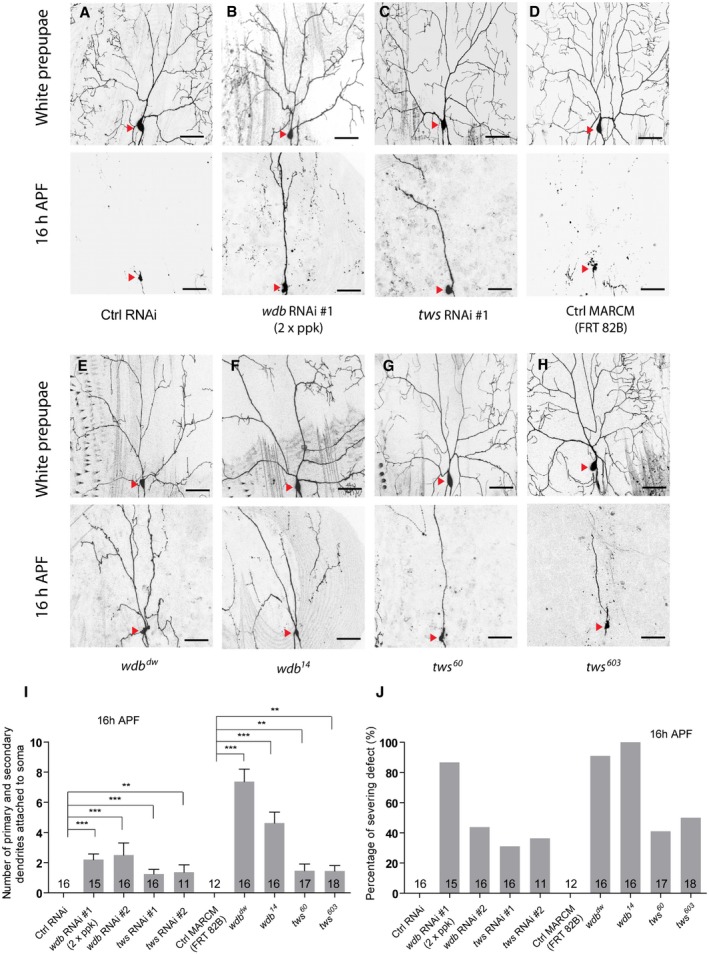
Live confocal images of ddaC neurons expressing UAS‐mCD8‐GFP driven by ppk‐Gal4 at WP and 16 h APF stages. Dendrites of ctrl RNAi (A), wdb RNAi #1 driven by two copies of ppk‐Gal4 (B), tws RNAi #1 (C), ctrl MARCM (D), wdb dw MARCM (E), wdb 14 MARCM (F), tws 60 MARCM (G), and tws 603 MARCM (H) ddaC neurons at WP and 16 h APF stages. Red arrowheads point to the ddaC somas.
- I, J
Quantification of number of primary and secondary dendrites attached to soma and percentage of severing defects at 16 h APF.
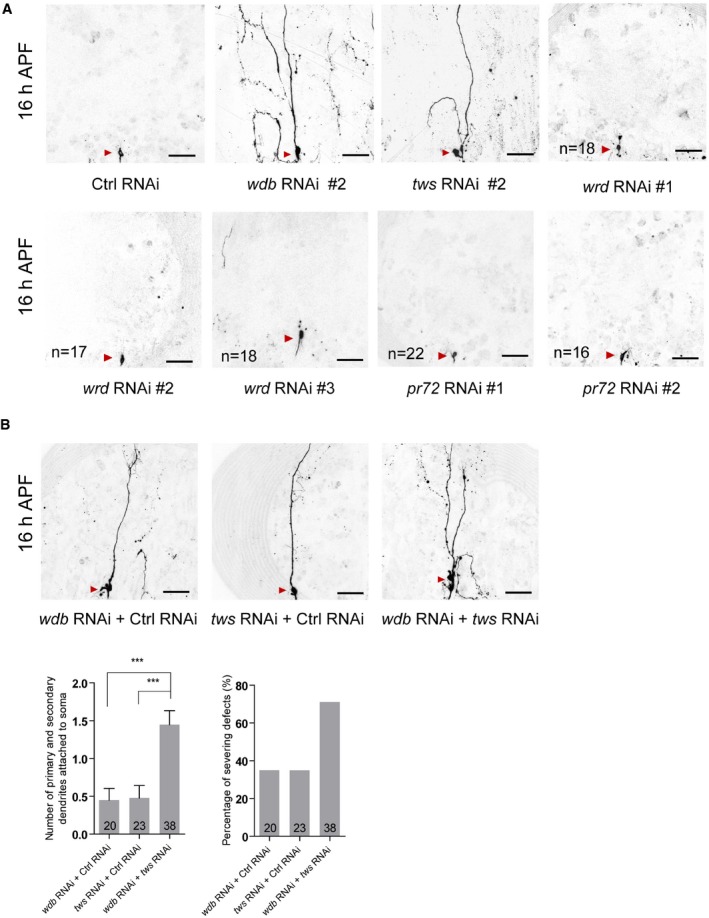
Live confocal images of ddaC neurons expressing mCD8‐GFP driven by ppk‐Gal4 at 16 h APF stage. Dendrites of ctrl RNAi, wdb RNAi #2, tws RNAi #2, wrd RNAi #1, wrd RNAi #2, wrd RNAi #3, pr72 RNAi #1, and pr72 RNAi #2 ddaC neurons at 16 h APF stage. Red arrowheads point to the ddaC somas. The numbers of neurons (n) examined for wrd and pr72 are shown on the panels.
Live confocal images of ddaC neurons expressing mCD8‐GFP driven by ppk‐Gal4 at 16 h APF stage. Dendrites of wdb RNAi + ctrl RNAi, tws RNAi + ctrl RNAi, and wdb RNAi + tws RNAi ddaC neurons at 16 h APF stage. Red arrowheads point to the ddaC somas. Quantification of number of primary and secondary dendrites attached to soma and percentage of severing defects in these genotypes at 16 h APF (bottom panels).
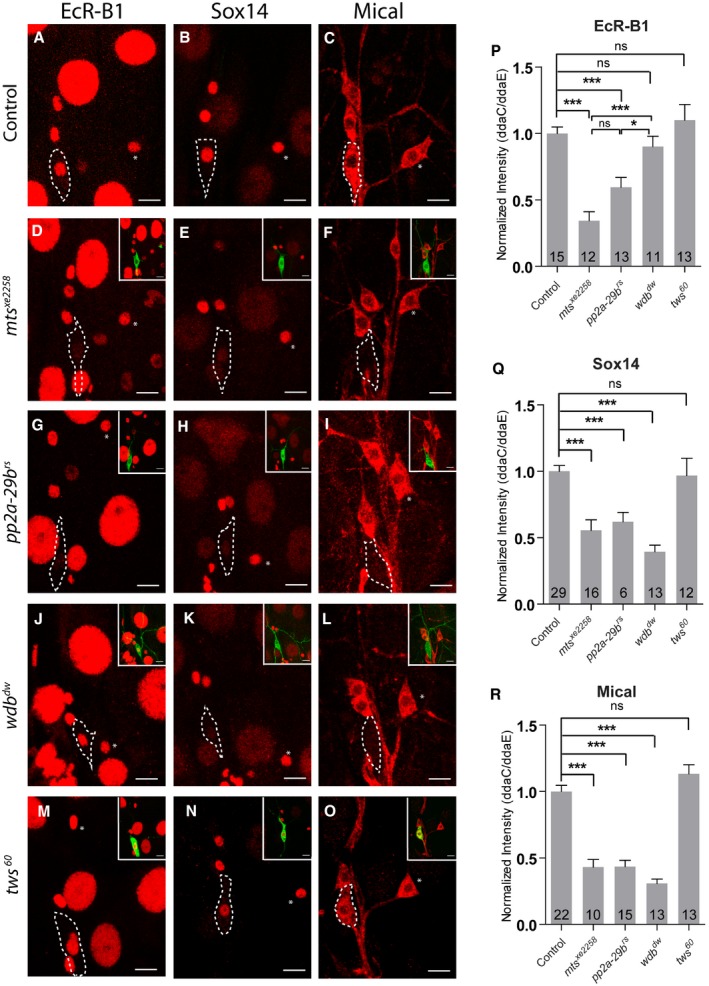
- A–O
Confocal images of control (A–C), mts xe2258 (D–F), pp2a‐29b rs (G–I), wdb dw (J–L), and tws 60 (M–O), MARCM ddaC clones that were immunostained for EcR‐B1 (A, D, G, J, M) and Sox14 (B, E, H, K, N), and Mical (C, F, I, L, O) at WP stage. ddaC somas are labeled by dashed lines, ddaE by asterisks. ddaC neurons were identified by ppk‐Gal4‐driven mCD8::GFP (green channel) expression, as shown at the top right corner.
- P–R
Quantitative analyses of normalized EcR‐B1, Sox14, and Mical fluorescence intensities in ddaC neurons.
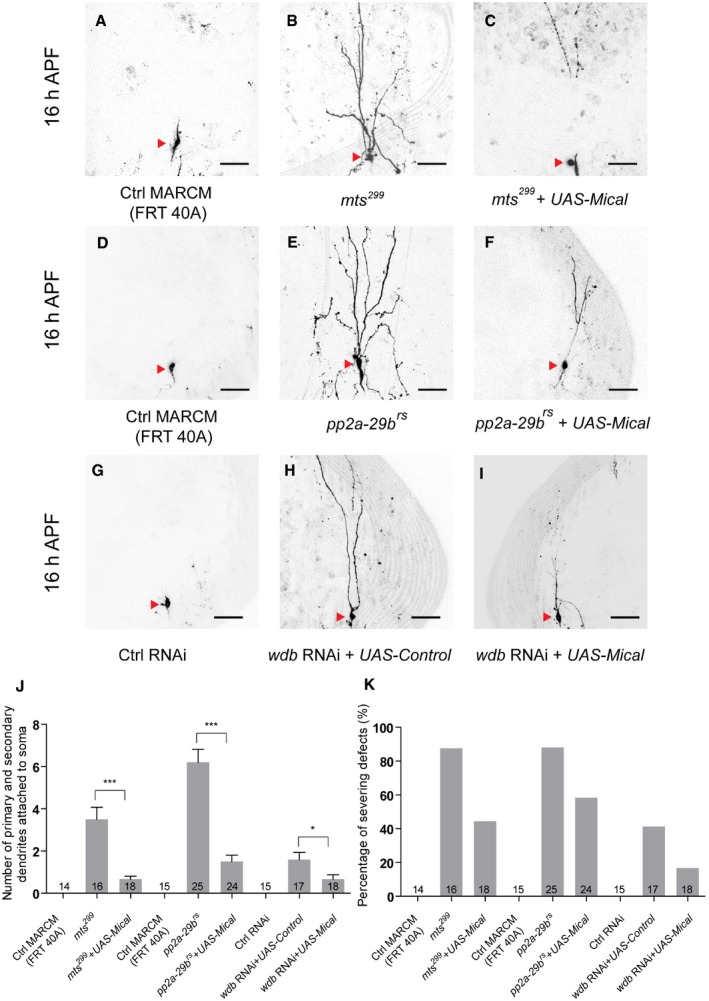
- A–I
Live confocal images of ddaC neurons expressing UAS‐mCD8‐GFP driven by ppk‐Gal4 at WP and 16 h APF stages. Dendrites of ctrl MARCM (A), mts 299 MARCM (B), UAS‐Mical + mts 299 MARCM (C), ctrl MARCM (D), pp2a‐29b rs MARCM (E), UAS‐Mical + pp2a‐29b rs MARCM (F), ctrl RNAi (G), wdb RNAi + UAS‐Control (H), and wdb RNAi + UAS‐Mical (I) ddaC neurons at 16 h APF stage. Red arrowheads point to the ddaC somas.
- J, K
Quantification of number of primary and secondary dendrites attached to soma and percentage of severing defects at 16 h APF.
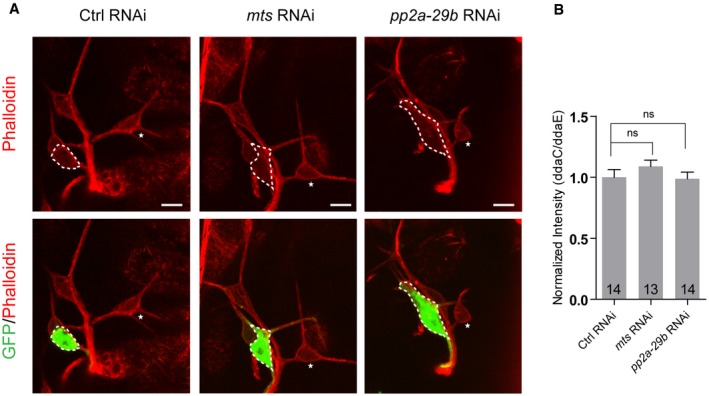
Confocal images of ctrl RNAi, mts RNAi, and pp2a‐29b RNAi ddaC neurons immunostained for phalloidin at wL3 stage. ddaC somas are labeled by dashed lines. ddaC neurons were identified by ppk‐Gal4‐driven mCD8::GFP (green channel) expression. ddaC somas are labeled by dashed lines, and ddaE somas are marked by asterisks.
Quantitative analysis of normalized phalloidin fluorescence intensities of ddaC somas.
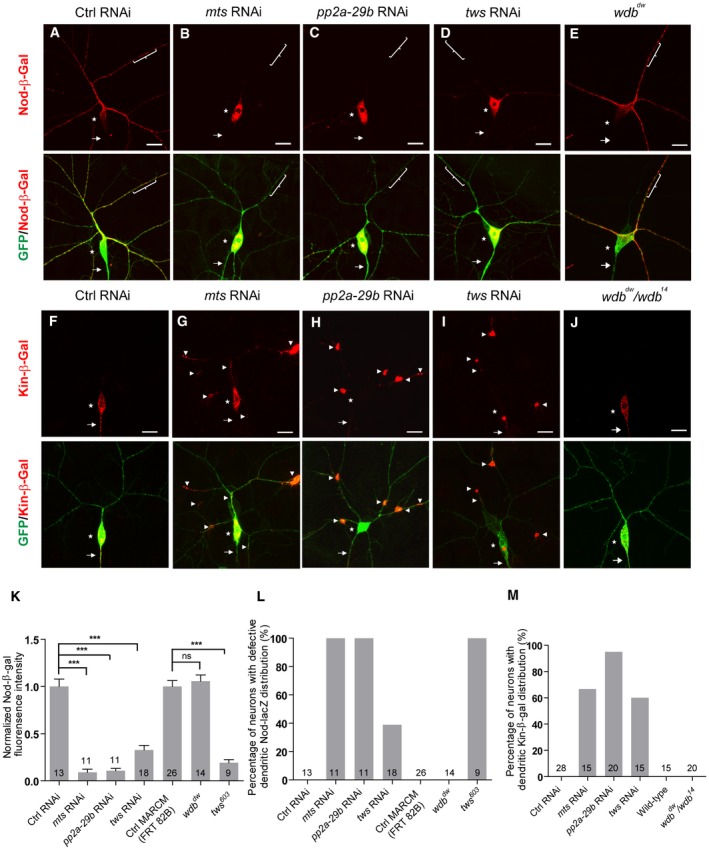
- A–E
Confocal images of ddaC neurons at the wandering 3rd instar (wL3) stage immunostained for anti‐β‐galactosidase. Nod‐β‐gal signals were localized in the dendrites of the ctrl RNAi (A) and wdb dw (E) mutant ddaC neurons; however, Nod‐β‐gal levels were strongly reduced in the dendrites and accumulated in the somas in mts RNAi (B), pp2a‐29b RNAi (C), and tws RNAi (D) ddaC neurons. ddaC somas are marked by asterisks, axons by arrows, and dendrites used for analyzing by curly brackets.
- F–J
Kin‐β‐gal was mislocalized to the dendrites in mts RNAi (G), pp2a‐29b RNAi (H), tws RNAi (I), and wdb dw/ wdb 14 (J) mutant ddaC neurons, compared to the ctrl RNAi neurons (F), while the localization of Kin‐β‐gal in wdb dw/ wdb 14 mutant (J) is normal. ddaC somas are marked by asterisks, axons by arrows, and white arrowheads point to dendritic Kin‐β‐gal signals.
- K
Quantification of normalized Nod‐β‐gal fluorescence intensity in dendrites ofddaC neurons.
- L, M
Quantification of the percentage of neurons with defective Nod‐β‐gal and Kin‐β‐gal distribution in ddaC neurons.
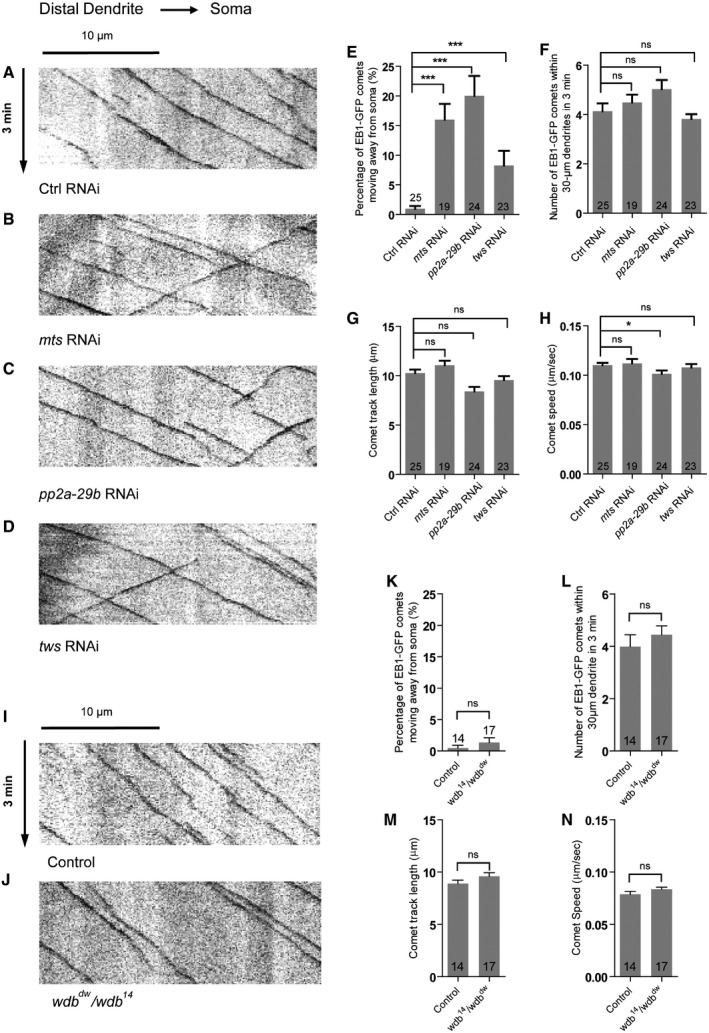
- A–D
Representative kymographs depicting the movement patterns of EB1 comets in the proximal dendrites of ddaC neurons at 96 h AEL. In control RNAi (A) ddaC dendrites, EB1‐GFP comets predominantly moved toward the somas (retrograde). However, in mts RNAi (B), pp2a‐29b RNAi (C), and tws RNAi (D) ddaC dendrite branches, some EB1‐GFP comets moved away from the somas (anterograde).
- E–H
Quantitative analyses of the percentages of anterograde EB1 comets in each neuron imaged (E), the average numbers of EB1‐GFP comets within 30 μm dendrite in 3 min (F), the average comet track length of each neuron (G), and the average comet speed of each neuron (H).
- I, J
Representative kymographs depicting the movement patterns of EB1 comets in the proximal dendrites of ddaC neurons at 96 h AEL. In both control (I) and wdb dw /wdb 14 mutant (J) ddaC dendrites, EB1‐GFP comets predominantly moved toward the somas (retrograde).
- K–N
Quantitative analyses of the percentages of anterograde EB1 comets in each neuron imaged (K), the average numbers of EB1‐GFP comets within 30 μm dendrite in 3 min (L), the average comet track length of each neuron (M), and the average comet speed of each neuron (N).
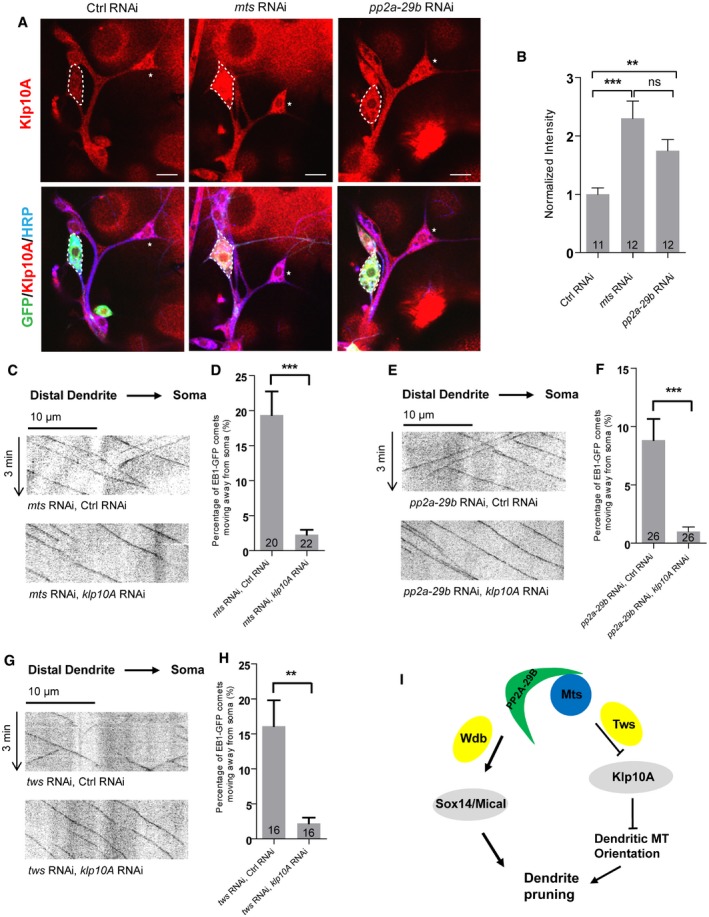
- A
Confocal images of ctrl RNAi, mts RNAi, and pp2a‐29b RNAi ddaC neurons immunostained for Klp10A at wL3 stages. ddaC somas are labeled by dashed lines; ddaE somas are marked by asterisks.
- B
Quantitative analysis of normalized Klp10A fluorescence intensities of ddaC somas.
- C–H
Representative kymographs depicting the movement patterns of EB1 comets in the proximal dendrites of ddaC neurons at 96 h AEL in (C) mts RNAi + ctrl RNAi and mts RNAi + klp10a RNAi; (E) pp2a‐29b RNAi + ctrl RNAi and pp2a‐29b RNAi + klp10a RNAi; and (G) tws RNAi + control RNAi and tws RNAi + klp10a RNAi. (D, F, H) Quantitative analyses of the percentages of anterograde EB1 comets in ddaC neurons.
- I
A possible model. PP2A, via Wdb, regulates ddaC dendritepruning through the expression of Sox14 and Mical, whereas PP2A, via Tws, regulates dendritic MT polarity via suppressing the Klp10A levels.
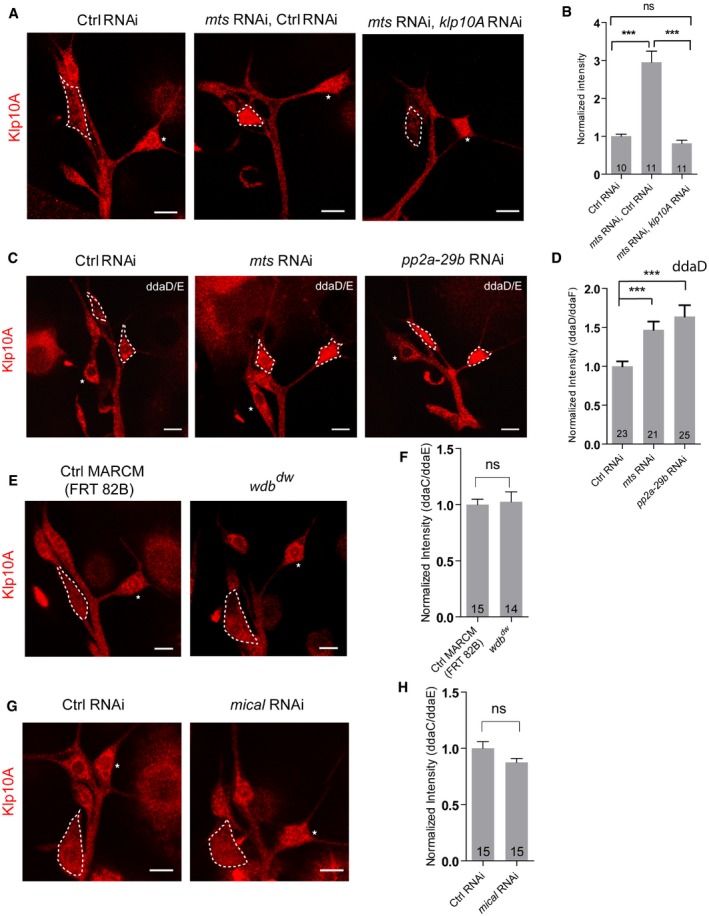
- A–H
Confocal images of ddaC neurons of (A) ctrl RNAi, mts RNAi + control RNAi and mts RNAi + klp10a RNAi; (C) ctrl RNAi, mts RNAi and pp2a‐29b RNAi; (E) ctrl MARCM and wdb dw MARCM; and (G) ctrl RNAi and mical RNAi. All were immunostained for Klp10A at wL3 stage. ddaC (A, E, G) and ddaD/E (C) somas are labeled by dashed lines, and ddaE somas (A, E, G) are marked by asterisks. ddaC (A, E, G) and ddaD/E (C) neurons were identified by the mCD8::GFP expression driven by ppk‐Gal4 and Gal4 2‐21‐driven, respectively. (B, D, F, H) Quantitative analysis of normalized Klp10A fluorescence intensities of ddaC or ddaD somas.
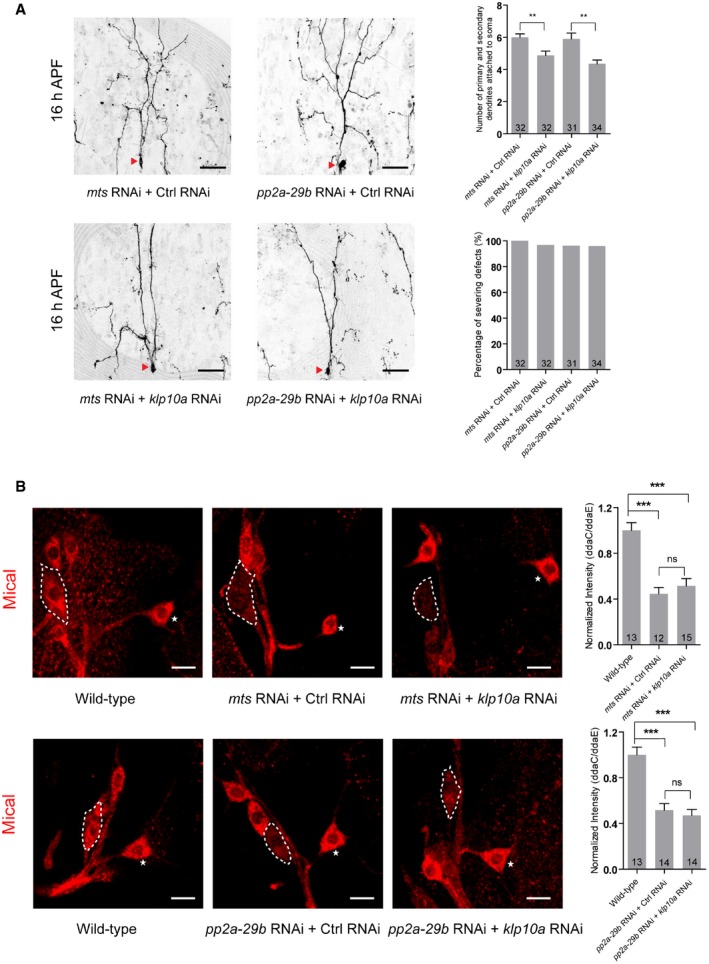
Live confocal images of ddaC neurons expressing mCD8‐GFP driven by ppk‐Gal4 at 16 h APF stage. Dendrites of mts RNAi + Ctrl RNAi, mts RNAi + klp10a RNAi, pp2a‐29b RNAi + Ctrl RNAi, and pp2a‐29b RNAi + klp10a RNAi ddaC neurons at 16 h APF stage. Red arrowheads point to the ddaC somas. Quantification of number of primary and secondary dendrites attached to soma and percentage of severing defects at 16 h APF (rightest panels).
Confocal images of ddaC neurons of wild‐type, mts RNAi + Ctrl RNAi, mts RNAi + klp10a RNAi, wild‐type, pp2a‐29b RNAi + Ctrl RNAi, and pp2a‐29b RNAi + klp10a RNAi that were immunostained for Mical at WP stage. Quantitative analyses of normalized Mical fluorescence (rightest panels). ddaC somas are labeled by dashed lines, and ddaE somas are marked by asterisks.
Similar articles
-
Recent progress in dendritic pruning of Drosophila C4da sensory neurons.Open Biol. 2024 Jul;14(7):240059. doi: 10.1098/rsob.240059. Epub 2024 Jul 24. Open Biol. 2024. PMID: 39046196 Free PMC article. Review.
-
Patronin governs minus-end-out orientation of dendritic microtubules to promote dendrite pruning in Drosophila.Elife. 2019 Mar 28;8:e39964. doi: 10.7554/eLife.39964. Elife. 2019. PMID: 30920370 Free PMC article.
-
A microtubule polymerase is required for microtubule orientation and dendrite pruning in Drosophila.EMBO J. 2020 May 18;39(10):e103549. doi: 10.15252/embj.2019103549. Epub 2020 Apr 8. EMBO J. 2020. PMID: 32267553 Free PMC article.
-
PP2A phosphatase is required for dendrite pruning via actin regulation in Drosophila.EMBO Rep. 2020 May 6;21(5):e48870. doi: 10.15252/embr.201948870. Epub 2020 Mar 24. EMBO Rep. 2020. PMID: 32207238 Free PMC article.
-
Spatiotemporal regulation of developmental neurite pruning: Molecular and cellular insights from Drosophila models.Neurosci Res. 2021 Jun;167:54-63. doi: 10.1016/j.neures.2020.11.010. Epub 2020 Dec 10. Neurosci Res. 2021. PMID: 33309868 Review.
Cited by
-
Live Cell Imaging to Monitor Axonal Pruning in Drosophila Motor Neurons.Bio Protoc. 2025 Jul 5;15(13):e5367. doi: 10.21769/BioProtoc.5367. eCollection 2025 Jul 5. Bio Protoc. 2025. PMID: 40655413 Free PMC article.
-
Recent progress in dendritic pruning of Drosophila C4da sensory neurons.Open Biol. 2024 Jul;14(7):240059. doi: 10.1098/rsob.240059. Epub 2024 Jul 24. Open Biol. 2024. PMID: 39046196 Free PMC article. Review.
-
Multiple pools of PP2A regulate spindle assembly, kinetochore attachments and cohesion in Drosophila oocytes.J Cell Sci. 2021 Jul 15;134(14):jcs254037. doi: 10.1242/jcs.254037. Epub 2021 Jul 23. J Cell Sci. 2021. PMID: 34297127 Free PMC article.
-
The GARP complex prevents sterol accumulation at the trans-Golgi network during dendrite remodeling.J Cell Biol. 2023 Jan 2;222(1):e202112108. doi: 10.1083/jcb.202112108. Epub 2022 Oct 14. J Cell Biol. 2023. PMID: 36239632 Free PMC article.
-
Glial-derived TNF/Eiger signaling promotes somatosensory neurite sculpting.Cell Mol Life Sci. 2025 Jan 21;82(1):47. doi: 10.1007/s00018-024-05560-1. Cell Mol Life Sci. 2025. PMID: 39833565 Free PMC article.
References
-
- Luo L, O'Leary DD (2005) Axon retraction and degeneration in development and disease. Annu Rev Neurosci 28: 127–156 - PubMed
-
- O'Leary DD, Koester SE (1993) Development of projection neuron types, axon pathways, and patterned connections of the mammalian cortex. Neuron 10: 991–1006 - PubMed
-
- Truman JW (1990) Metamorphosis of the central nervous system of Drosophila . J Neurobiol 21: 1072–1084 - PubMed
-
- Lichtman JW, Colman H (2000) Synapse elimination and indelible memory. Neuron 25: 269–278 - PubMed
-
- Kanamori T, Togashi K, Koizumi H, Emoto K (2015) Dendritic remodeling: lessons from invertebrate model systems. Int Rev Cell Mol Biol 318: 1–25 - PubMed
Publication types
MeSH terms
Substances
Grants and funding
LinkOut - more resources
Full Text Sources
Molecular Biology Databases
