

Endothelial Notch signaling controls insulin transport in muscle
- PMID: 32187826
- PMCID: PMC7136962
- DOI: 10.15252/emmm.201809271
Endothelial Notch signaling controls insulin transport in muscle
Abstract
The role of the endothelium is not just limited to acting as an inert barrier for facilitating blood transport. Endothelial cells (ECs), through expression of a repertoire of angiocrine molecules, regulate metabolic demands in an organ-specific manner. Insulin flux across the endothelium to muscle cells is a rate-limiting process influencing insulin-mediated lowering of blood glucose. Here, we demonstrate that Notch signaling in ECs regulates insulin transport to muscle. Notch signaling activity was higher in ECs isolated from obese mice compared to non-obese. Sustained Notch signaling in ECs lowered insulin sensitivity and increased blood glucose levels. On the contrary, EC-specific inhibition of Notch signaling increased insulin sensitivity and improved glucose tolerance and glucose uptake in muscle in a high-fat diet-induced insulin resistance model. This was associated with increased transcription of Cav1, Cav2, and Cavin1, higher number of caveolae in ECs, and insulin uptake rates, as well as increased microvessel density. These data imply that Notch signaling in the endothelium actively controls insulin sensitivity and glucose homeostasis and may therefore represent a therapeutic target for diabetes.
Keywords: Notch signaling; caveolae; endothelial cell; insulin transport; muscle.
© 2020 The Authors. Published under the terms of the CC BY 4.0 license.
Conflict of interest statement
The authors declare that they have no conflict of interest.
Figures
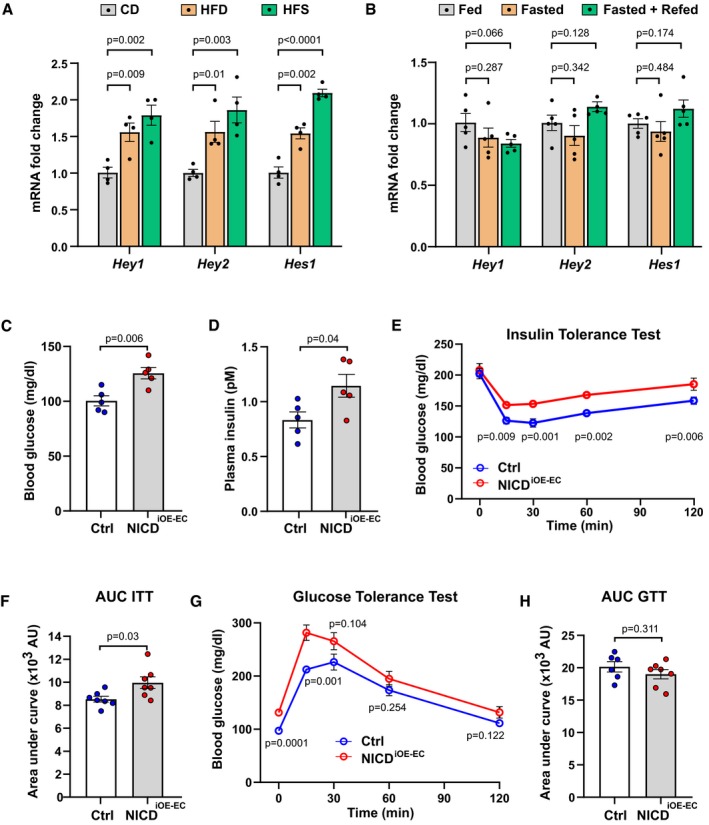
- A
Expression of endothelial Notch target genes in microvascular endothelial cells isolated from skeletal muscle of mice kept on control diet (CD, 10% fat, 70% carbohydrates) or high‐fat diet (HFD, 60% fat, 20% carbohydrates) or high‐fat and sugar diet (HFS, 60% fat, 20% carbohydrates, and 42 g/l sucrose in drinking water). n = 4, data represent mean ± SEM, unpaired t‐test.
- B
Expression of endothelial Notch target genes in microvascular endothelial cells isolated from skeletal muscle of mice fasted for 24 h (Fasted group) and then refed for 4 h (Fasted + Refed group) normalized to mice fed for 24 h (Fed group). n = 5, data represent mean ± SEM, unpaired t‐test.
- C
Blood glucose levels of control (n = 5) and NICDiOE‐EC (n = 5) mice 5 weeks after recombination. Data represent mean ± SEM, unpaired t‐test.
- D
Plasma insulin levels of control (n = 5) and NICDiOE‐EC (n = 5) mice 5 weeks after recombination. Data represent mean ± SEM, Welch's t‐test.
- E
Blood glucose levels for insulin tolerance test of control (n = 7) and NICDiOE‐EC control (n = 7) mice. Data represent mean ± SEM, unpaired t‐test.
- F
Quantification of area under curve for insulin tolerance test in (E). Data represent mean ± SEM, Welch's t‐test.
- G
Blood glucose levels for glucose tolerance test of control (n = 6) or NICDiOE‐EC (n = 7) mice. Data represent mean ± SEM, unpaired t‐test.
- H
Quantification of area under the curve for glucose tolerance test in (G). Data represent mean ± SEM, unpaired t‐test.
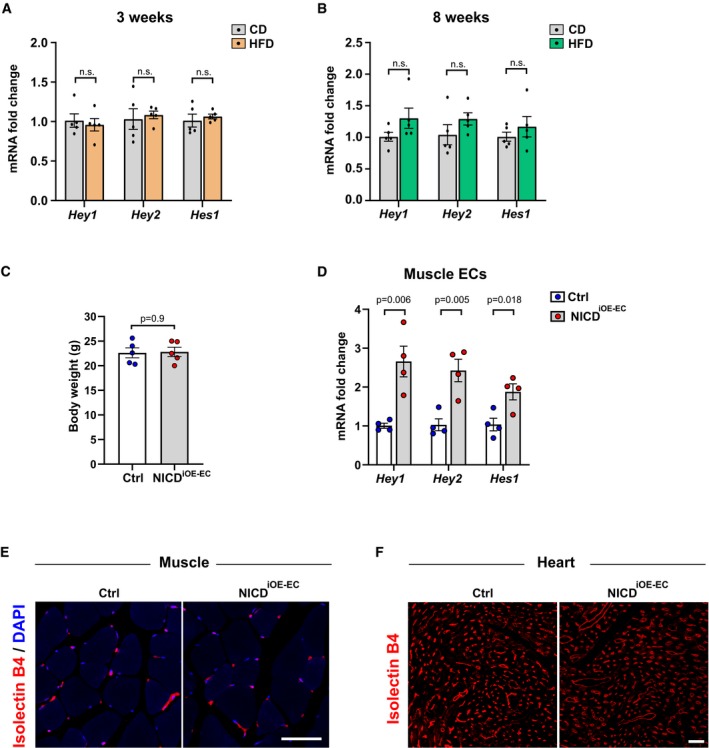
- A, B
Expression of endothelial Notch target genes in microvascular endothelial cells isolated from skeletal muscle of mice kept on control diet (CD, 10% fat, 70% carbohydrates) or high‐fat diet (HFD, 60% fat, 20% carbohydrates) for 3 weeks (A) and 8 weeks (B). n = 5, data represent mean ± SEM, unpaired t‐test.
- C
Body mass of control (n = 5) or NICDiOE‐EC (n = 5) mice 7 weeks after tamoxifen injection. Data represent mean ± SEM, unpaired t‐test.
- D
Expression of Notch target genes in primary microvascular ECs freshly isolated from skeletal muscle of NICDiOE‐EC mice compared to control mice. n = 4, data represent mean ± SEM, unpaired t‐test.
- E
Representative confocal images of isolectin B4‐stained blood vessels (red) in skeletal muscle of NICDiOE‐EC mice and littermate controls 5 weeks after tamoxifen injection. Scale bar 50 μm.
- F
Representative confocal images of isolectin B4‐stained blood vessels (red) in cardiac muscle of NICDiOE‐EC mice and littermate controls 5 weeks after tamoxifen injection. Scale bar 30 μm.
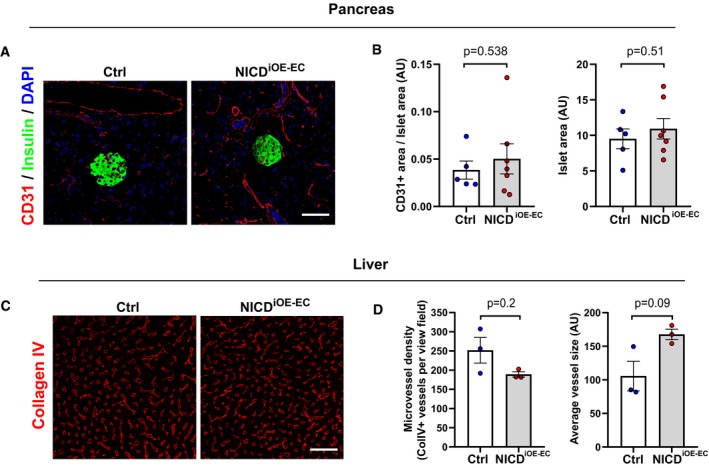
- A
Representative confocal images showing CD31+ blood vessels (red) and insulin‐positive (green) islets in pancreas sections from NICDiOE‐EC mice and littermate controls 5 weeks after tamoxifen injection. Scale bar 50 μm.
- B
Quantification of blood vessel and islet area in control (n = 5) and NICDiOE‐EC (n = 7) mice. Data represent mean ± SEM, unpaired t‐test.
- C
Representative confocal images showing collagen IV+ blood vessels (red) in liver sections from NICDiOE‐EC mice and littermate controls 5 weeks after tamoxifen injection. Scale bar 50 μm.
- D
Quantification of microvessel density and average vessel size in control (n = 3) and NICDiOE‐EC (n = 3) mice. Data represent mean ± SEM, Mann–Whitney, and Welch's t‐test.
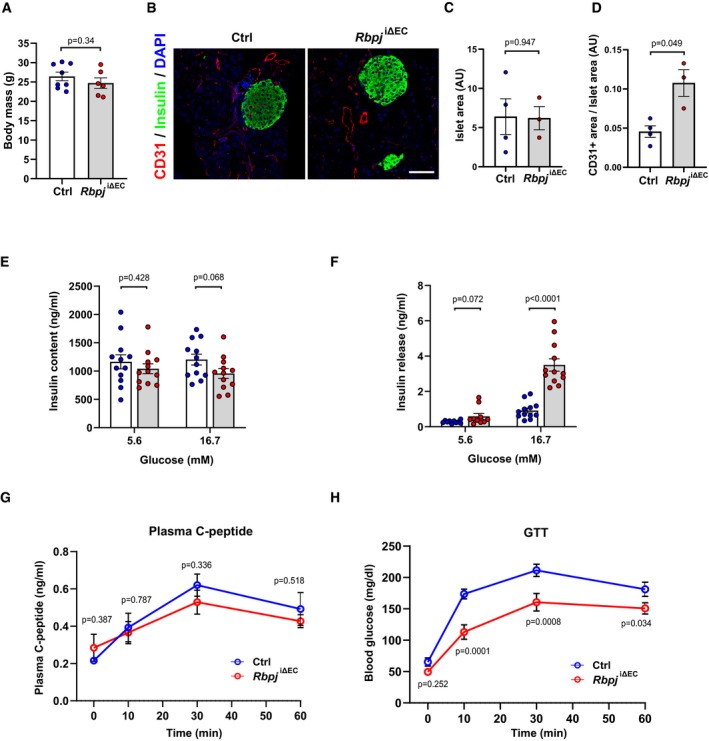
- A
Body mass of control (n = 8) or Rbpj iΔEC (n = 6) mice 7 weeks after tamoxifen injection. Data represent mean ± SEM, unpaired t‐test.
- B
Representative confocal images showing CD31+ blood vessels (red) and insulin‐positive (green) islets in pancreas sections from Rbpj iΔEC mice and littermate controls 6 weeks after tamoxifen injection. Scale bar 50 μm.
- C, D
Quantification of islet area (C) and blood vessel area (D) in control (n = 4) and Rbpj iΔEC (n = 3) mice. Data represent mean ± SEM, Welch's t‐test.
- E, F
Total insulin content (E) and ex vivo glucose stimulated insulin secretion (F) from pancreatic islets isolated from control (n = 5) and Rbpj iΔEC (n = 4) mice. Data represent mean ± SEM, unpaired t‐test.
- G, H
Plasma C‐peptide levels (G) and blood glucose levels (H) in control and Rbpj iΔEC mice after glucose stimulation. n = 4, data represent mean ± SEM, unpaired t‐test.
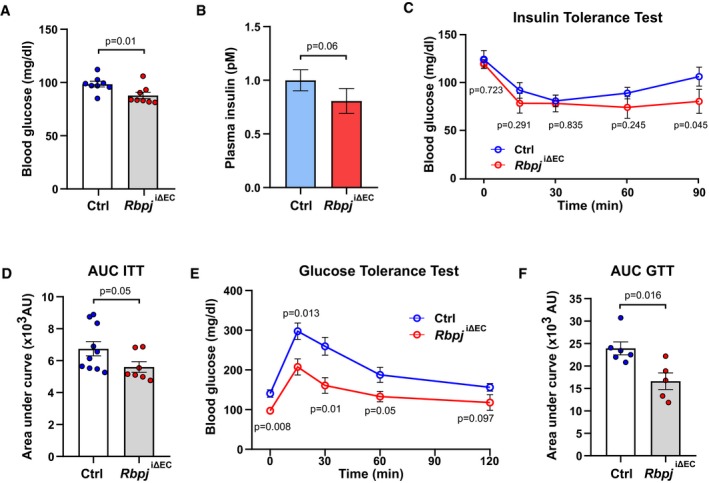
- A
Blood glucose levels of control (n = 8) and Rbpj i∆EC (n = 8) mice 5 weeks after recombination. Data represent mean ± SEM, unpaired t‐test.
- B
Plasma insulin levels of control (n = 8) and Rbpj i∆EC (n = 8) mice 5 weeks after recombination. Data represent mean ± SEM, unpaired t‐test.
- C
Blood glucose levels for insulin tolerance test of control (n = 10) and Rbpj i∆EC (n = 7) mice. Data represent mean ± SEM, unpaired t‐test.
- D
Quantification of area under curve for insulin tolerance test in (C). Data represent mean ± SEM, Welch's t‐test.
- E
Blood glucose levels for glucose tolerance test of control (n = 6) or Rbpj iΔEC (n = 5) mice. Data represent mean ± SEM, unpaired t‐test.
- F
Quantification of area under the curve for glucose tolerance test in (E). Data represent mean ± SEM, Welch's t‐test.
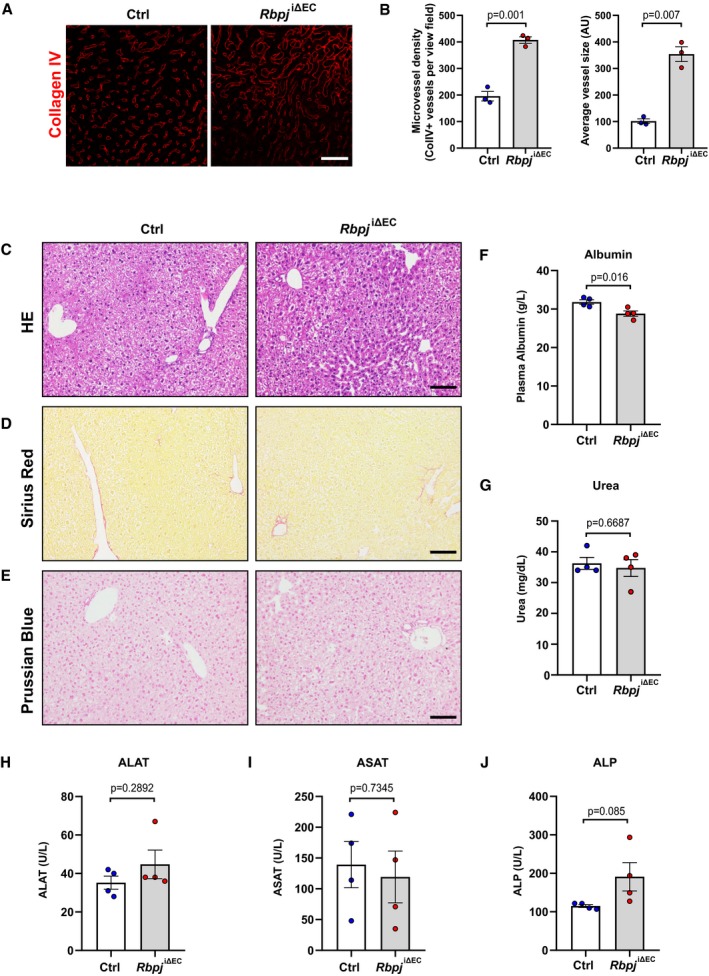
- A
Representative confocal images showing collagen IV+ blood vessels (red) in liver sections from Rbpj iΔEC mice and littermate controls 6 weeks after tamoxifen injection. Scale bar 50 μm.
- B
Quantification of microvessel density and average vessel size in control (n = 3) and Rbpj iΔEC (n = 3) mice. Data represent mean ± SEM, Welch's t‐test.
- C–E
Representative images of hematoxylin and eosin (H&E) (C), Sirius red (D), and Prussian blue (E) staining of liver sections from control and NICDiOE‐EC mice. n = 4, scale bar 100 μm.
- F, G
Plasma levels of albumin (F) and urea (G) in control and Rbpj iΔEC mice. n = 4, data represent mean ± SEM, unpaired t‐test.
- H–J
Plasma levels of alanine aminotransferase (ALAT) (H), aspartate aminotransferase (ASAT) (I), and alkaline phosphatase (ALP) (J) in control and Rbpj iΔEC mice. n = 4, data represent mean ± SEM, unpaired t‐test.
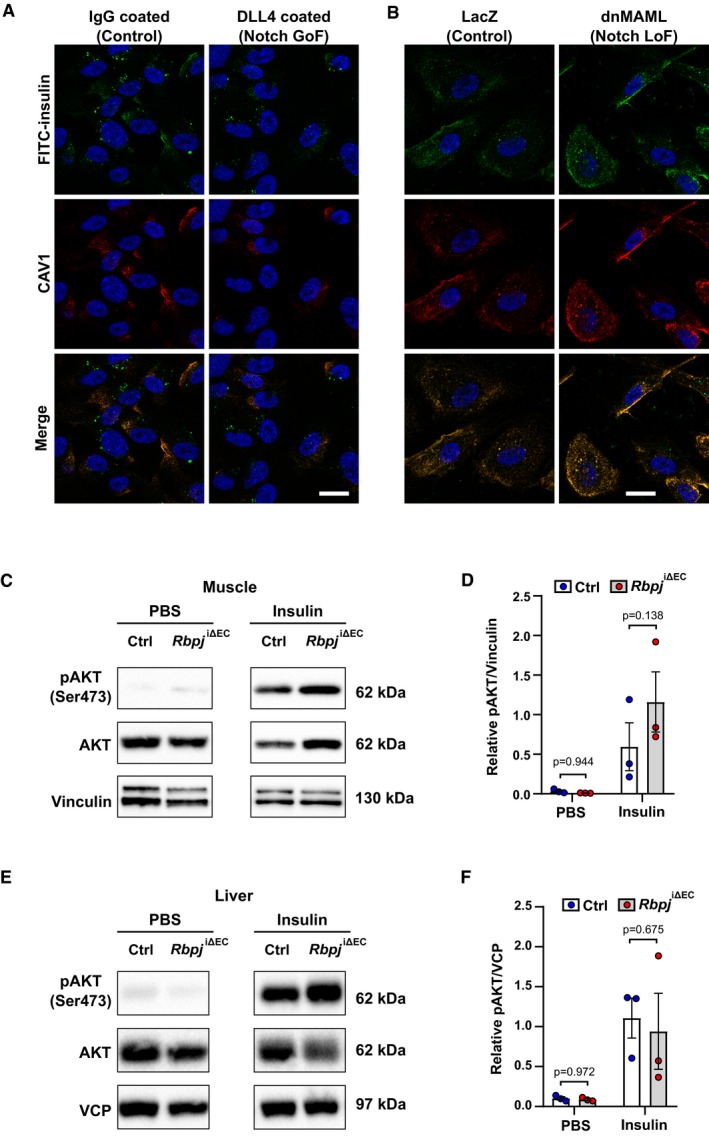
- A
Uptake of FITC insulin and CAV1 expression in primary human umbilical venous ECs (HUVECs) upon Notch induction. Scale bar 20 μm.
- B
Uptake of FITC insulin and CAV1 expression in (HUVECs) upon Notch blockage. Scale bar 20 μm.
- C
Representative Western blot of AKT phosphorylation in gastrocnemius muscle 7 min after intravenous injection of PBS or 1.5 U/kg insulin in control (n = 3) and Rbpj i∆EC (n = 3) mice 5 weeks after recombination.
- D
Densitometric analysis of Western blot in (C). n = 3, data represent mean ± SEM, unpaired t‐test.
- E
Representative Western blot of AKT phosphorylation in liver 7 min after intravenous injection of PBS or 1.5 U/kg insulin in control (n = 3) and Rbpj i∆EC (n = 3) mice 5 weeks after recombination.
- F
Densitometric analysis of Western blot in (E). n = 3, data represent mean ± SEM, unpaired t‐test.
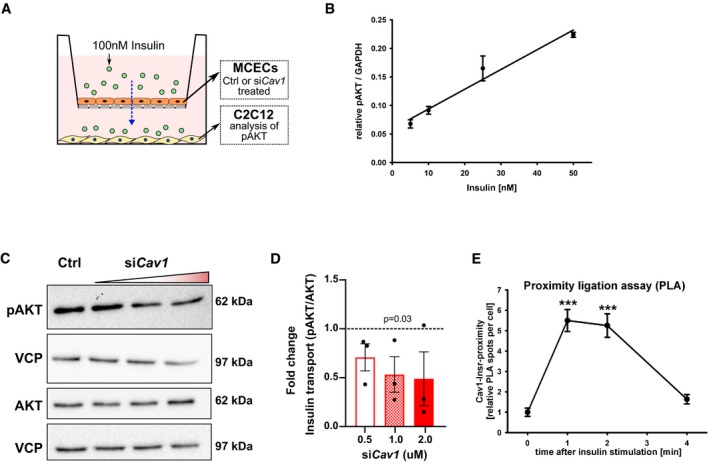
- A
Schematic representation of experimental setup for trans‐endothelial insulin transport assay.
- B
AKT phosphorylation in myogenic C2C12 cells treated with different doses of insulin. n = 3, data represent mean ± SEM, unpaired t‐test.
- C
Representative Western blot of AKT phosphorylation in C2C12 cells upon Cav1 knockdown in mouse cardiac endothelial cells (MCECs).
- D
Densitometric analysis of Western blot in (C). Data represented as fold change over control. n = 3, data represent mean ± SEM, unpaired t‐test.
- E
Proximity ligation assay showing the association of CAV1 and INSR (insulin receptor) in MCECs upon stimulation with insulin. n = 86–120 cells from 8 microscopic high power fields per time point, data represent mean ± SEM, unpaired t‐test, *** means P < 0.001.
- A
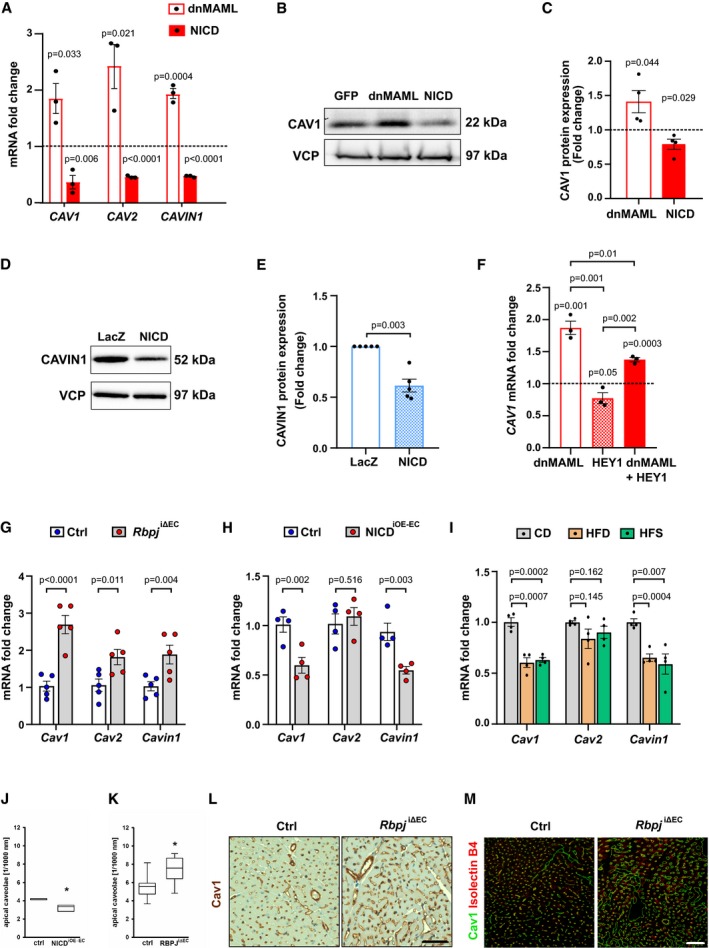
Quantitative RT–PCR detection of CAV1, CAV2, and CAVIN1 in primary human umbilical venous endothelial cells (HUVECs) upon Notch blockade (dnMAML) and induction (NICD). n = 3, data represent mean ± SEM, unpaired t‐test.
- B
Representative Western blot of CAV1 expression in HUVECs upon Notch manipulation.
- C
Densitometric analysis of Western blot in (B). Data represented as fold change over GFP control. n = 3, data represent mean ± SEM, unpaired t‐test.
- D
Representative Western blot of CAVIN1 expression in HUVECs upon Notch induction.
- E
Densitometric analysis of Western blot in (D). Data represented as fold change over LacZ control. n = 5, data represent mean ± SEM, unpaired t‐test.
- F
Expression of CAV1 in HUVECs upon Notch manipulation and HEY1 induction. n = 3, data represent mean ± SEM, unpaired t‐test.
- G
Expression of Cav1, Cav2, Cavin1 in primary microvascular ECs freshly isolated from skeletal muscle of Rbpj iΔEC mice compared to control mice. n = 5, data represent mean ± SEM, unpaired t‐test.
- H
Expression of Cav1, Cav2, Cavin1 in primary microvascular ECs freshly isolated from skeletal muscle of NICDiOE‐EC mice compared to control mice. n = 4, data represent mean ± SEM, unpaired t‐test.
- I
Expression of Cav1, Cav2, Cavin1 in microvascular endothelial cells isolated from skeletal muscle of mice kept on control diet (CD, 10% fat, 70% carbohydrates) or high‐fat diet (HFD, 60% fat, 20% carbohydrates) or high‐fat and sugar diet (HFS, 60% fat, 20% carbohydrates, and 42 g/l sucrose in drinking water). n = 4, data represent mean ± SEM, unpaired t‐test.
- J, K
Quantification of number of caveolae attached to apical membrane in EC of cardiac capillaries from (J) NICDiOE‐EC mice (6 segments of 1,000 nm length from 3 hearts per genotype) or (J) Rbpj iΔEC (6 segments of 1,000 nm length from 8 hearts per genotype) based on electron microscopy. Box plot depicts median and percentiles (10th, 25th, 75th, 90th), unpaired t‐test, * means P < 0.05.
- L, M
Representative immunohistochemistry (L) and confocal images (M) of Cav1 staining in heart sections from control and Rbpj iΔEC mice. n = 3, scale bar 50 μm.
- A
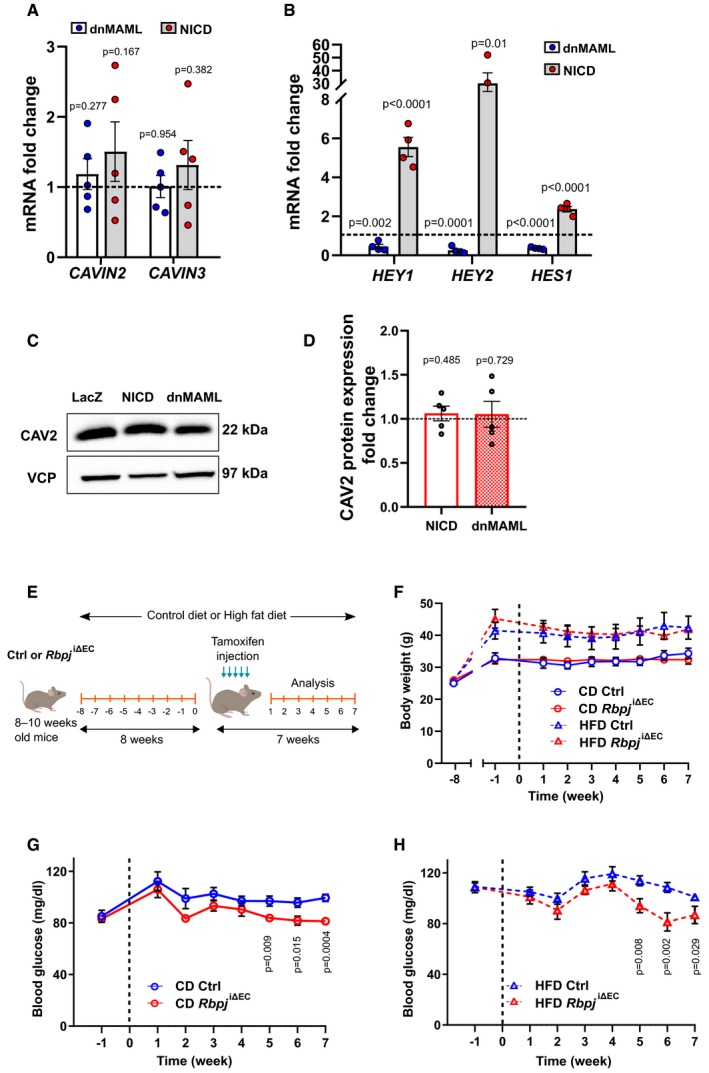
Quantitative RT–PCR detection of CAVIN2 and CAVIN3 in primary human umbilical venous endothelial cells (HUVECs) upon Notch blockade (dnMAML) and induction (NICD). n = 5, data represent mean ± SEM, unpaired t‐test.
- B
Expression of HEY1, HEY2, and HES1 in HUVECs upon Notch manipulation. n = 4, data represent mean ± SEM, unpaired t‐test.
- C
Representative Western blot of CAV2 expression in HUVECs upon Notch manipulation.
- D
Densitometric analysis of Western blot in (C). Data represented as fold change over LacZ control. n = 5, data represent mean ± SEM, unpaired t‐test.
- E
Schematic illustration of feeding and recombination protocol.
- F
Weight curve of control or Rbpj iΔEC mice kept on control diet (CD, 10% fat, 70% carbohydrates) or high‐fat diet (HFD, 60% fat, 20% carbohydrates). n = 4 control CD, n = 5 Rbpj iΔEC CD, n = 6 control HFD, n = 4 Rbpj iΔEC HFD, data represent mean ± SEM.
- G
Blood glucose levels of control (n = 9) or Rbpj iΔEC (n = 9) mice kept on CD. Data represent mean ± SEM, unpaired t‐test.
- H
Blood glucose levels of control (n = 11) or Rbpj iΔEC (n = 10) mice kept on HFD. Data represent mean ± SEM, unpaired t‐test.
- A
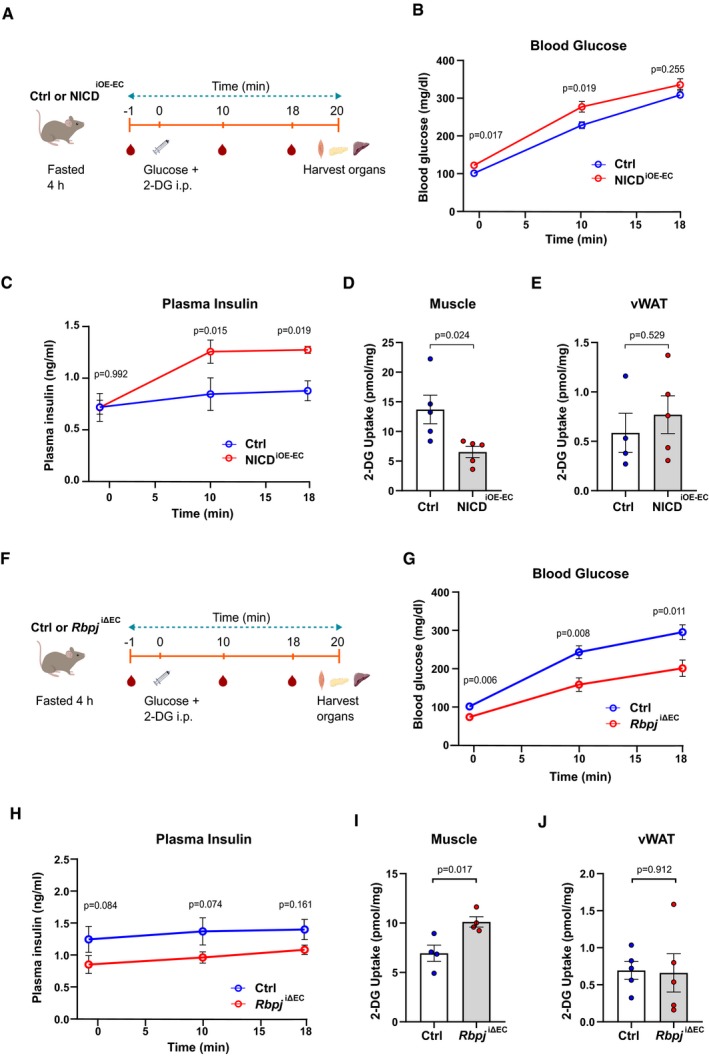
Schematic illustration of 2‐DG uptake assay protocol for control and NICDiOE‐EC mice.
- B
Blood glucose levels of control and NICDiOE‐EC mice during the 2‐DG uptake assay. n = 5, data represent mean ± SEM, unpaired t‐test.
- C
Plasma insulin levels of control and NICDiOE‐EC mice during the 2‐DG uptake assay. n = 5, data represent mean ± SEM, unpaired t‐test.
- D
2‐DG uptake levels in skeletal muscle of control and NICDiOE‐EC mice. n = 5, data represent mean ± SEM, unpaired t‐test.
- E
2‐DG uptake levels in visceral white adipose tissue (vWAT) of control (n = 4) and NICDiOE‐EC (n = 5) mice. Data represent mean ± SEM, unpaired t‐test.
- F
Schematic illustration of 2‐DG uptake assay protocol for control and Rbpj iΔEC mice.
- G
Blood glucose levels of control and Rbpj iΔEC mice during the 2‐DG uptake assay. n = 5, data represent mean ± SEM, unpaired t‐test.
- H
Plasma insulin levels of control and Rbpj iΔEC mice during the 2‐DG uptake assay. n = 5, data represent mean ± SEM, unpaired t‐test.
- I
2‐DG uptake levels in skeletal muscle of control and Rbpj iΔEC mice. n = 4, data represent mean ± SEM, unpaired t‐test.
- J
2‐DG uptake levels in vWAT of control and Rbpj iΔEC mice. n = 5, data represent mean ± SEM, unpaired t‐test.
- A
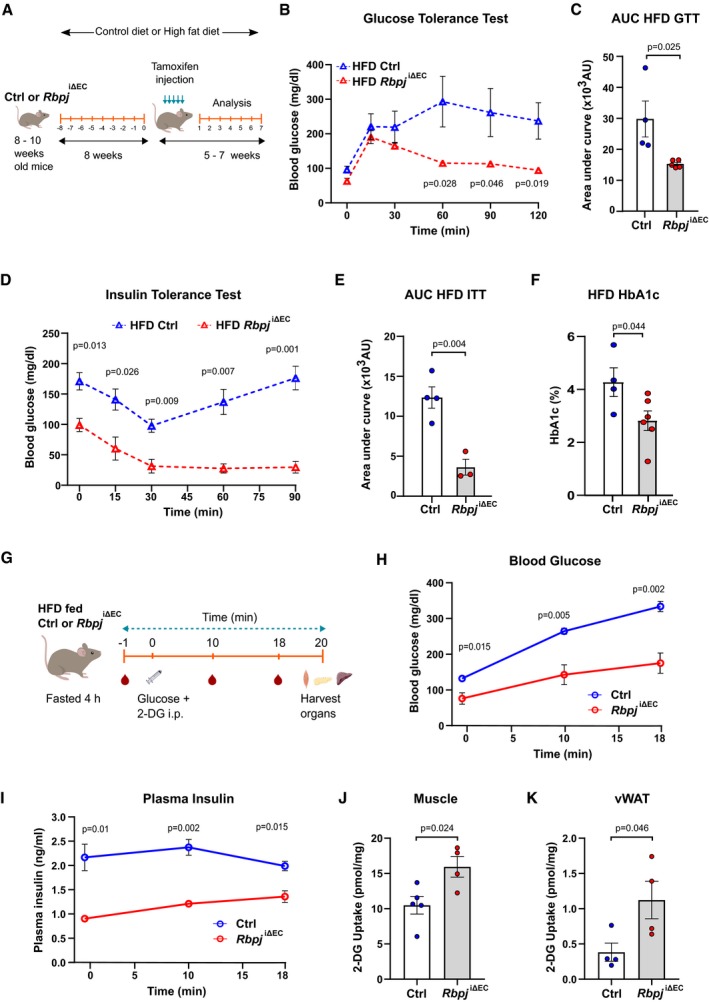
Schematic illustration of feeding and recombination protocol.
- B
Blood glucose levels for glucose tolerance test (GTT) of control (n = 4) or Rbpj iΔEC (n = 5) mice kept on high‐fat diet (HFD). Data represent unpaired t‐test, mean ± SEM.
- C
Quantification of area under curve (AUC) for GTT in (B). Data represent mean ± SEM, unpaired t‐test.
- D
Blood glucose levels for insulin tolerance test (ITT) of control (n = 4) or Rbpj iΔEC (n = 3) mice kept on HFD. Data represent unpaired t‐test, mean ± SEM.
- E
Quantification of AUC for ITT in (D). Data represent mean ± SEM, unpaired t‐test.
- F
HbA1c levels of control (n = 4) or Rbpj iΔEC (n = 6) mice kept on HFD 7 weeks after recombination. Data represent mean ± SEM, unpaired t‐test.
- G
Schematic illustration of 2‐DG uptake assay protocol for control and Rbpj iΔEC mice on HFD.
- H
Blood glucose levels of control and Rbpj iΔEC mice on HFD during 2‐DG uptake assay. n = 5, data represent mean ± SEM, unpaired t‐test.
- I
Plasma insulin levels of control and Rbpj iΔEC mice on HFD during 2‐DG uptake assay. n = 5, data represent mean ± SEM, unpaired t‐test.
- J
2‐DG uptake levels in skeletal muscle of control (n = 5) and Rbpj iΔEC (n = 4) mice on HFD. Data represent mean ± SEM, unpaired t‐test.
- K
2‐DG uptake levels in vWAT of control and Rbpj iΔEC mice. n = 4, data represent mean ± SEM, unpaired t‐test.
References
Publication types
MeSH terms
Substances
Grants and funding
- FI 1569/3-1/Deutsche Forschungsgemeinschaft (DFG)/International
- SFB1366 (project C4 and B3)/Deutsche Forschungsgemeinschaft (DFG)/International
- 394046768/Deutsche Forschungsgemeinschaft (DFG)/International
- SFB1118/Deutsche Forschungsgemeinschaft (DFG)/International
- SFB1123/Deutsche Forschungsgemeinschaft (DFG)/International
LinkOut - more resources
Full Text Sources
Medical
