Editorial
. 2020 Apr;97(4):340-343.
doi: 10.1002/cyto.a.24002. Epub 2020 Mar 18.

SARS-CoV-2, the Virus that Causes COVID-19: Cytometry and the New Challenge for Global Health

Affiliations
Editorial

SARS-CoV-2, the Virus that Causes COVID-19: Cytometry and the New Challenge for Global Health

Andrea Cossarizza et al. Cytometry A. 2020 Apr.
No abstract available

Keywords: CD4; CD8; Covid-19; SARS-CoV-2; T cells; coronavirus; cytometry.


Figures
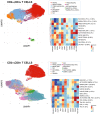
Figure 1
Figure 1
Differentiation, activation and exhaustion of CD4+ or CD8+ T‐cell subsets in patients with Covid‐19. Representation of an 18‐parameter analysis of peripheral blood cells. Cells were stained with the Duraclone IM T cell panel (from Beckman Coulter, FL, USA) added with another five fluorescent mAbs and a marker of cell viability and analyzed on a CytoFLEX LX flow cytometer (Beckman Coulter). Beside side and forward scatters, markers were CD45 conjugated with Krome Orange, CD3 APC‐A750, CD4 APC, CD8 AF700, CD27 PC7, CD57 Pacific Blu, CD279 (PD‐1) PC5.5, CD28 ECD, CCR7 PE, CD45RA FITC, HLA‐DR BUV661, CD127 BV650, CD25 BV785, CD95 BUV395, CD38 BUV496, and PromoFluor‐840 (Promokine). Unsupervised analysis of electronically gated CD45+, CD3+, CD4+ or CD45+, CD3+, CD8+ T‐cells was first performed by using the Catalyst package (Bioconductor) 16. Second, for both CD4+ and CD8+ T‐cell analysis, 10,000 cells per sample were concatenated and transformed. FlowSOM was used to perform the metaclustering (K = 20); then, data were represented by the dimensionality reduction method named Uniform Manifold Approximation and Projection (UMAP). It is possible to observe the presence of 12 clusters among CD4+ and 13 among CD8+ T‐cells and to see the high amount of naive cells in both T cell populations, and how the distribution of naive, memory, activated and exhausted lymphocytes is different among different types of CD4+ or CD8+ T lymphocytes.

Similar articles

Cited by

References

    1. WHO , Novel coronavirus ‐ China Jan 12, 2020. https://www.who.int/csr/don/12-january-2020-novel-coronavirus-china/en/
    1. Lu R, Zhao X, Li J, Niu P, Yang B, Wu H, Wang W, Song H, Huang B, Zhu N, et al. Genomic characterisation and epidemiology of 2019 novel coronavirus: Implications for virus origins and receptor binding. Lancet 2020;395(10224):565–574. - PMC - PubMed
    1. Huang C, Wang Y, Li X, Ren L, Zhao J, Hu Y, Zhang L, Fan G, Xu J, Gu X, et al. Clinical features of patients infected with 2019 novel coronavirus in Wuhan. China Lancet 2020;395(10223):497–506. - PMC - PubMed
    1. Li Q, Guan X, Wu P, Wang X, Zhou L, Tong Y, Ren R, Leung KSM, Lau EHY, Wong JY, et al. Early transmission dynamics in Wuhan, China, of novel coronavirus‐infected pneumonia. N Engl J Med 2020. 10.1056/NEJMoa2001316. - DOI - PMC - PubMed
    1. Holshue ML, DeBolt C, Lindquist S, Lofy KH, Wiesman J, Bruce H, Spitters C, Ericson K, Wilkerson S, Tural A, et al. First case of 2019 novel coronavirus in the United States. N Engl J Med 2020;382:929–936. 10.1056/NEJMoa2001191. - DOI - PMC - PubMed

Publication types