. 2020 Mar 16;21(6):2016.
doi: 10.3390/ijms21062016.

Affinity-Bead Assisted Mass Spectrometry (Affi-BAMS): A Multiplexed Microarray Platform for Targeted Proteomics

Affiliations

Affinity-Bead Assisted Mass Spectrometry (Affi-BAMS): A Multiplexed Microarray Platform for Targeted Proteomics

Ghaith M Hamza et al. Int J Mol Sci. .

Abstract

The ability to quantitatively probe diverse panels of proteins and their post-translational modifications (PTMs) across multiple samples would aid a broad spectrum of biological, biochemical and pharmacological studies. We report a novel, microarray analytical technology that combines immuno-affinity capture with Matrix Assisted Laser Desorption Ionization Mass Spectrometry (MALDI MS), which is capable of supporting highly multiplexed, targeted proteomic assays. Termed "Affinity-Bead Assisted Mass Spectrometry" (Affi-BAMS), this LC-free technology enables development of highly specific and customizable assay panels for simultaneous profiling of multiple proteins and PTMs. While affinity beads have been used previously in combination with MS, the Affi-BAMS workflow uses enrichment on a single bead that contains one type of antibody, generally capturing a single analyte (protein or PTM) while having enough binding capacity to enable quantification within approximately 3 orders of magnitude. The multiplexing capability is achieved by combining Affi-BAMS beads with different protein specificities. To enable screening of bead-captured analytes by MS, we further developed a novel method of performing spatially localized elution of targets from individual beads arrayed on a microscope slide. The resulting arrays of micro spots contain highly concentrated analytes localized within 0.5 mm diameter spots that can be directly measured using MALDI MS. While both intact proteins and protein fragments can be monitored by Affi-BAMS, we initially focused on applying this technology for bottom-up proteomics to enable screening of hundreds of samples per day by combining the robust magnetic bead-based workflow with the high throughput nature of MALDI MS acquisition. To demonstrate the variety of applications and robustness of Affi-BAMS, several studies are presented that focus on the response of 4EBP1, RPS6, ERK1/ERK2, mTOR, Histone H3 and C-MET to stimuli including rapamycin, H2O2, EPO, SU11274, Staurosporine and Vorinostat.

Keywords: BAMS; MALDI MS; PTMs; bead assisted mass spectrometry; multiplex assays; targeted proteomics.


Conflict of interest statement

The authors declare no conflict of interest. The funders had no role in the design of the study; in the collection, analyses, or interpretation of data; in the writing of the manuscript, or in the decision to publish the results.

Figures

Figure 1
Figure 1
Affi-BAMS Workflow including quantitation via internal standard or SILAC approaches. Affi-BAMS quantification has been validated for robustness and accuracy using traditional mass spectrometry methods: 1) unlabeled, internal-standard (IS) peptides, 2) stable-isotope-labeled internal-standard (SIS) peptides spiked (left panel) and 3) Stable Isotope Labeling with Amino acids in Cell culture (SILAC, right panel). In these workflows, soluble protein is extracted from the biological material and digested with protease into their corresponding peptide fragments. In the internal standard workflow, IS or SIS peptide for the intended target is spiked into the protein digest at a known concentration. Affi-BAMS beads are used to enrich for the corresponding target peptides. Beads are washed and then assembled into an ordered array onto a MALDI slide. The affinity-captured peptide targets are eluted from the beads within each micro-well and deposited onto the microarray slide for MALDI MS acquisition. The MALDI MS spectrum is matched to a reference spectrum for identification of the target protein or protein modification. The MS intensity of the target is then used to determine relative quantitation based on the reference peptide (IS or SIS) or the heavy and light SILAC pairs.
Figure 2
Figure 2
Affi-BAMS Array. An elastomer (Panel A) is used to spatially confine each Affi-BAMS bead within one single well. A MALDI matrix sprayer uniformly delivers aerosolized elution buffer to each of the microwells, throughout the entire slide. Once the elution protocol is complete, an array of co-crystalized targets in MALDI matrix is formed, which is subsequently analyzed by MALDI MS (Panel B). A bright field image of a section of the Affi-BAMS microarray is shown with CHCA matrix spots produced using the aerosol elution method for matrix deposition. The scale bar in the lower right of the image measures 300 microns (Panel C). A magnified image of a single microarray spot is shown to illustrate the uniform coverage and size of CHCA matrix crystals within the spot. The scale bar in the lower right of the image measures 100 microns (Panel D).
Figure 3
Figure 3
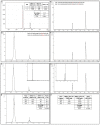
Example validation of 4EBP1 Affi-BAMS Assay. An Affi-BAMS assay for 4EBP1 (total, C-terminus) was performed with untreated MKN45 cell lysate as described in the Methods section. An in silico tryptic digest of 4EBP1 produces the following peptides containing zero and one missed cleavage: 1) R.AGGEESQFEMDI.- and 2) K.RAGGEESQFEMDI.- with S112 highlighted in bold and underlined to emphasize the surrounding region used from the immunizing peptide. The calculated masses (MH+, monoisotopic) for each of the peptides listed above are 1312.536 and 1468.637 m/z (z = 1), respectively. A full scan MALDI MS spectrum (750–7000 m/z) was collected in linear mode from the Affi-BAMS assay for the C-terminus of 4EBP1, showing 1468.80 and 1312.25 (m/z, z = 1) as the two most intense peaks (Panel A). A full scan MALDI MS spectrum (750–7000 m/z) was collected in reflector mode from the same spot of the Affi-BAMS assay for C-terminus 4EBP1, showing 1468.57 (m/z, z = 1) as the most intense peak. An MS/MS spectrum was collected for the most intense peak, 1468.57 (m/z, z = 1), and was searched through Protein Prospector and identified as the K.RAGGEESQFEMDI.- peptide to 4EBP1. In addition, the MALDI MS data has been annotated to highlight the consecutive b-ions (top series) and internal fragment ions (bottom series) for the identified peptide sequence (Panels B). Several examples of ammonia loss are shown with the delta mass of 17 m/z, and addition of water with a delta mass of 18 m/z. The fragment ion at 1453.271 corresponds to the precursor with loss of ammonia. The mass error distribution of the matching fragment ions from the Protein Prospector database search is shown.
Figure 4
Figure 4
Detection of Singly and Doubly Phosphorylated 4EBP1. Control sample was prepared using C18 purified peptides from a tryptic digest (200 µg) of MKN45 cells (untreated). An Affi-BAMS assay for 4EBP1 (pT37 and pT46) was performed as described in the Methods section. An in silico tryptic digest of 4EBP1 produces the following peptides with either a single phosphorylation (at T37 or T46) or dually phosphorylated peptide (at both T37 and T46) with calculated masses (MH+, monoisotopic) for each of the peptides as 3127.498, 3207.465, 3283.599 and 3363.566 m/z (z = 1, MH+), respectively. The data collected from the MALDI MS spectrum shows the following measured peptide masses (interpolated monoisotopic) as 3126.78, 3206.63, 3283.08 and 3363.09 m/z (z = 1, MH+), respectively. These masses represent the 4EBP1 peptides corresponding to the zero and one missed cleavage product, with the one missed cleavage product corresponding to an additional arginine residue at the N-terminus of the resulting tryptic peptide (delta mass of 156.18 m/z). An 80 m/z mass shift is observed for both cleavage products, corresponding to the singly and doubly phosphorylated forms of each tryptic peptide since the antibody displays cross-reactivity with singly phosphorylated pT37 or pT46.
Figure 5
Figure 5
Affi-BAMS Assay for C-MET (pY1234 and pY1235) with SIS Spike. (A) 0 fmoles, (B) 100 fmoles, and (C) 1000 fmoles of SIS peptide in 100 µg of MKN45 tryptic peptide digest. An additional sample was prepared containing only 1000 fmoles of SIS peptide alone, with no MKN45 tryptic peptides (D). The expected mono-isotopic masses for the endogenous and SIS peptides are noted as 1852.815 m/z and 1865.670 m/z, respectively. Endogenous (light) and SIS (heavy) C-MET phosphopeptides for the 1000 (L:H ratio = 0.037) and 100 (L:H ratio = 0.339) fmole spike conditions show agreement with the expected fold-change comparison between the two spiked peptide level conditions (calculated fold-change = 9.24, expected fold-change = 10.0).
Figure 6
Figure 6
Affi-BAMS Assay Reproducibility and Sensitivity. Three replicate Affi-BAMS assays were conducted for ERK1 (pT202 and pY204) and ERK2 (pT185 and pY185) phosphopeptides using a total of 50 µg of trypsin digested soluble protein from HeLa cells treated with 2 mM H2O2 for 20 min (A). The Affi-BAMS assay captures both ERK1 and ERK2 peptides on the same bead to measure both peptides within a single MALDI MS spectrum. The expected monoisotopic masses for the ERK2 and ERK1 peptides are 2303.937 and 2331.968 m/z (z = 1), respectively. In an Affi-BAMS assay with three replicate beads, an average ratio of 13.5 was observed between ERK2 versus ERK1, with a CV of 3.86% among the three calculated ratios. In a separate experiment, an Affi-BAMS assay was performed for ERK1 and ERK2 using a total of 10.0, 4.0 and 2.0 µg of trypsin digested protein (BD). The calculated intensity ratios (ERK2:ERK1) show an average ratio of 11.7 with a CV of 6.0%. (C) shows an inset image of the full scan MALDI MS with little to no background signal from the ERK1/2 Affi-BAMS assay. An Affi-BAMS assay was performed for 4EBP1 (pT37 and pT46) using a total of 10.0, 4.0 and 2.0 µg of trypsin digested protein (EG). The expected monoisotopic masses for the zero and one missed cleavage tryptic peptides for 4EBP1 (pT37 and pT46) are 3207.465 and 3363.566 m/z (z = 1), respectively. The ratio between the zero and one missed cleavage products (1XC:0XC) from each of the three different sample amounts were calculated to be an average of 3.6 with a CV of 23.2% (Panel H). (G) shows an inset image of the full scan MALDI MS with little to no background signal from the 4EBP1 Affi-BAMS assay.
Figure 7
Figure 7
C-MET Inhibition upon ST and SU treatment in MKN45 Cells. MKN45 cells were treated with 0.2 μM Staurosporine (ST, protein kinase C [PKC] inhibitor) or 1.0 μM SU11274 (SU, C-MET inhibitor) for 2 h. The Western blot for dually phosphorylated C-MET (pY1234/pY1235) shows reduction of phosphorylation with ST treatment and a more dramatic decrease with SU treatment, compared to the control (D, DMSO) condition (A). In addition, there is no significant change in the amount of total C-MET among the control and treatment conditions (B). An Affi-BAMS assay for C-MET (pY1234 and pY1235) was conducted on equally combined MKN45 SILAC labeled pairs for both treatments (SU: red and ST: blue) and the corresponding MALDI MS spectrum from each assay is overlaid (normalizing the intensities to the DMSO channel) to illustrate the relative quantification of C-MET upon ST and SU treatment conditions (Panel C). A significant decrease of the dually phosphorylated C-MET is observed upon both treatments. The relative fold-change was calculated from the normalized intensities from the corresponding light (ST or SU) and heavy (DMSO) masses of the affinity captured C-MET peptides. The SU treatment shows greater inhibition (94.17, SU:D) of phosphorylation on C-MET (pY1234 and pY1235) relative than with ST treatment (16.04, ST:D) and is consistent with the results from the Western blot.
Figure 8
Figure 8
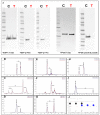
Rapamycin treatment in MKN45 Cells. MKN45 cells were SILAC labeled (light = DMSO, heavy = rapamycin; K + 8 and R + 10) and treated with either DMSO or 1mM rapamycin for 2 h. Western blot for total RPS6 and 4EBP1 show no change in total protein amount; however, a significant inhibition in phosphorylation is observed on both proteins (A,C) = Control [DMSO]; T = Treated [1mM rapamycin]). A multiplexed Affi-BAMS assay was conducted for total and phospho specific sites for mTOR, 4EBP1, AKT1, RPS6, CTNNB1 and BAD (BJ). Mass shift due to the heavy labeling of residues is notated as well as phosphorylation shifts. Raw files were imported into mMass and normalized between replicates on the most intense peak to generate ratios between the replicate light and heavy SILAC pairs. (J) demonstrates the triple- (3), quadruple- (4) and penta- (5) phosphorylated tryptic peptides of RPS6 without (black) and with (blue) missed cleavage.
Figure 9
Figure 9
EPO Challenge in UT7epo-E cells. SILAC labeled UT7epo-E cells (forward labeled [light= -EPO, heavy= +EPO] and reverse labeled [light= +EPO, heavy= -EPO]; K + 8 and R + 10) were challenged with +/- 5U/mL EPO for 15 min. Western blots were conducted to validate target’s response for both light and heavy SILAC labeled cells as well as reverse labeled cells to confirm Affi-BAMS assays’ results (Lt = Light, Hv = Heavy, XX designates empty lane). The MALDI MS spectrum for select targets in the multiplexed Affi-BAMS assay are shown for the forward labeled pair, as well as the western blots for mTOR (Panel A), STAT3 (Panel B), and ERK1/2 (Panel C). The mass shift due to the incorporation of one heavy arginine is noted (+10) as well as the appropriate mass shift for phosphorylation (+80) that are found on the ERK1 and ERK2 peptides (see Table 2 for additional details). The red circles indicate the masses for the singly (labeled “1”) and doubly (labeled “2”) phosphorylated peptides for ERK2. The blue circles indicate the masses for the singly (labeled “1”) and doubly (labeled “2”) phosphorylated peptides for ERK1. Raw files were imported into mMass and normalized between replicates on the most intense peak to generate ratios between the light and heavy SILAC pairs.
Figure 10
Figure 10
Concentration of PCI using SISCAPA. LOD and LOQ for PCI peptide, EDQYHYLLDR, from human plasma was quantified using Affi-BAMS. The first calibration curve, forward curve, was generated by spiking a constant amount of the heavy peptide (1000 fmoles/well) in a background of digested pooled plasma with a serial dilution of synthetic light peptide to generate a 12-point curve, with the light peptide being titrated from 10,000 fmol to 0.17 fmol (3-fold serial dilution; with no synthetic light peptide in the 12th sample). The reverse curve was generated by spiking constant concentration of the light peptide (1000 fmol) and 3-fold dilutions of the heavy peptide (from 10,000 fmol to 0.06 fmol). The LOD (14 fmoles) was defined as the lowest spiked concentration of SIS peptide that was identifiable in at least two of the three replicates in the experiments. The LOQ (41 fmoles) was defined as the lowest concentration of the analyte that was identifiable in at least two of the three replicates and with a CV of < 30%.
Figure 11
Figure 11
Affi-BAMS assay for H3 (K9-acetylation) in U2OS cells upon SAHA treatment. MALDI MS spectra from an Affi-BAMS assay for H3 (K9-acetylation) in U2OS cells upon DMSO control (A, Top) and 5 µM SAHA treatment for 24h (B, bottom). The spectra were normalized against a common H3 derived peptide (MH+ = 1700.398 [blue circle]) and overlaid in mMass to reflect the relative abundance. Delta change of 14, 42 and 80 m/z are observed accounted by the hyper modified regions within H3 (methylation, acetylation and phosphorylation). There is an increase in overall signal compared to the control as well as a shift in higher molecular weight species suggesting an increase in cross talk of PTMs as well as higher order acetylation. An MS/MS was obtained and searched through Protein Prospector to identify two peaks (1740.97 [black triangle] and 1984.28 [red triangle] m/z). The following peptides from H3 were identified: QTARK(Acetyl)STGGK(Acetyl)APRK(Acetyl)Q and TK(Methyl)QTARK(Acetyl)STGGK(Acetyl)APRK(Acetyl)Q, respectively.

Similar articles

Cited by

References

    1. Hedl T.J., San Gil R., Cheng F., Rayner S.L., Davidson J.M., De Luca A., Villalva M.D., Ecroyd H., Walker A.K., Lee A. Proteomics Approaches for Biomarker and Drug Target Discovery in ALS and FTD. Front. Neurosci. 2019;13:548. doi: 10.3389/fnins.2019.00548. - DOI - PMC - PubMed
    1. Meier F., Brunner A.-D., Koch S., Koch H., Lubeck M., Krause M., Goedecke N., Decker J., Kosinski T., Park M.A., et al. Online Parallel Accumulation–Serial Fragmentation (PASEF) with a Novel Trapped Ion Mobility Mass Spectrometer. Mol. Cell. Proteom. 2018;17:2534–2545. doi: 10.1074/mcp.TIR118.000900. - DOI - PMC - PubMed
    1. Levy M.J., Washburn M.P., Florens L. Probing the Sensitivity of the Orbitrap Lumos Mass Spectrometer Using a Standard Reference Protein in a Complex Background. J. Proteom. Res. 2018;17:3586–3592. doi: 10.1021/acs.jproteome.8b00269. - DOI - PMC - PubMed
    1. Chan P.P., Wasinger V.C., Leong R.W. Current application of proteomics in biomarker discovery for inflammatory bowel disease. World J. Gastrointest. Pathophysiol. 2016;7:27–37. doi: 10.4291/wjgp.v7.i1.27. - DOI - PMC - PubMed
    1. Bass J.J., Wilkinson D.J., Rankin D., Phillips B.E., Szewczyk N.J., Smith K., Atherton P.J. An overview of technical considerations for Western blotting applications to physiological research. Scand. J. Med. Sci. Sports. 2017;27:4–25. doi: 10.1111/sms.12702. - DOI - PMC - PubMed