. 2020 Mar 16;21(6):2022.
doi: 10.3390/ijms21062022.

Role of Autophagy in Von Willebrand Factor Secretion by Endothelial Cells and in the In Vivo Thrombin-Antithrombin Complex Formation Promoted by the HIV-1 Matrix Protein p17

Affiliations

Role of Autophagy in Von Willebrand Factor Secretion by Endothelial Cells and in the In Vivo Thrombin-Antithrombin Complex Formation Promoted by the HIV-1 Matrix Protein p17

Antonella Bugatti et al. Int J Mol Sci. .

Abstract

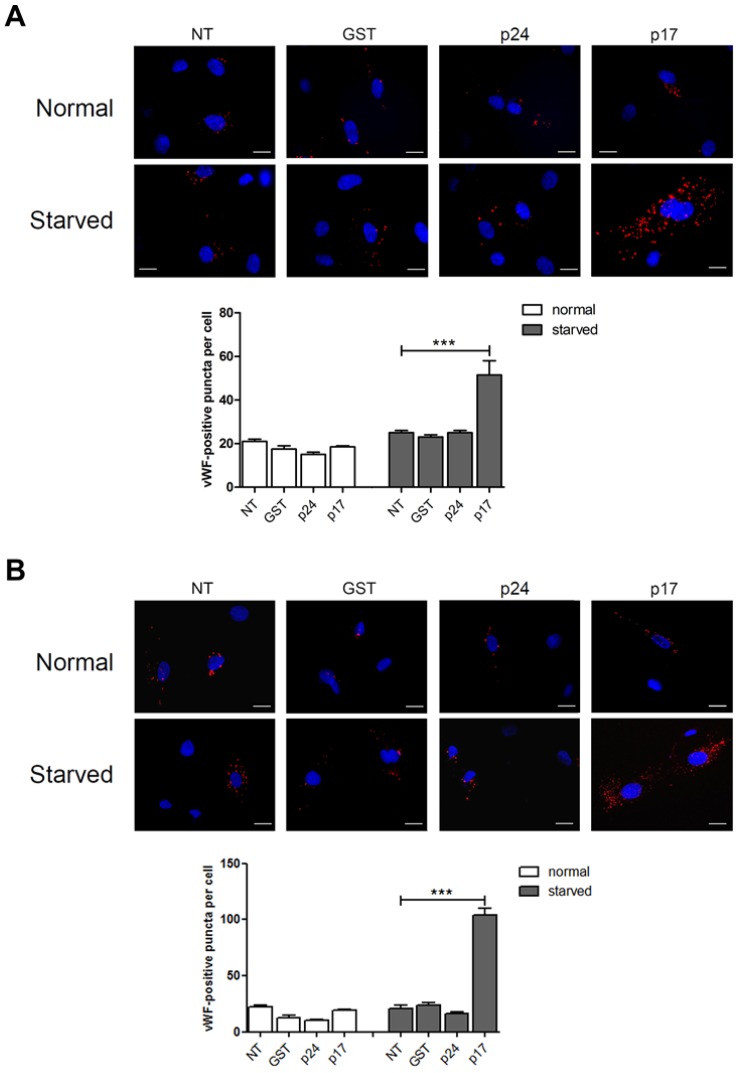
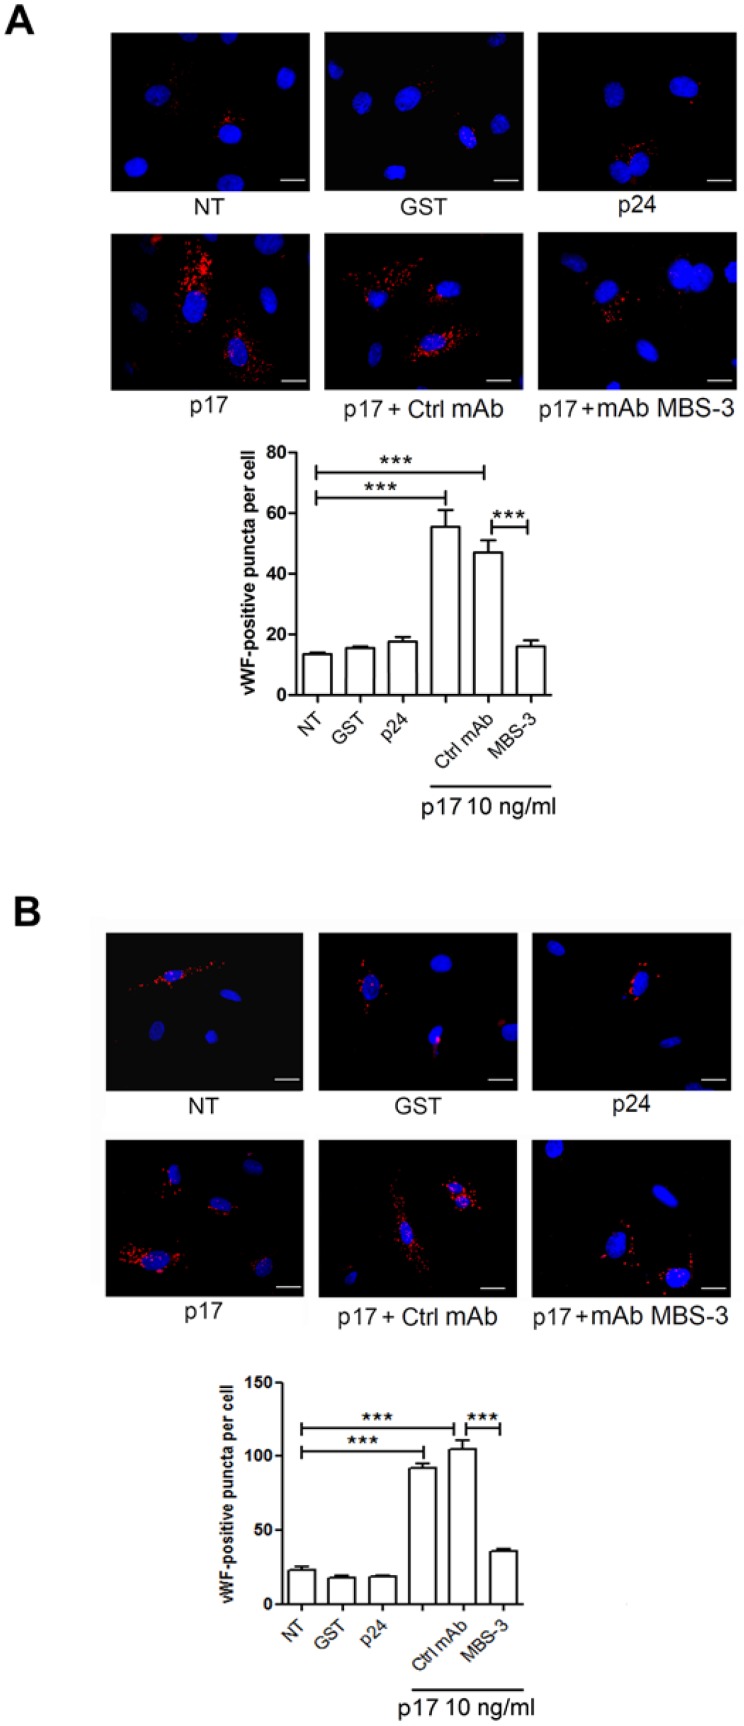
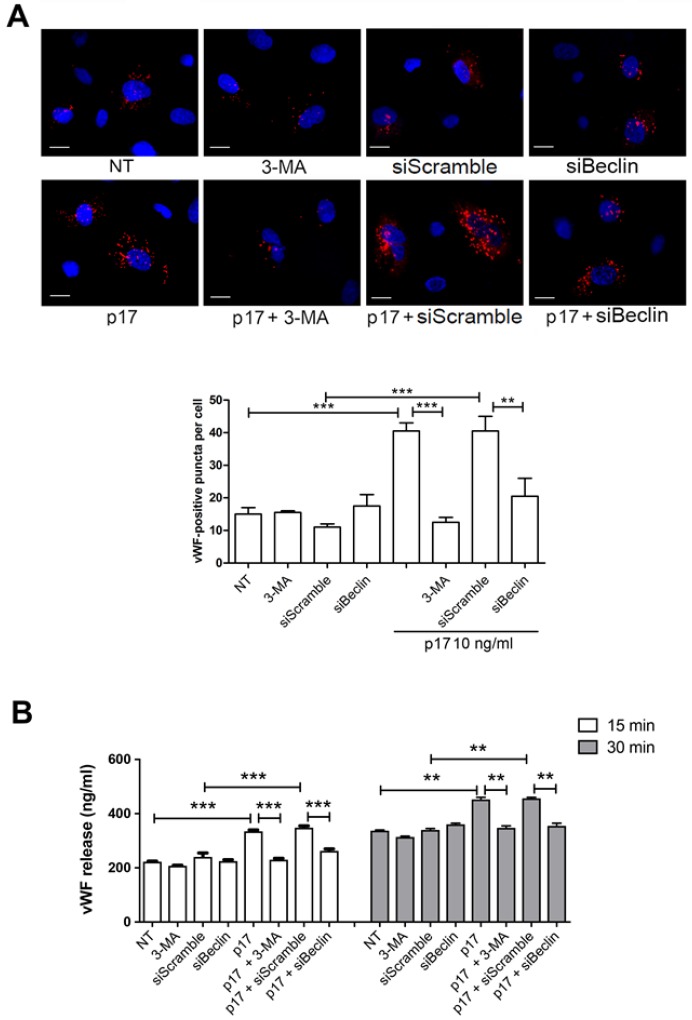
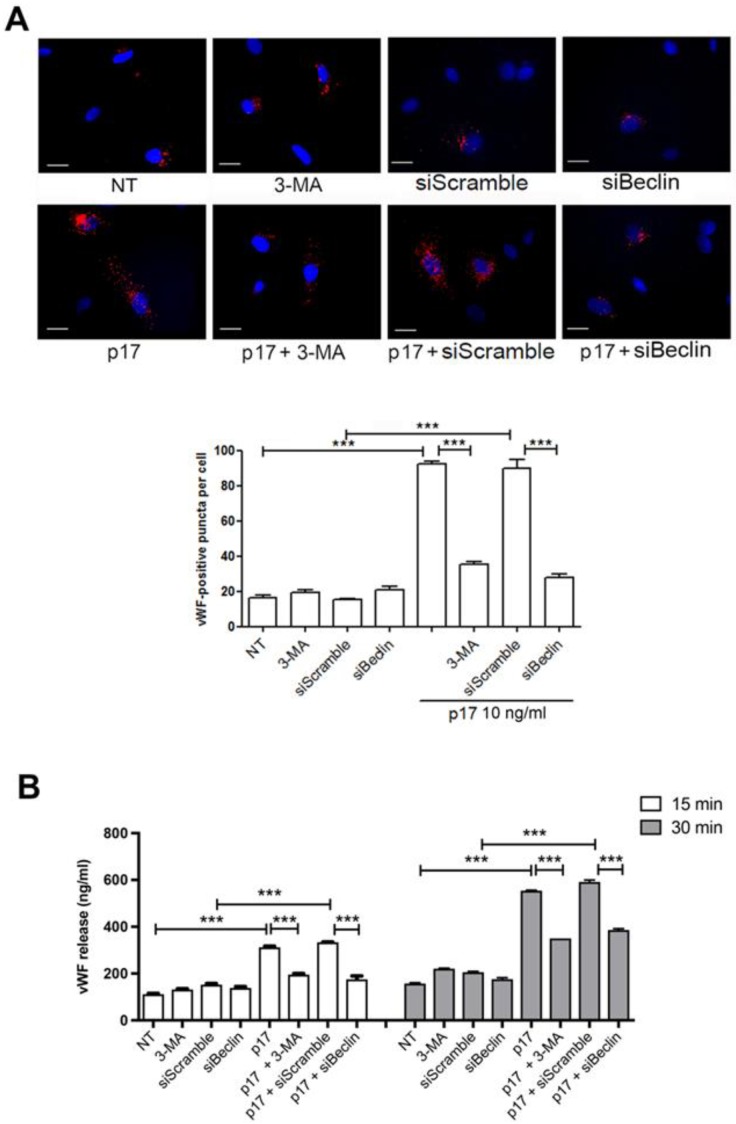
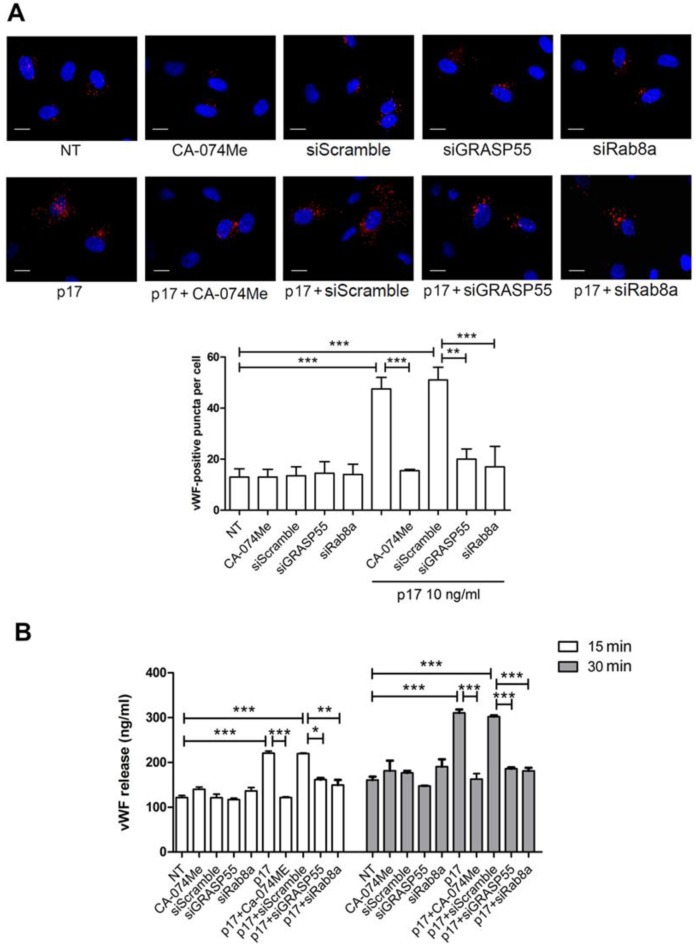
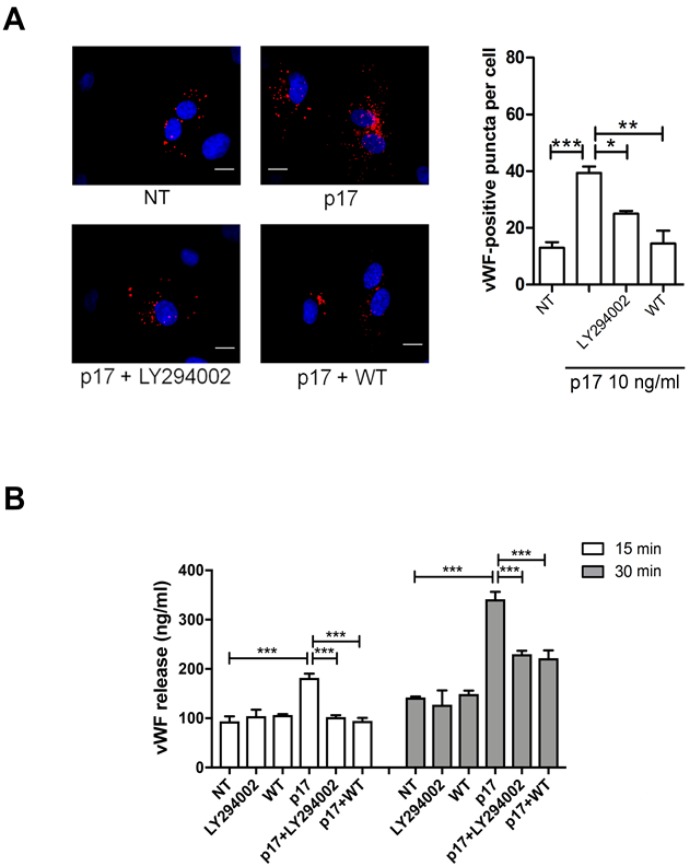
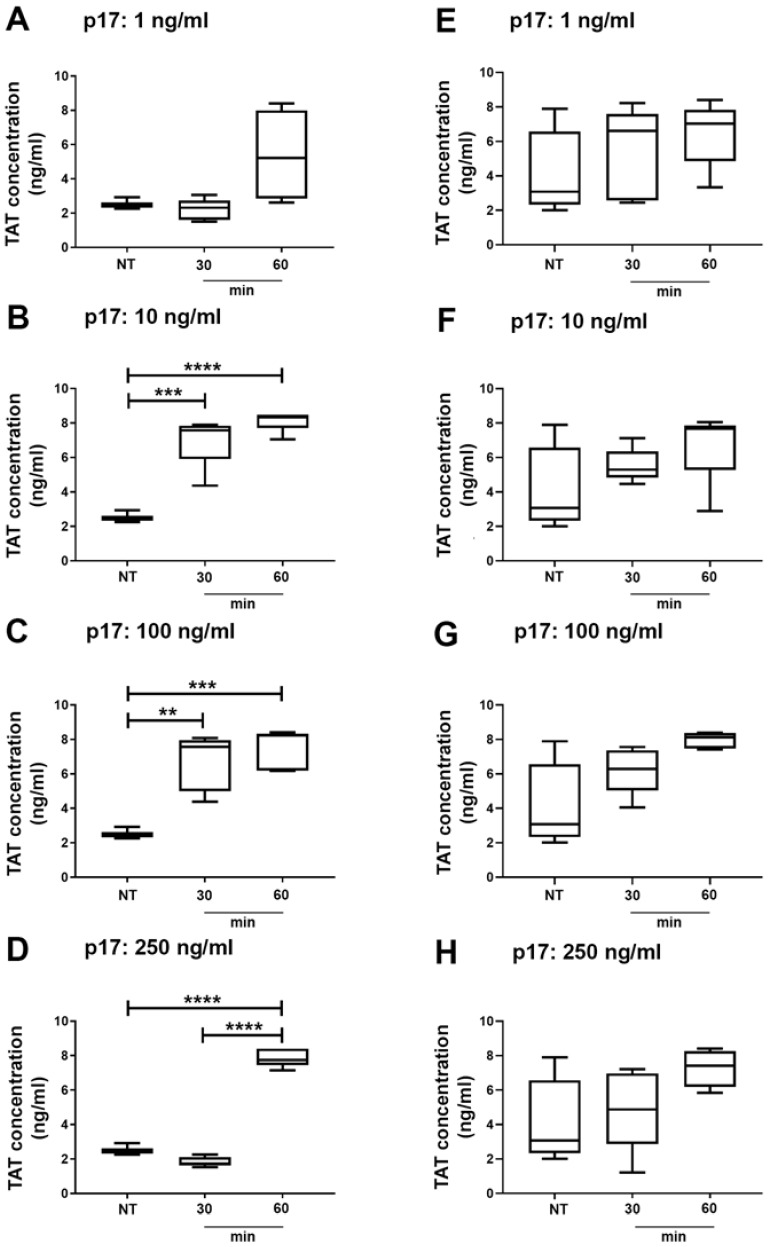
Although the advent of combined antiretroviral therapy has substantially improved the survival of HIV-1-infected individuals, non-AIDS-related diseases are becoming increasingly prevalent in HIV-1-infected patients. Persistent abnormalities in coagulation appear to contribute to excess risk for a broad spectrum of non-AIDS defining complications. Alterations in coagulation biology in the context of HIV infection seem to be largely a consequence of a chronically inflammatory microenvironment leading to endothelial cell (EC) dysfunction. A possible direct role of HIV-1 proteins in sustaining EC dysfunction has been postulated but not yet investigated. The HIV-1 matrix protein p17 (p17) is secreted from HIV-1-infected cells and is known to sustain inflammatory processes by activating ECs. The aim of this study was to investigate the possibility that p17-driven stimulation of human ECs is associated with increased production of critical coagulation factors. Here we show the involvement of autophagy in the p17-induced accumulation and secretion of von Willebrand factor (vWF) by ECs. In vivo experiments confirmed the capability of p17 to exert a potent pro-coagulant activity soon after its intravenous administration.

Keywords: AIDS-related diseases; HIV-1; autophagy; coagulation; p17 matrix protein; thrombin-antithrombin complex.


Conflict of interest statement

The authors declare no conflict of interest.

Figures

Figure 1
Figure 1
The HIV-1 matrix protein p17 induces von Willebrand factor (vWF) accumulation in Weibel-Palade bodies (WPBs) under serum deprivation. HUVECs (A) and HMVEC-Ls (B) were nucleofected with a mCherry-vWF-expressing plasmid and 24 h after nucleofection cells were starved or not for 16 h and then stimulated in the presence or absence of 10 ng/mL of GST, p24 or p17 in complete medium. The images display vWF signals in red and cell nuclei in blue. Scale bar, 10 μm. Red-positive punctate structures were counted in order to quantify the levels of WPBs. NT indicates not treated cells. Values reported for vWF positive structures are the mean ± SD of 3 independent experiments with similar results. Statistical analysis was performed by one-way ANOVA, and the Bonferroni post-test was used to compare data (*** p < 0.001).
Figure 2
Figure 2
vWF accumulation in WPBs is specifically induced by p17. mCherry-vWF nucleofected HUVECs (A) and HMVEC-Ls (B) were serum starved for 16 h and then treated with 10 ng/mL of GST, p24 or p17 in complete medium. When indicated, cells were stimulated with p17 (10 ng/mL) after preincubation of the viral protein with 1 µg/mL of mAb to p17 (MBS-3) or unrelated control mAb (Ctrl mAb) for 30 min at 37 °C. The images display vWF signals in red and cell nuclei in blue. Scale bar, 10 μm. Red-positive punctate structures were counted in order to quantify the levels of WPBs. NT indicates not treated cells. Values reported for vWF positive structures are the mean ± SD of 3 independent experiments with similar results. Statistical analysis was performed by one-way ANOVA, and the Bonferroni post-test was used to compare data (*** p < 0.001).
Figure 3
Figure 3
Inhibition of autophagy decreases p17-mediated release of vWF. (A) HUVECs were nucleofected with a mCherry-vWF-expressing plasmid and, when indicated, in combination with siBeclin-1 or siScramble. Twenty-four h after nucleofection, cells were serum starved for 16 h and then stimulated or not with 10 ng/mL of p17 in complete medium. When indicated, HUVECs were serum starved for 16 h in the presence or absence of 3-MA (5 mM). The images display vWF signals in red and cell nuclei in blue. Scale bar, 10 μm. Red-positive punctate structures were counted in order to quantify the levels of WPBs. NT indicates not treated cells. Values reported for vWF positive structures are the mean ± SD of 3 independent experiments with similar results. Statistical analysis was performed by one-way ANOVA, and the Bonferroni post-test was used to compare data (** p < 0.01, *** p < 0.001). (B) HUVECs were serum starved for 16 h in the presence or absence of 3-MA (5 mM). When indicated, cells were nucleofected with siBeclin-1 or siScramble and serum starved 24 h after nucleofection. After serum starvation, cells were cultured in complete medium containing or not 10 ng/mL of p17. Supernatants were collected at 15 and 30 min of culture and analyzed for the presence of vWF by a standard quantitative ELISA. Bars represent the mean ± SD of triplicate samples. Statistical analysis was performed by one-way ANOVA, and Bonferroni post-test was used to compare data (** p < 0.01, *** p < 0.001). NT indicates not treated cells.
Figure 4
Figure 4
Inhibition of autophagy decreases p17-mediated release of vWF in HMVEC-Ls. (A) HMVEC-Ls were nucleofected with a mCherry-vWF plasmid and, when indicated, in combination with siBeclin-1 or irrelevant (siScramble) siRNAs. Twenty-four h after nucleofection, cells were serum starved for 16 h and then stimulated or not with 10 ng/mL of p17 in complete medium. When indicated, HMVEC-Ls were serum starved for 16 h in the presence or absence of 3-MA (5 mM). The images display vWF signals in red and cell nuclei in blue. Scale bar, 10 μm. Red-positive punctate structures were counted in order to quantify the levels of WPBs. NT indicates not treated cells. Values reported for vWF positive structures are the mean ± SD of 3 independent experiments with similar results. Statistical analysis was performed by one-way ANOVA, and the Bonferroni post-test was used to compare data (*** p < 0.001). (B) HMVEC-Ls were serum starved for 16 h in the presence or absence of 3-MA (5 mM). When indicated, cells were nucleofected with siBeclin-1 or irrelevant (siScramble) siRNAs and 24 h after nucleofection were serum starved. After serum starvation, cells were cultured in complete medium containing or not 10 ng/mL of p17. Supernatants were collected at 15 and 30 min of culture and analyzed for the presence of vWF by a standard quantitative ELISA. Bars represent the mean ± SD of triplicate samples. Statistical analysis was performed by one-way ANOVA, and Bonferroni post-test was used to compare data (*** p < 0.001). NT indicates not treated cells.
Figure 5
Figure 5
Mechanistic insights into the vWF secretory activity of p17. (A) HUVECs were nucleofected with a mCherry-vWF-expressing plasmid in combination or not with siGRASP55, siRab8a or siScramble. Twenty-four h after nucleofection, cells were serum starved for 16 h and then treated with 10 ng/mL of p17. When reported, HUVECs were serum starved in the presence or absence of 50 µM of CA-074Me (cathepsin-β inhibitor) and then stimulated or not with 10 ng/mL of p17. The images display vWF signals in red and cell nuclei in blue. Scale bar, 10 μm. Red-positive punctate structures were counted in order to quantify the levels of WPBs. NT indicates not treated cells. Values reported for vWF positive structures are the mean ± SD of 3 independent experiments with similar results. Statistical analysis was performed by one-way ANOVA, and the Bonferroni post-test was used to compare data (** p < 0.01, *** p < 0.001). (B) HUVECs were serum starved in the presence or absence of 50 μM of CA-074Me. In some experiments, HUVECs were nucleofected with siScramble, siGRASP55 or siRab8a and 24 h after nucleofection, cells were serum starved for 16 h. After serum starvation, HUVECs were cultured in complete medium containing or not 10 ng/mL of p17. After 15 and 30 min of culture, supernatants were collected and analyzed by a standard quantitative ELISA. Bars represent the mean ± SD of triplicate samples. Statistical analysis was performed by one-way ANOVA, and the Bonferroni post-test was used to compare data (* p < 0.05, ** p < 0.01, *** p < 0.001). NT indicates not treated cells.
Figure 6
Figure 6
Role of PI3K in p17-induced vWF secretion. (A) HUVECs were nucleofected with a mCherry-vWF-expressing plasmid. Twenty-four h after nucleofection, cells were serum starved for 16 h and then treated for 1 h with the PI3K inhibitor LY294002 (10 μM) or wortmannin (WT [100 nM]) before stimulation with p17 (10 ng/mL). The images display vWF signals in red and cell nuclei in blue. Scale bar, 10 μm. Red-positive punctate structures were counted in order to quantify the levels of WPBs. NT indicates not treated cells. Values reported for vWF positive structures are the mean ± SD of 3 independent experiments with similar results. Statistical analysis was performed by one-way ANOVA, and the Bonferroni post-test was used to compare data (* p < 0.05, ** p < 0.01, *** p < 0.001). (B) HUVECs were serum starved for 16 h. After serum starvation, cells were treated or not for 1 h with the PI3K inhibitor LY294002 (10 μM) or wortmannin (WT [100 nM]) before stimulation or not with 10 ng/mL of p17. Supernatants were collected at 15 and 30 min of culture and analyzed for the presence of vWF by a standard quantitative ELISA. Bars represent the mean ± SD of triplicate samples. Statistical analysis was performed by one-way ANOVA, and Bonferroni post-test was used to compare data (*** p < 0.001). NT indicates not treated cells.
Figure 7
Figure 7
Increased TAT complex formation is observed in plasma from wild type but not autophagy-deficient mice treated with p17. C57BL/6 (AD) and BECN-1 (EH) mice were i.v. injected or not (NT, not treated mice) with 1 ng/mL (A,E), 10 ng/mL (B,F), 100 ng/mL (C,G) and 250 ng/mL (D,H) of p17, respectively. Blood samples were collected at 30 and 60 min following p17 injection and further analyzed for TAT complex formation by ELISA. Results are expressed as TAT concentration in plasma of mice. Statistical analysis was performed by one-way ANOVA with Tukey’s multiple comparison test (** p < 0.01, *** p < 0.001, **** p < 0.0001). In box and whiskers graphs, boxes extend from the 25th to the 75th percentiles, lines indicate the median values, and whiskers indicate the range of values. Each box represents the mean ± SEM of five animals.

Similar articles

Cited by

References

    1. Duran J.M., Anjard C., Stefan C., Loomis W.F., Malhotra V. Unconventional secretion of Acb1 is mediated by autophagosomes. J. Cell. Biol. 2010;188:527–536. doi: 10.1083/jcb.200911154. - DOI - PMC - PubMed
    1. Manjithaya R., Anjard C., Loomis W.F., Subramani S. Unconventional secretion of Pichia pastoris Acb1 is dependent on GRASP protein, peroxisomal functions, and autophagosome formation. J. Cell. Biol. 2010;188:537–546. doi: 10.1083/jcb.200911149. - DOI - PMC - PubMed
    1. Dupont N., Jiang S., Pilli M., Ornatowski W., Bhattacharya D., Deretic V. Autophagy-based unconventional secretory pathway for extracellular delivery of IL-1β. EMBO J. 2011;30:4701–4711. doi: 10.1038/emboj.2011.398. - DOI - PMC - PubMed
    1. Narita M., Young A.R., Arakawa S., Samarajiwa S.A., Nakashima T., Yoshida S., Hong S., Berry L.S., Reichelt S., Ferreira M., et al. Spatial coupling of mTOR and autophagy augments secretory phenotypes. Science. 2011;332:966–970. doi: 10.1126/science.1205407. - DOI - PMC - PubMed
    1. Cadwell K., Liu J.Y., Brown S.L., Miyoshi H., Loh J., Lennerz J.K., Kishi C., Kc W., Carrero J.A., Hunt S., et al. A key role for autophagy and the autophagy gene Atg16l1 in mouse and human intestinal Paneth cells. Nature. 2008;456:259–263. doi: 10.1038/nature07416. - DOI - PMC - PubMed

Substances

LinkOut - more resources