

Human Peripheral Blood Gamma Delta T Cells: Report on a Series of Healthy Caucasian Portuguese Adults and Comprehensive Review of the Literature
- PMID: 32188103
- PMCID: PMC7140678
- DOI: 10.3390/cells9030729
Human Peripheral Blood Gamma Delta T Cells: Report on a Series of Healthy Caucasian Portuguese Adults and Comprehensive Review of the Literature
Abstract
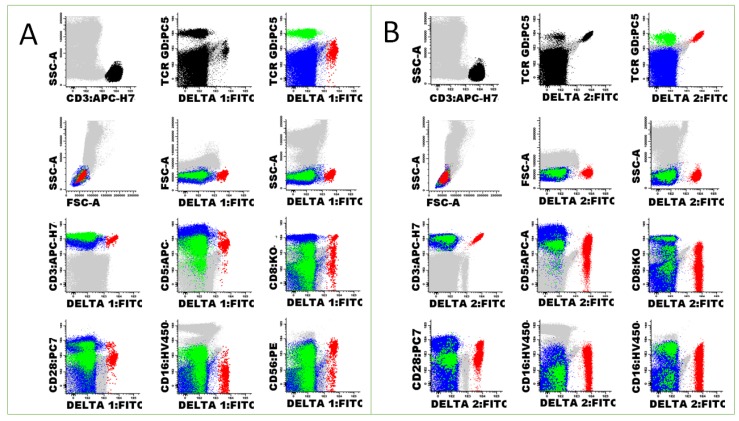
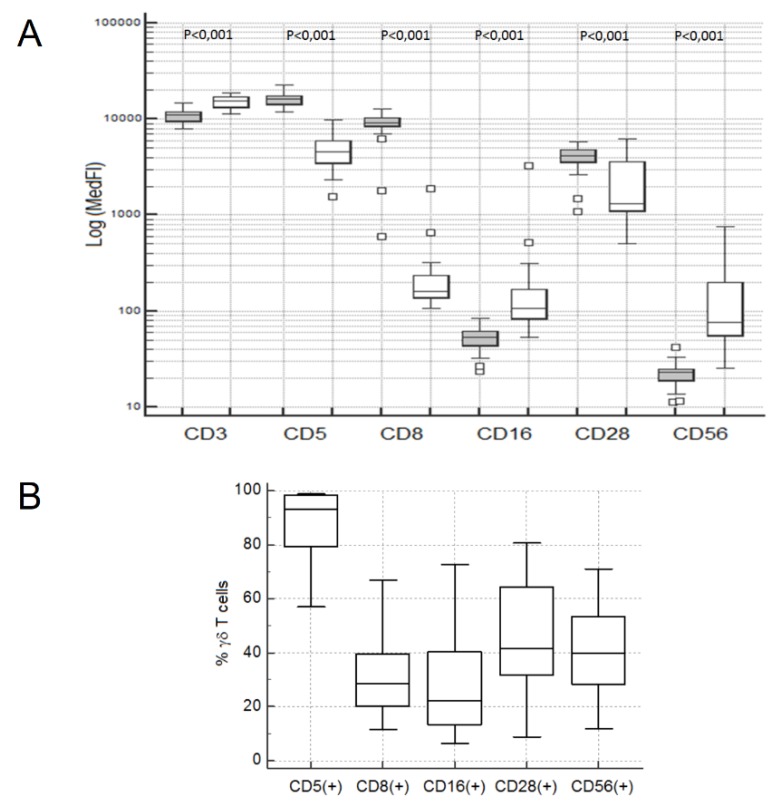
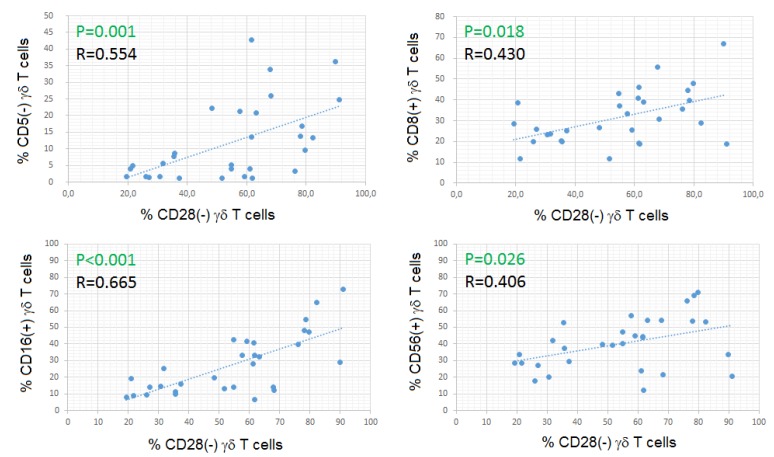
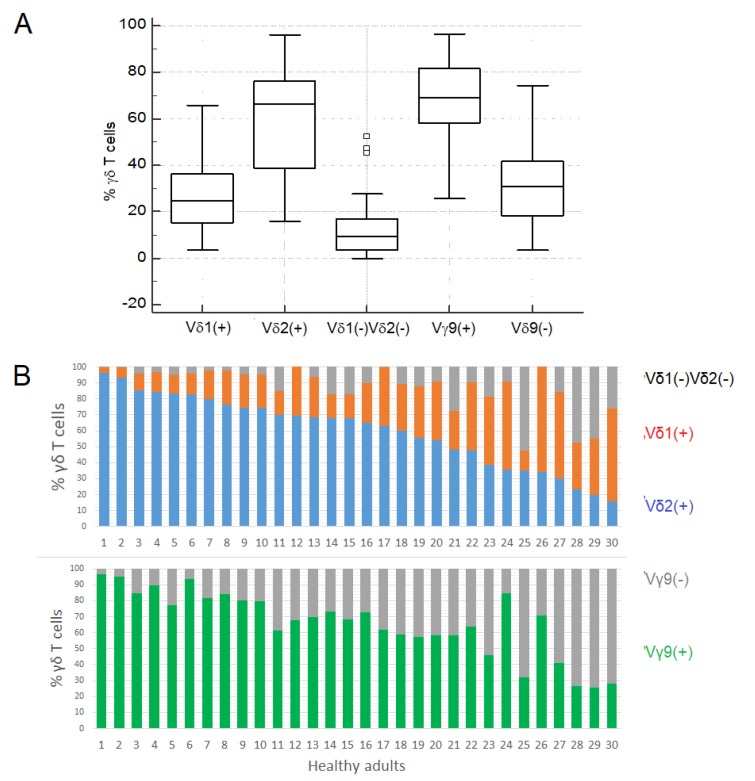
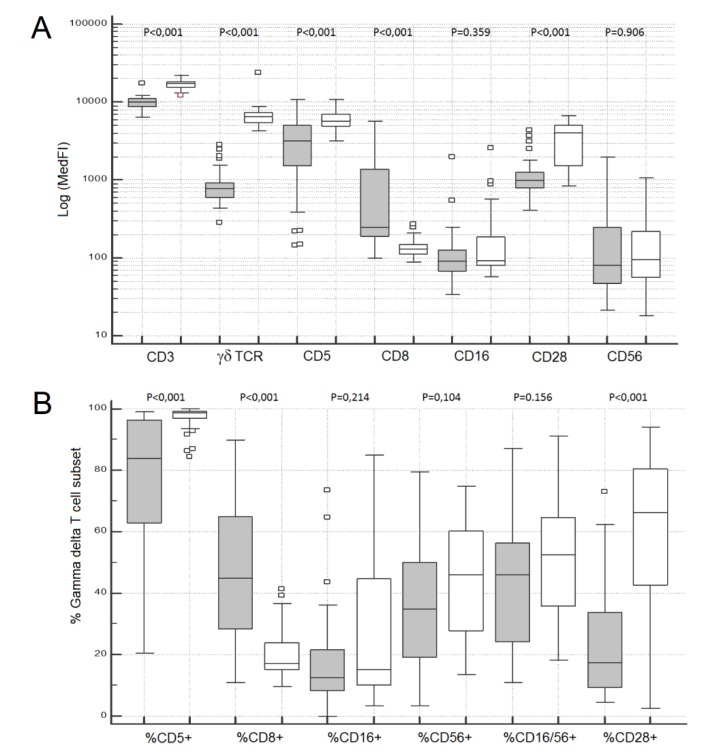
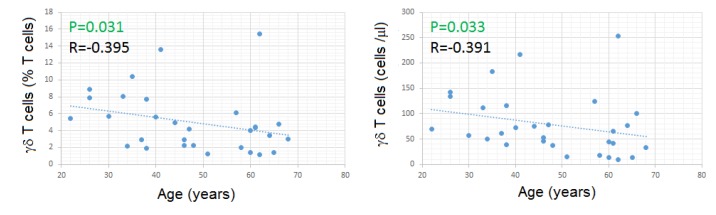
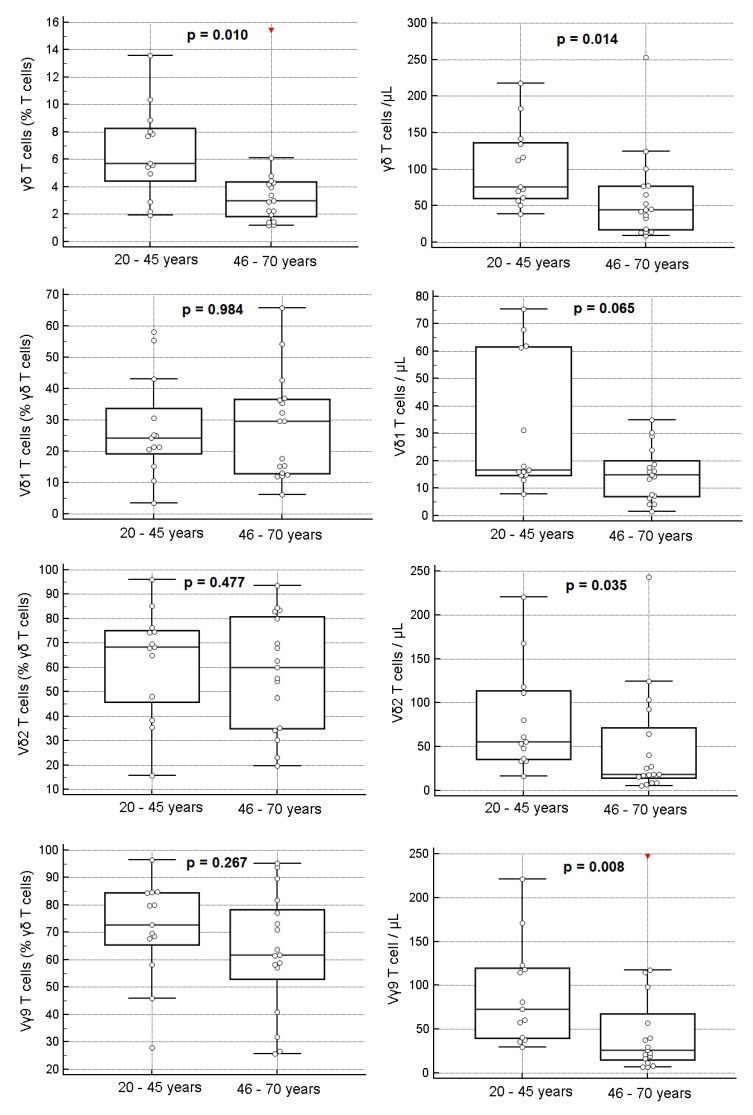
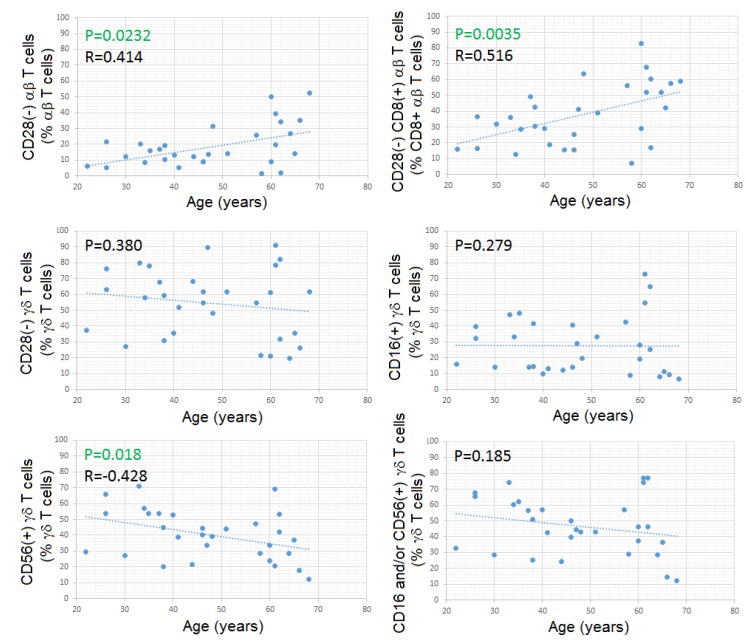
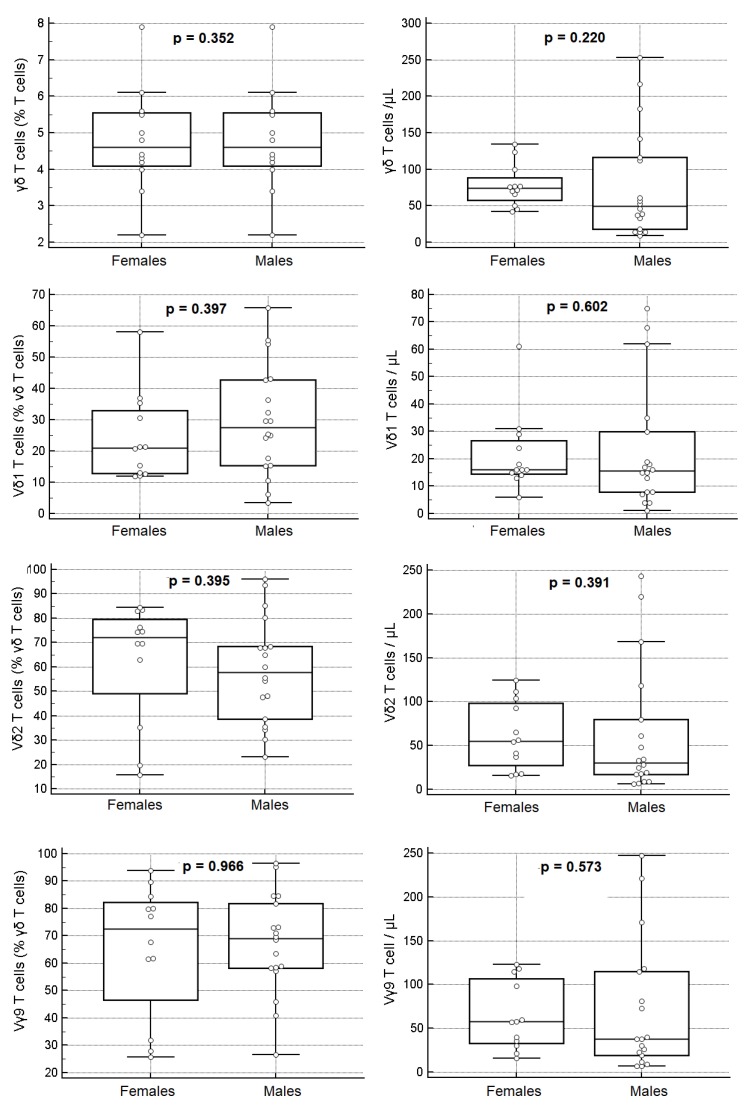
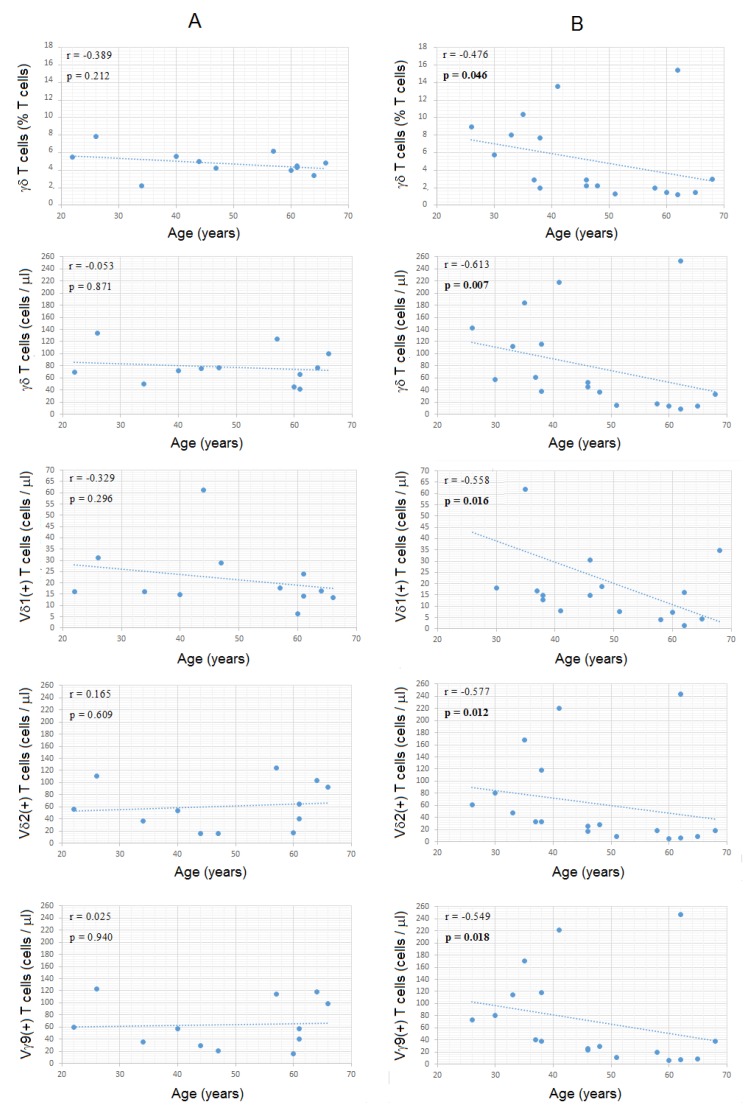
Gamma delta T cells (Tc) are divided according to the type of Vδ and Vγ chains they express, with two major γδ Tc subsets being recognized in humans: Vδ2Vγ9 and Vδ1. Despite many studies in pathological conditions, only a few have quantified the γδ Tc subsets in healthy adults, and a comprehensive review of the factors influencing its representation in the blood is missing. Here we quantified the total γδ Tc and the Vδ2/Vγ9 and Vδ1 Tc subsets in the blood from 30 healthy, Caucasian, Portuguese adults, we characterized their immunophenotype by 8-color flow cytometry, focusing in a few relevant Tc markers (CD3/TCR-γδ, CD5, CD8), and costimulatory (CD28), cytotoxic (CD16) and adhesion (CD56) molecules, and we examined the impacts of age and gender. Additionally, we reviewed the literature on the influences of race/ethnicity, age, gender, special periods of life, past infections, diet, medications and concomitant diseases on γδ Tc and their subsets. Given the multitude of factors influencing the γδ Tc repertoire and immunophenotype and the high variation observed, caution should be taken in interpreting "abnormal" γδ Tc values and repertoire deviations, and the clinical significance of small populations of "phenotypically abnormal" γδ Tc in the blood.
Keywords: Vdelta1; Vdelta2; Vgamma9; gamma delta T cell repertoire; gamma delta T cells; human cytomegalovirus; human herpes viruses; immune response; normal reference values.
Conflict of interest statement
The authors declare no conflict of interest. The funders had no role in study design, data collection and analysis, decision to publish, or preparation of the manuscript.
Figures
Similar articles
-
Vδ1 Effector and Vδ2 γδ T-Cell Subsets Shift in Frequency and Are Linked to Plasma Inflammatory Markers During Antiretroviral Therapy-Suppressed HIV Infection.J Infect Dis. 2024 May 15;229(5):1317-1327. doi: 10.1093/infdis/jiae091. J Infect Dis. 2024. PMID: 38390982 Free PMC article.
-
Human liver infiltrating γδ T cells are composed of clonally expanded circulating and tissue-resident populations.J Hepatol. 2018 Sep;69(3):654-665. doi: 10.1016/j.jhep.2018.05.007. Epub 2018 May 18. J Hepatol. 2018. PMID: 29758330 Free PMC article.
-
The human Vδ2+ T-cell compartment comprises distinct innate-like Vγ9+ and adaptive Vγ9- subsets.Nat Commun. 2018 May 2;9(1):1760. doi: 10.1038/s41467-018-04076-0. Nat Commun. 2018. PMID: 29720665 Free PMC article.
-
Human γδ TCR Repertoires in Health and Disease.Cells. 2020 Mar 26;9(4):800. doi: 10.3390/cells9040800. Cells. 2020. PMID: 32225004 Free PMC article. Review.
-
Human Vδ1+ T Cells in the Immune Response to Plasmodium falciparum Infection.Front Immunol. 2019 Feb 14;10:259. doi: 10.3389/fimmu.2019.00259. eCollection 2019. Front Immunol. 2019. PMID: 30837999 Free PMC article. Review.
Cited by
-
Defining TCRγδ lymphoproliferative disorders by combined immunophenotypic and molecular evaluation.Nat Commun. 2022 Jun 8;13(1):3298. doi: 10.1038/s41467-022-31015-x. Nat Commun. 2022. PMID: 35676278 Free PMC article.
-
γδ T Are Significantly Impacted by CLL Burden but Only Mildly Influenced by M-MDSCs.Cancers (Basel). 2025 Jan 14;17(2):254. doi: 10.3390/cancers17020254. Cancers (Basel). 2025. PMID: 39858035 Free PMC article.
-
Porcine γδ T cells express cytotoxic cell-associated markers and display killing activity but are not selectively cytotoxic against PRRSV- or swIAV-infected macrophages.Front Immunol. 2024 Jul 31;15:1434011. doi: 10.3389/fimmu.2024.1434011. eCollection 2024. Front Immunol. 2024. PMID: 39144143 Free PMC article.
-
γδ T Cells for Leukemia Immunotherapy: New and Expanding Trends.Front Immunol. 2021 Sep 22;12:729085. doi: 10.3389/fimmu.2021.729085. eCollection 2021. Front Immunol. 2021. PMID: 34630403 Free PMC article. Review.
-
γδ T cells as a potential therapeutic agent for glioblastoma.Front Immunol. 2023 Oct 20;14:1273986. doi: 10.3389/fimmu.2023.1273986. eCollection 2023. Front Immunol. 2023. PMID: 37928546 Free PMC article. Review.
References
-
- Aljurf M., Ezzat A.O., Musa M. Emerging role of gammadelta T-cells in health and disease. Blood Rev. 2002;16:203–206. - PubMed
-
- Roden A.C., Morice W.G., Hanson C.A. Immunophenotypic attributes of benign peripheral blood gammadelta T cells and conditions associated with their increase. Arch. Pathol. Lab. Med. 2008;132:1774–1780. - PubMed
Publication types
MeSH terms
Substances
LinkOut - more resources
Full Text Sources
Other Literature Sources
Research Materials
Miscellaneous
