. 2020 Mar 16;9(3):730.
doi: 10.3390/cells9030730.

Enhanced Adipose Expression of Interferon Regulatory Factor (IRF)-5 Associates with the Signatures of Metabolic Inflammation in Diabetic Obese Patients

Affiliations

Enhanced Adipose Expression of Interferon Regulatory Factor (IRF)-5 Associates with the Signatures of Metabolic Inflammation in Diabetic Obese Patients

Sardar Sindhu et al. Cells. .

Abstract

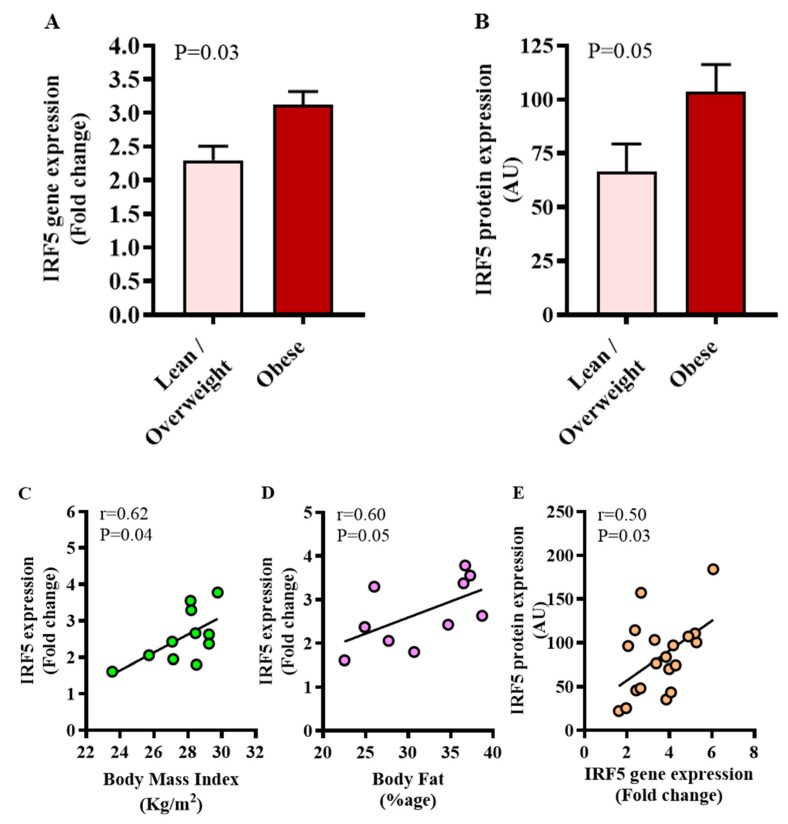
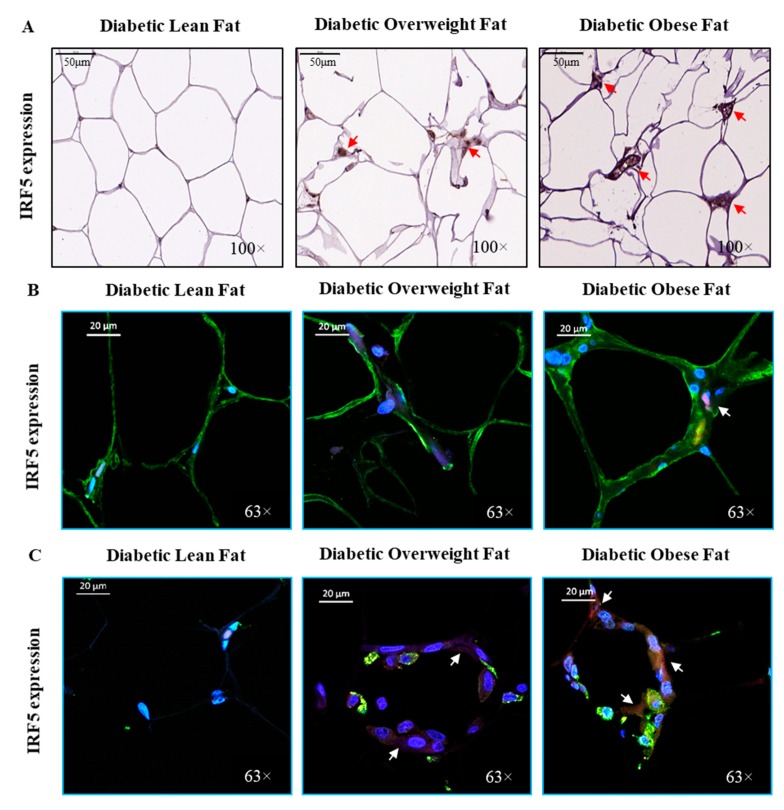
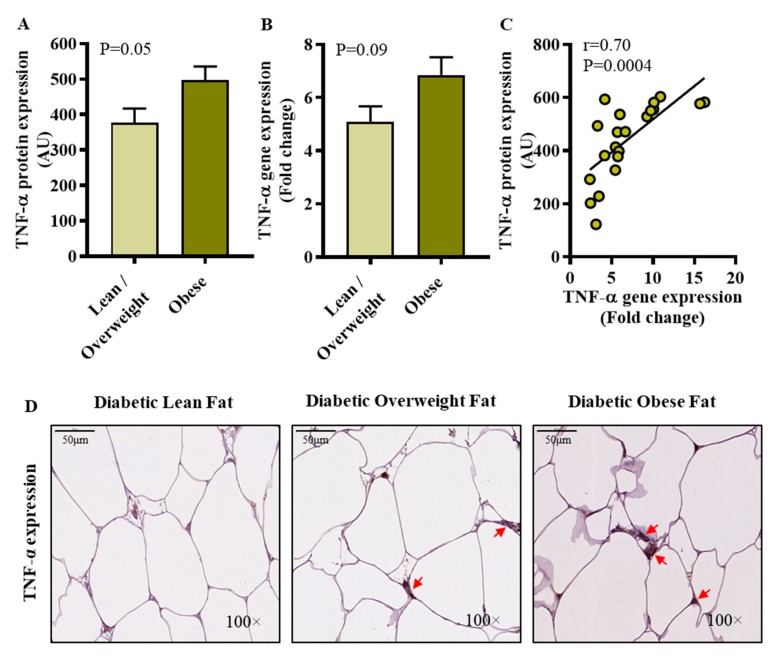
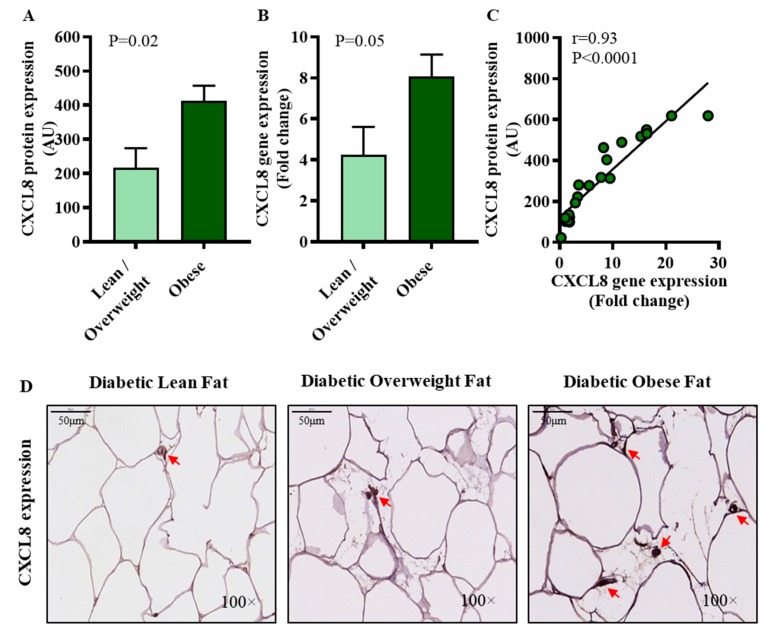
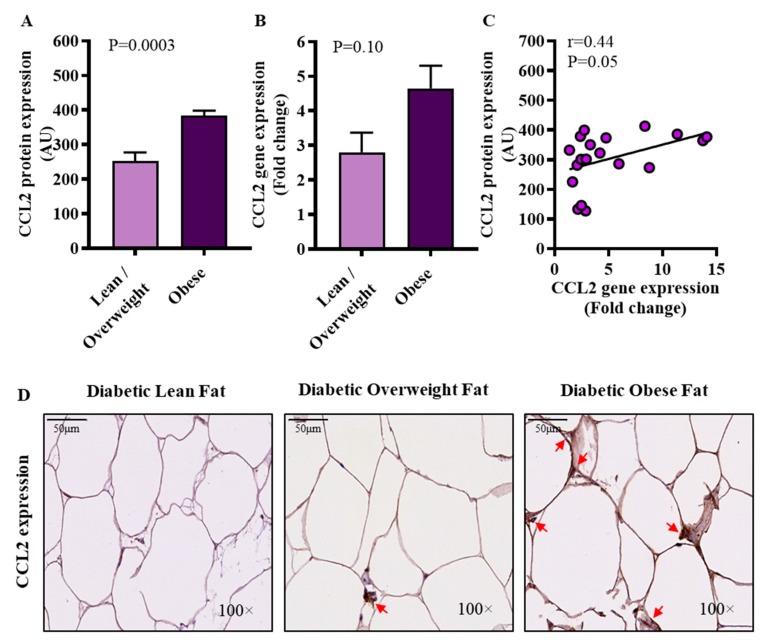
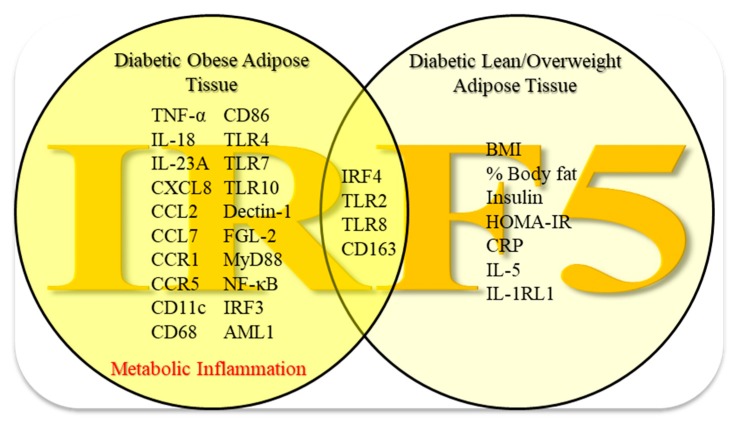
: Interferon regulatory factors (IRFs) are emerging as the metabolic transcriptional regulators in obesity/type-2 diabetes (T2D). IRF5 is implicated with macrophage polarization toward the inflammatory M1-phenotype, nonetheless, changes in the adipose expression of IRF5 in T2D and relationship of these changes with other markers of adipose inflammation remain unclear. Therefore, we determined the IRF5 gene expression in subcutaneous adipose tissue samples from 46 T2D patients including 35 obese (Body Mass Index/BMI 33.83 ± 0.42kg/m2) and 11 lean/overweight individuals (BMI 27.55 ± 0.46kg/m2) using real-time qRT-PCR. IRF5 protein expression was assessed using immunohistochemistry and confocal microscopy. Fasting plasma glucose, insulin, HbA1c, C-reactive protein, cholesterol, low- and high-density lipoproteins (LDL/HDL), and triglycerides were measured using commercial kits. IRF5 gene expression was compared with that of signature inflammatory markers and several clinico-metabolic indicators. The data (mean ± SEM) show the enhanced adipose IRF5 gene (p = 0.03) and protein (p = 0.05) expression in obese compared to lean/overweight diabetic patients. Adipose IRF5 transcripts in diabetic obese individuals associated positively with those of TNF-α, IL-18, IL-23A, CXCL8, CCL2, CCL7, CCR1/5, CD11c, CD68, CD86, TLR4/7/10, Dectin-1, FGL-2, MyD88, NF-κB, IRF3, and AML1 (p < 0.05). In diabetic lean/overweight subjects, IRF5 expression associated with BMI, body fat %age, glucose, insulin, homeostatic model assessment of insulin resistance (HOMA-IR, C-reactive protein (CRP), IL-5, and IL-1RL1 expression; while in all T2D patients, IRF5 expression correlated with that of IRF4, TLR2/8, and CD163. In conclusion, upregulated adipose tissue IRF5 expression in diabetic obese patients concurs with the inflammatory signatures and it may represent a potential marker for metabolic inflammation in obesity/T2D.

Keywords: Interferon regulatory factor-5; adipose tissue; metabolic inflammation; obesity; type-2 diabetes.


Conflict of interest statement

The authors declare no conflict of interest.

Figures

Figure 1
Figure 1
Increased adipose tissue interferon regulatory factor (IRF)5 expression in diabetic obese patients. IRF5 gene expression was assessed in the adipose tissue by using qRT-PCR in 46 type-2 diabetic (T2D) patients and expression of the IRF5 protein was determined by immunohistochemistry (IHC) in 19 T2D patients as described in materials and methods. Regarding qRT-PCR, GAPDH gene expression was used as internal control. The expression level of IRF5 gene relative to control (lean adipose tissue) was calculated by using 2−ΔΔCt method and expressed as relative mRNA expression or fold change over the average control expression taken as 1. Regarding IHC, IRF5 protein staining intensity, expressed as arbitrary units (AU), was determined by using Aperio-positive pixel count algorithm and ImageScope software. The number of positive pixels was normalized to total pixels (positive and negative) and color/intensity thresholds were set with immunostaining as positive and background as negative pixels. The data (mean±SEM) show significantly elevated (A) IRF5 gene expression (fold change) (p = 0.03) and (B) IRF5 protein expression (AU) (p = 0.05) in diabetic obese compared to diabetic lean/overweight patients. Furthermore, in diabetic lean/overweight subjects (11), IRF5 gene expression was found to associate positively with (C) body mass index (BMI: r = 0.62, p = 0.04) and (D) %age of body fat (r = 0.60, p = 0.05). (E) Overall, IRF5 gene and protein expression were found to be mutually concordant (r = 0.50, p = 0.03).
Figure 2
Figure 2
Comparative adipose tissue IRF5 expression in diabetic patients. Adipose IRF5 protein expression was determined by immunohistochemistry (IHC). IRF5 expression was also determined in adipocytes and macrophages using confocal microscopy (CM) as described in materials and methods. (A) The representative IHC images (100× magnification; scale bar 50 μm) obtained from three independent determinations, each, with similar results show the comparative adipose IRF5 protein expression (arrows) in diabetic lean, overweight, and obese patients. Similarly, representative CM images (63× magnification; scale bar 20 μm) obtained from three independent determinations with similar results show IRF5 expression (IRF5 staining in red; see arrows) in (B) adipocytes (FABP4 staining in green) and (C) macrophages (CD163 staining in green) for diabetic lean, overweight, and obese patients; while the blue color represents DAPI counterstaining.
Figure 3
Figure 3
Elevated adipose TNF-α protein expression in diabetic obese patients. Adipose TNF-α protein and gene expressions were assessed by immunohistochemistry (IHC) and qRT-PCR in 21 and 46 type-2 diabetic patients, respectively, as described in materials and methods. Regarding IHC, TNF-α protein staining intensity expressed as arbitrary units (AU) was determined by using Aperio-positive pixel count algorithm and ImageScope software. The number of positive pixels was normalized to total pixels (positive and negative) and color/intensity thresholds were set with immunostaining as positive and background as negative pixels. Regarding qRT-PCR, GAPDH gene expression was used as internal control. The expression level of TNF-α gene relative to control (lean adipose tissue) was calculated by using 2−ΔΔCt method and expressed as relative mRNA expression or fold change over the average control expression taken as 1. (A) The data (mean±SEM) show that adipose TNF-α protein expression (AU) was significantly higher in diabetic obese compared to diabetic lean/overweight patients (p = 0.05); (B) However, TNF-α transcripts’ expression (fold change) differed non-significantly between diabetic obese and diabetic lean/overweight patients (p = 0.09). (C) A positive association was found between TNF-α gene and protein expression (r = 0.70, p = 0.0004). (D) The representative IHC images from three independent determinations with similar results show the comparative TNF-α protein expression (arrows) in the fat tissue from diabetic lean, overweight, and obese patients (100× magnification; scale bar 50 μm).
Figure 4
Figure 4
Increased adipose CXCL8 expression in diabetic obese patients. Adipose CXCL8 protein and gene expressions were assessed by immunohistochemistry (IHC) and qRT-PCR in 21 and 46 type-2 diabetic patients, respectively, as described in materials and methods. Regarding IHC, CXCL8 protein staining intensity expressed as arbitrary units (AU) was determined by using Aperio-positive pixel count algorithm and ImageScope software. The number of positive pixels was normalized to total pixels (positive and negative) and color/intensity thresholds were set with immunostaining as positive and background as negative pixels. Regarding qRT-PCR, GAPDH gene expression was used as internal control. The expression level of CXCL8 gene relative to control (lean adipose tissue) was calculated by using 2−ΔΔCt method and expressed as relative mRNA expression or fold change over the average control expression taken as 1. (A) The data (mean±SEM) show that adipose CXCL8 protein expression (AU) was significantly higher in diabetic obese patients compared to diabetic lean/overweight patients (p = 0.02). (B) As expected, adipose CXCL8 mRNA expression (fold change) was also higher in diabetic obese compared to diabetic lean/overweight patients (p = 0.05). (C) A strong positive correlation was found between the gene and protein expression of CXCL8 (r = 0.93, p < 0.0001). (D) The representative IHC images from three independent determinations with similar results show the comparative adipose CXCL8 protein expression (arrows) in diabetic lean, overweight, and obese patients (100× magnification; scale bar 50 μm).
Figure 5
Figure 5
Increased adipose CCL2 protein expression in diabetic obese patients. Adipose CCL2 protein and gene expressions were determined by immunohistochemistry (IHC) and qRT-PCR in 21 and 46 type-2 diabetic patients, respectively, as described in materials and methods. Regarding IHC, CCL2 protein staining intensity expressed as arbitrary units (AU) was determined by using Aperio-positive pixel count algorithm and ImageScope software. The number of positive pixels was normalized to total pixels (positive and negative) and color/intensity thresholds were set with immunostaining as positive and background as negative pixels. Regarding qRT-PCR, GAPDH gene expression was used as internal control. The expression level of CCL2 gene relative to control (lean adipose tissue) was calculated by using 2−ΔΔCt method and expressed as relative mRNA expression or fold change over the average control expression taken as 1. (A) The data (mean ± SEM) show that CCL2 protein expression (AU) was significantly higher in diabetic obese patients compared to diabetic lean/overweight patients (p = 0.0003). (B) However, CCL2 transcripts (fold change) differed non-significantly between diabetic obese and diabetic lean/overweight patients (p = 0.10). (C) CCL2 gene and protein expressions correlated positively (r = 0.44, p = 0.05). (D) The representative IHC images from three independent determinations with similar results show the comparative adipose CCL2 protein expression (arrows) in diabetic lean, overweight, and obese patients (100× magnification; scale bar 50 μm).
Figure 6
Figure 6
Enhanced adipose tissue IRF5 expression in diabetic obese patients parallels with the signatures of metabolic inflammation. The data presented in this study support a model of metabolic inflammation in type-2 diabetes, in which, increased adipose IRF5 gene expression in diabetic obese patients concurs with the local expression of a wide variety of inflammatory markers including TNF-α, IL-18, IL-23A, CXCL8, CCL2/7, CCR1/5, CD11c, CD68, CD86, TLR4/7/10, Dectin-1, FGL-2, MyD88, NF-κB, IRF3, and AML1. On the other hand, in diabetic lean/overweight patients, adipose IRF5 gene expression was found to correlate with BMI, body fat percentage, insulin levels, HOMA-IR index, plasma CRP, and adipose IL-5 and IL-1RL1 transcripts expression. In all diabetic patients, regardless of the status of their obesity, adipose IRF5 transcripts correlated with IRF4, TLR2/8, and CD163 gene expression. Altogether, these changes imply that the adipose tissue IRF5 upregulation may represent a novel marker of metabolic inflammation in type-2 diabetes.

Similar articles

Cited by

References

    1. Saltiel A.R., Olefsky J.M. Inflammatory mechanisms linking obesity and metabolic disease. J. Clin. Investig. 2017;127:1–4. doi: 10.1172/JCI92035. - DOI - PMC - PubMed
    1. van Greevenbroek M.M., Schalkwijk C.G., Stehouwer C.D. Obesity-associated low-grade inflammation in type 2 diabetes mellitus: Causes and consequences. Neth. J. Med. 2013;71:174–187. - PubMed
    1. Abate N., Garg A., Peshock R.M., Stray-Gundersen J., Grundy S.M. Relationships of generalized and regional adiposity to insulin sensitivity in men. J. Clin. Investig. 1995;96:88–98. doi: 10.1172/JCI118083. - DOI - PMC - PubMed
    1. Greenberg A.S., Obin M.S. Obesity and the role of adipose tissue in inflammation and metabolism. Am. J. Clin. Nutr. 2006;83:461S–465S. doi: 10.1093/ajcn/83.2.461S. - DOI - PubMed
    1. Kwon H., Pessin J.E. Adipokines mediate inflammation and insulin resistance. Front. Endocrinol. (Lausanne) 2013;4:71. doi: 10.3389/fendo.2013.00071. - DOI - PMC - PubMed

Publication types