. 2020 Mar 18;18(1):31.
doi: 10.1186/s12915-020-0760-3.

A metabolic switch regulates the transition between growth and diapause in C. elegans

Affiliations

A metabolic switch regulates the transition between growth and diapause in C. elegans

Sider Penkov et al. BMC Biol. .

Abstract

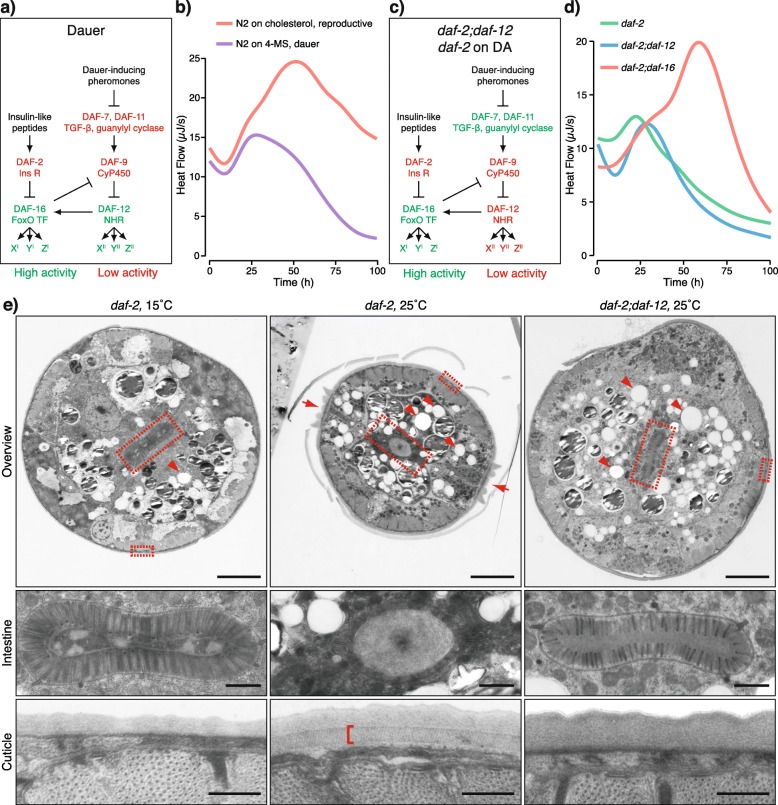
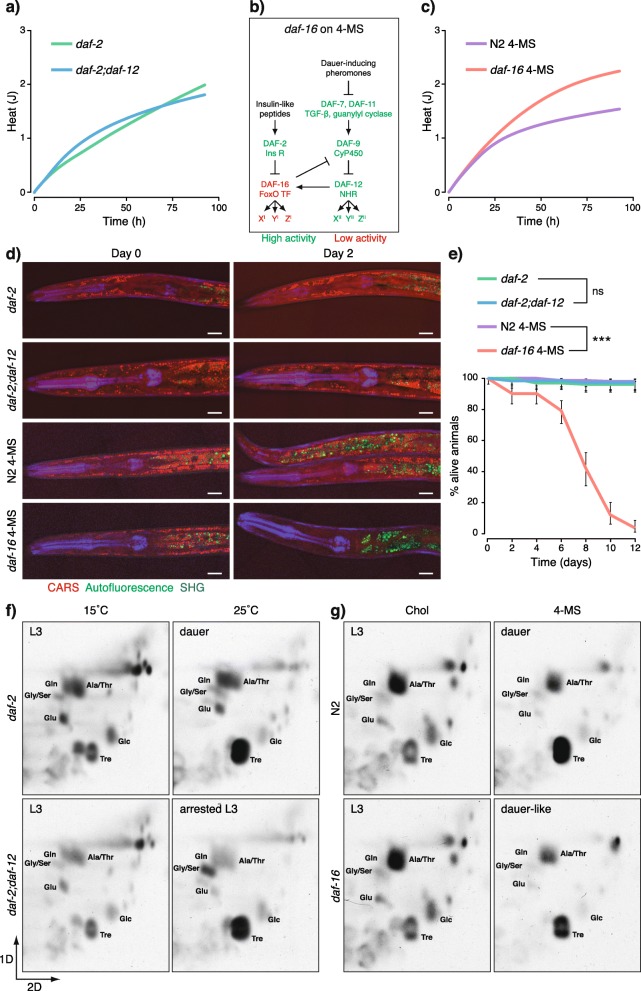
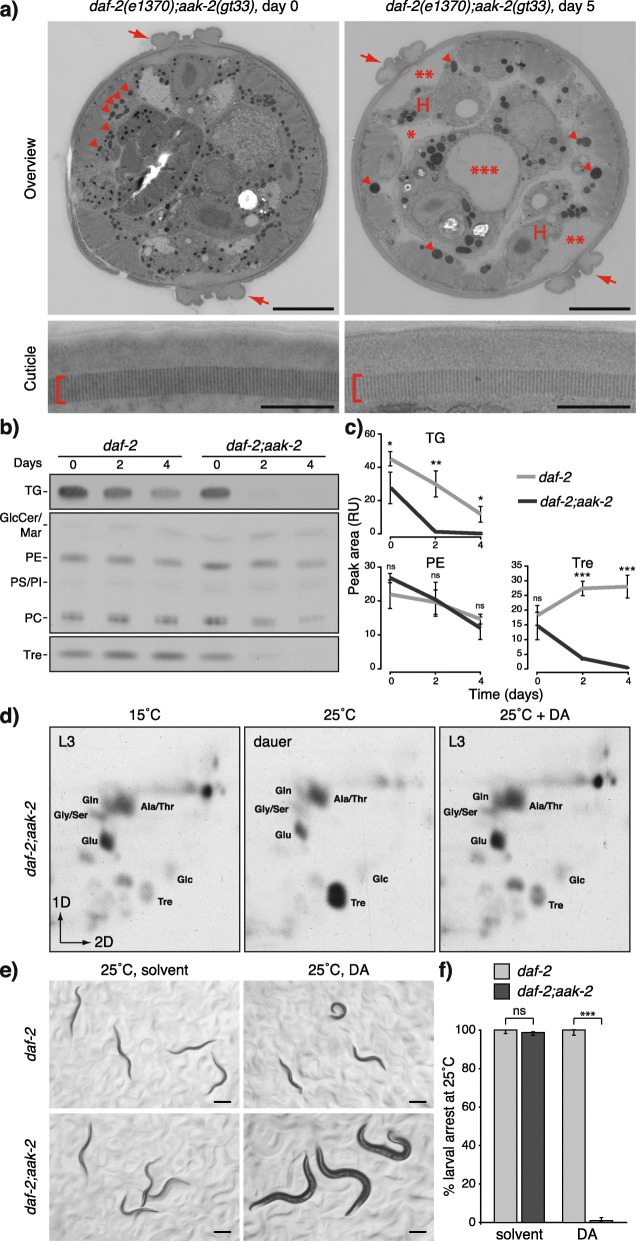
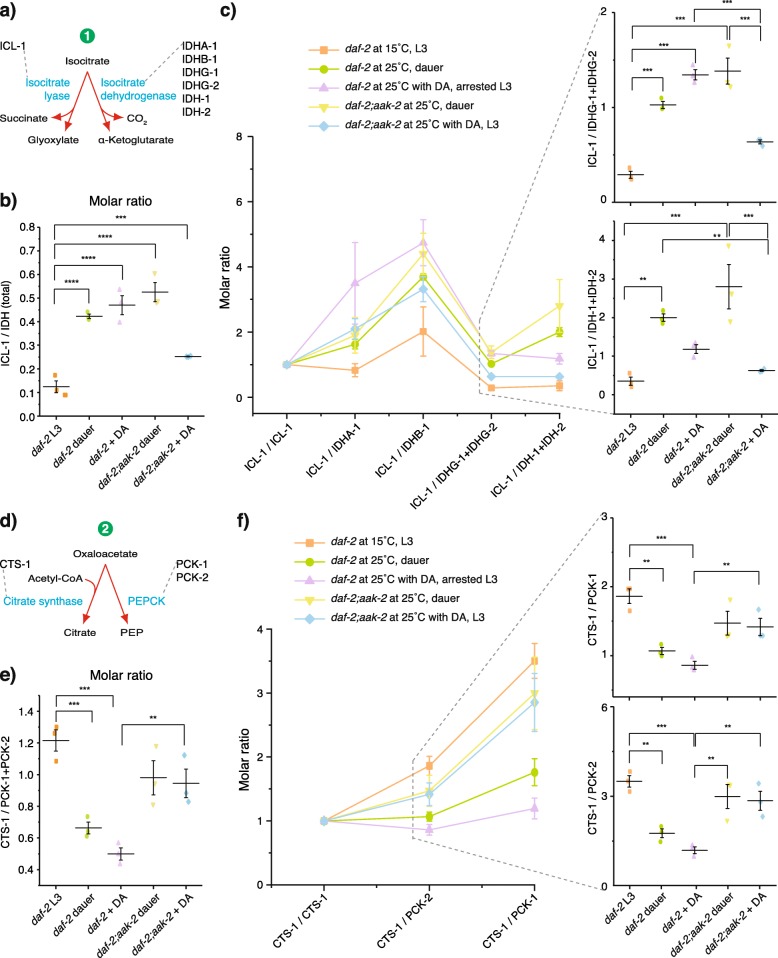
Background: Metabolic activity alternates between high and low states during different stages of an organism's life cycle. During the transition from growth to quiescence, a major metabolic shift often occurs from oxidative phosphorylation to glycolysis and gluconeogenesis. We use the entry of Caenorhabditis elegans into the dauer larval stage, a developmentally arrested stage formed in response to harsh environmental conditions, as a model to study the global metabolic changes and underlying molecular mechanisms associated with growth to quiescence transition.

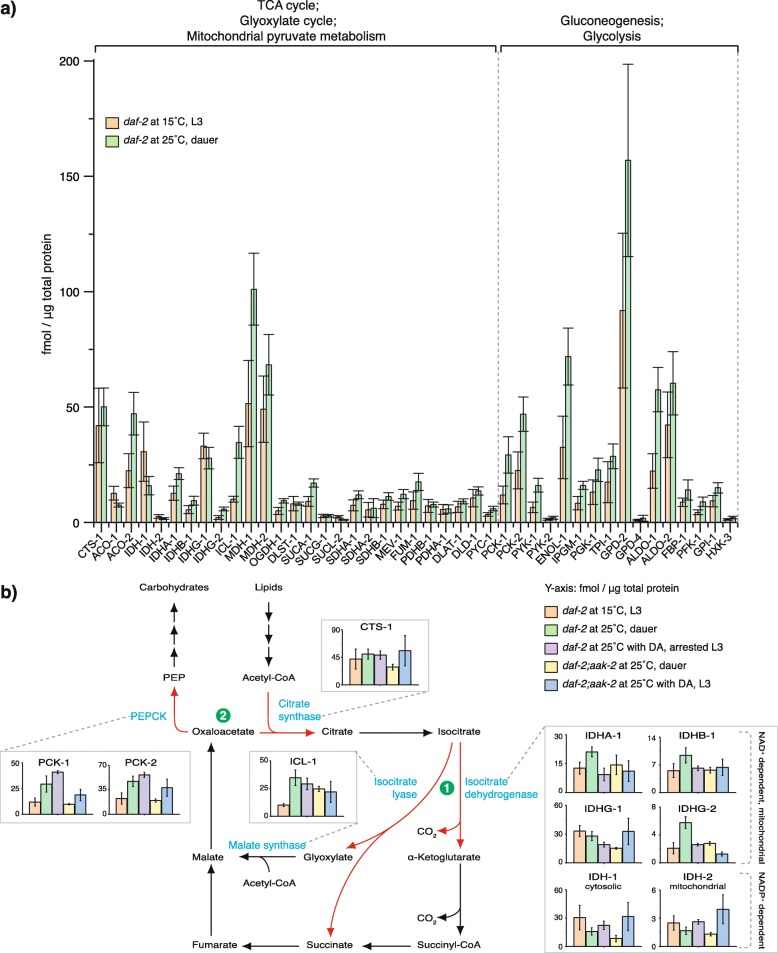
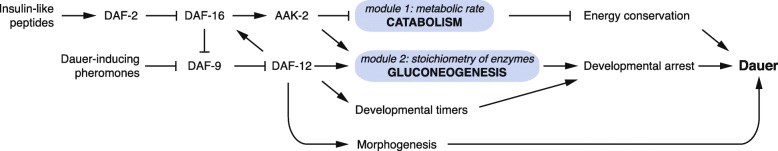
Results: Here, we show that the metabolic switch involves the concerted activity of several regulatory pathways. Whereas the steroid hormone receptor DAF-12 controls dauer morphogenesis, the insulin pathway maintains low energy expenditure through DAF-16/FoxO, which also requires AAK-2/AMPKα. DAF-12 and AAK-2 separately promote a shift in the molar ratios between competing enzymes at two key branch points within the central carbon metabolic pathway diverting carbon atoms from the TCA cycle and directing them to gluconeogenesis. When both AAK-2 and DAF-12 are suppressed, the TCA cycle is active and the developmental arrest is bypassed.

Conclusions: The metabolic status of each developmental stage is defined by stoichiometric ratios within the constellation of metabolic enzymes driving metabolic flux and controls the transition between growth and quiescence.


Conflict of interest statement

The authors declare that they have no competing interests.

Figures

Fig. 1
Fig. 1
DAF-16 mediates the switch to low metabolic rate in dauer formation but does not directly induce dauer morphogenesis. a Signaling pathways in dauer formation. In the absence of insulin-like peptides, DAF-2 is suppressed, leading to the activation of DAF-16. Dauer-inducing pheromones lower the production of DA (dafachronic acid) by DAF-9, resulting in activated DAF-12. DAF-16 stimulates DAF-12 by inhibiting DAF-9. DAF-12 also activates DAF-16. DAF-16 and DAF-12 control subsets of genes X′Y′Z′ and X″Y″Z″, respectively. b Continuous measurement of the heat flow by wild-type (N2) worms undergoing reproductive growth on cholesterol or dauer formation on 4-MS (4-methylated sterol). Median heat flow of biological replicates from one experiment, smoothed using generalized additive models. Additional file 1: Fig. S1a displays biological replicates from various experiments. c Formation of L3 arrested larvae of daf-2;daf-12 or DA-fed daf-2 at the restrictive temperature. Inhibition of DAF-2 activates DAF-16. DAF-16 inhibits DAF-9, but this effect is neutralized by daf-12 mutations or treatment with exogenous DA. d Heat flow of daf-2, daf-2;daf-12, and daf-2;daf-16 grown at 25 °C. Median heat flow of biological replicates from one experiment, smoothed using generalized additive models. Additional file 1: Fig. S1c displays biological replicates from various experiments. e Transmission electron micrographs of cross-sections of an L3 larva of daf-2 grown at 15 °C, a daf-2 dauer larva grown at 25 °C, and a daf-2;daf-12 arrested larva grown at 25 °C. Gut lumen: central panels and large rectangles in upper panels. Cuticle: lower panels and small rectangles in upper panels. Lipid droplets: arrowheads. Dauer-specific alae: arrows. Striated layer of dauer cuticle: bracket. Scale bars correspond to 5 μm (upper panels), 1 μm (central panels), and 0.5 μm (lower panels). Representative images of at least five animals per condition
Fig. 2
Fig. 2
DAF-16 determines the energy expenditure and lifespan of dauer larvae and, together with DAF-12, the switch to gluconeogenesis. a Cumulative heat dissipation of developmentally arrested daf-2 dauers and daf-2;daf-12 L3 larvae. Median heat of biological replicates from one experiment. Biological replicates from various experiments are displayed in Additional file 3: Fig. S3a. b Formation of dauer-like larvae of daf-16 on 4-MS. DAF-12 is activated due to a lack of DAs; however, DAF-16 activity is absent due to the mutation in the daf-16 locus. c Cumulative heat dissipation of developmentally arrested wild-type (N2) dauers and daf-16 dauer-like larvae on 4-MS. Median heat of biological replicates from one experiment. Biological replicates from various experiments are displayed in Additional file 3: Fig. S3b. d Coherent anti-Stokes Raman scattering (CARS) microscopy of lipid droplets in daf-2 dauers and daf-2;daf-12 arrested L3 larvae grown at 25 °C, and wild-type (N2) dauers and daf-16 dauer-like larvae grown on 4-MS. SHG, second harmonic generation. Representative images of at least 6 animals, scale bars 10 μm. e Survival rates of daf-2 dauers and daf-2;daf-12 arrested L3 larvae grown at 25 °C, and wild-type (N2) dauers and daf-16 dauer-like larvae grown on 4-MS. Means ± 95% confidence intervals of 3 experiments with 3 replicates. ***p < 0.001; ns, no significant difference determined by log-rank test. f 2D-TLC of 14C-acetate-labeled metabolites from daf-2 dauers and daf-2;daf-12 arrested larvae grown at 25 °C compared to L3 larvae grown at 15 °C. Representative images from at least 2 experiments. g 2D-TLC of 14C-acetate-labeled metabolites from wild-type (N2) dauers and daf-16 dauer-like larvae on 4-MS compared to L3 larvae on cholesterol. Representative images from at least 2 experiments. f, g Tre, trehalose; Glc, glucose; Glu, glutamate; Gly, glycine; Ser, serine; Gln, glutamine; Ala, alanine; Thr, threonine
Fig. 3
Fig. 3
AAK-2 regulates the catabolism, the gluconeogenic mode, and the developmental arrest in the dauer state. a Electron microscopy of daf-2(e1370);aak-2(gt33) collected on the day of the dauer formation or after 5 days of incubation at 25 °C on ample food source. Alae: arrows. Striated layer of the cuticle: brackets. Mitochondria: arrowheads. Starvation features: shrinkage of the hypodermis (H), expansion of the pseudocoelomic cavity (1 asterisk), a cavity between the cuticle and the hypodermis (2 asterisks), widening of the gut lumen (3 asterisks). Scale bars 5 μm (upper panels) and 0.5 μm (lower panels). Representative images of at least 4 animals. b TLC of 14C-acetate-labeled lipids and sugars from daf-2 and daf-2;aak-2 dauers measured at different time points after the arrest. TG, triglycerides; GlcCer, glucosylceramides; Mar, maradolipids; PE, phosphatidylethanolamines; PS, phosphatidylserines; PI, phosphatidylinositols; PC, phosphatidylcholines; Tre, trehalose. c Quantification of band intensities in some of the compounds in b represented by the peak area of the optical density in relative units (RU). Means ± SD of 2 experiments with 3 biological replicates. ***p < 0.001; **p < 0.01; *p < 0.1; ns, no significant difference determined by Student t test. d 2D-TLC of 14C-acetate-labeled metabolites from daf-2;aak-2 L3 larvae grown at 15 °C, dauers grown at 25 °C, and L3 larvae obtained at 25 °C in the presence of DA. DA, dafachronic acid; Tre, trehalose; Glc, glucose; Glu, glutamate; Gly, glycine; Ser, serine; Gln, glutamine; Ala, alanine; Thr, threonine. Representative images from at least 2 experiments. e Micrographs of daf-2 and daf-2;aak-2 animals grown at 25 °C in the presence or absence of DA. f Quantification of the larval arrest in e. Means ± 95% confidence intervals of 3 experiments with 3 replicates. ***p < 0.001; ns, no significant difference determined by one-way analysis of variance
Fig. 4
Fig. 4
The metabolic switch is achieved through the regulation of enzymes that work on branch points between competing pathways. a Absolute quantification of 43 enzymes of the TCA and glyoxylate cycle, mitochondrial pyruvate metabolism, gluconeogenesis, and glycolysis in daf-2 dauers grown at 25 °C compared to daf-2 L3 larvae at 15 °C. Means ± standard deviation of 3 biological replicates with 2 technical replicates each. b Schematic representation of the pathway that converts lipids to carbohydrates with absolute quantification of the enzymes that operate at the branch points in daf-2 L3 larvae at 15 °C and animals of daf-2 and daf-2;aak-2 grown at 25 °C with or without DA. Red arrows and green circles represent the competing reactions at the point of divergence between (1) TCA and glyoxylate pathway and (2) the recycling of oxaloacetate into the TCA/glyoxylate cycle or its entry into gluconeogenesis. Means ± standard deviation of 3 biological replicates with 2 technical replicates each. Additional file 9: Tab. S1 contains the molar abundances of all 43 proteins in biological replicates for all tested conditions
Fig. 5
Fig. 5
DAF-12 and AAK-2 control the molar ratios of the enzymes at the branch points between competing pathways. a Scheme of the first branch point—the entry of isocitrate into glyoxylate or TCA cycle. b Molar ratio between ICL-1 and the summed abundances of all isocitrate dehydrogenase isoforms and subunits, IDHA-1, IDHB-1, IDHG-1, IDHG-2, IDH-1, IDH-2, dubbed IDH (total). c Molar ratios between ICL-1 and individual isocitrate dehydrogenases. The sums of IDHG-1+IDHG-2 and IDH-1+IDH-2 are provided as a clearer representation due to the low molar abundance of IDHG-2 and IDH-2 compared to IDHG-1 and IDH-1, respectively. Lines between data points are provided for better visualization. d Scheme of the second branch point—the recycling of oxaloacetate into citrate or its entry into gluconeogenesis. e Molar ratio between CTS-1 and the summed abundances of the two PEPCK isoforms PCK-1 and PCK-2. f Molar ratio between CTS-1 and the individual PEPCK isoforms. Lines between data points are provided for better visualization. In all panels, means ± SD of 3 biological replicates with 2 technical replicates each; p values represent p > 0.05 (ns), *p ≤ 0.05, **p ≤ 0.01, ***p ≤ 0.001, ****p ≤ 0.0001. One-way ANOVA was performed with Holm-Bonferroni statistical method
Fig. 6
Fig. 6
Metabolic control in the transition to the dauer state. The model represents the genetic control of metabolic and developmental determinants of dauer formation and their interactions with respect to the establishment of the dauer state. The metabolic shift consists of two modules—module 1 comprises the overall metabolic rate, mainly reflecting the catabolism of energy reserves, and module 2 affects the stoichiometry of metabolic enzymes and, thus, the directionality of metabolic pathways. DAF-16 and AAK-2 inhibit catabolism and promote energy conservation required for the long-term survival of dauers. In parallel to DAF-12, they also promote a shift in the stoichiometry of metabolic enzymes that underlies the enhanced gluconeogenesis and stimulates developmental arrest. The latter occurs at the third larval stage due to the activity of developmental timers, controlled at least partly by DAF-12. The metabolic and physiologic adaptations for survival are complemented by the specific morphogenetic program under the control of DAF-12

References

    1. Hand SC, Denlinger DL, Podrabsky JE, Roy R. Mechanisms of animal diapause: recent developments from nematodes, crustaceans, insects, and fish. Am J Physiol Regul Integr Comp Physiol. 2016;310(11):R1193–R1211. doi: 10.1152/ajpregu.00250.2015. - DOI - PMC - PubMed
    1. Erkut C, Kurzchalia TV. The C. elegans dauer larva as a paradigm to study metabolic suppression and desiccation tolerance. Planta. 2015;242(2):389–396. doi: 10.1007/s00425-015-2300-x. - DOI - PubMed
    1. Smith DG, Sturmey RG. Parallels between embryo and cancer cell metabolism. Biochem Soc Trans. 2013;41(2):664–69. - PubMed
    1. Homem CC, Steinmann V, Burkard TR, Jais A, Esterbauer H, Knoblich JA. Ecdysone and mediator change energy metabolism to terminate proliferation in Drosophila neural stem cells. Cell. 2014;158(4):874–888. doi: 10.1016/j.cell.2014.06.024. - DOI - PubMed
    1. Ito K, Suda T. Metabolic requirements for the maintenance of self-renewing stem cells. Nat Rev Mol Cell Biol. 2014;15(4):243–256. doi: 10.1038/nrm3772. - DOI - PMC - PubMed

Publication types

MeSH terms

Substances

LinkOut - more resources