. 2020 Mar 18;12(1):48.
doi: 10.1186/s13148-020-00836-2.

Alterations in the methylome of the stromal tumour microenvironment signal the presence and severity of prostate cancer

Affiliations

Alterations in the methylome of the stromal tumour microenvironment signal the presence and severity of prostate cancer

Mitchell G Lawrence et al. Clin Epigenetics. .

Abstract

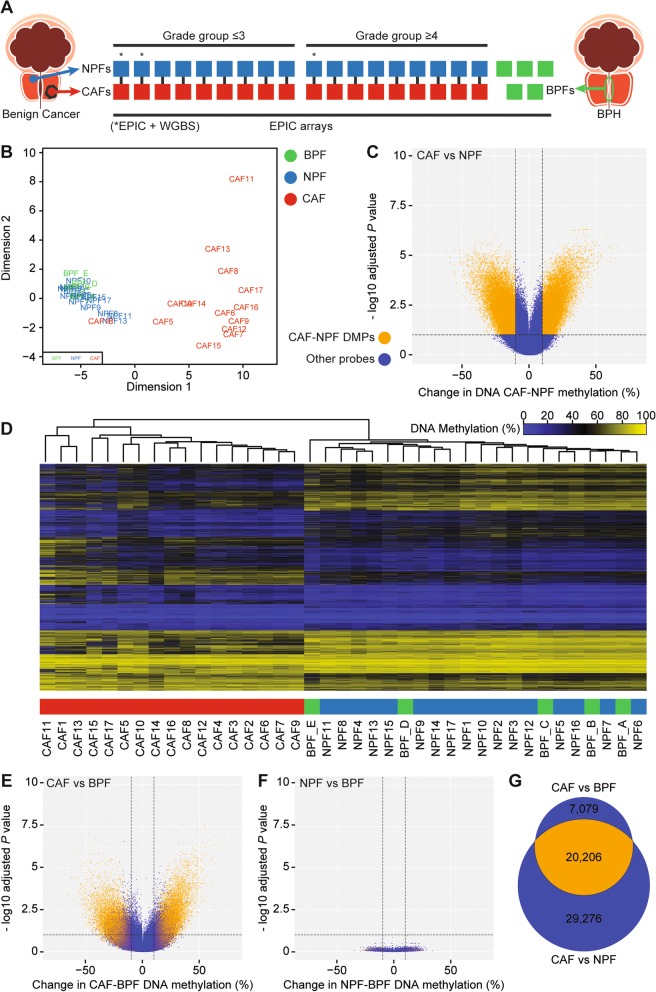
Background: Prostate cancer changes the phenotype of cells within the stromal microenvironment, including fibroblasts, which in turn promote tumour progression. Functional changes in prostate cancer-associated fibroblasts (CAFs) coincide with alterations in DNA methylation levels at loci-specific regulatory regions. Yet, it is not clear how these methylation changes compare across CAFs from different patients. Therefore, we examined the consistency and prognostic significance of genome-wide DNA methylation profiles between CAFs from patients with different grades of primary prostate cancer.

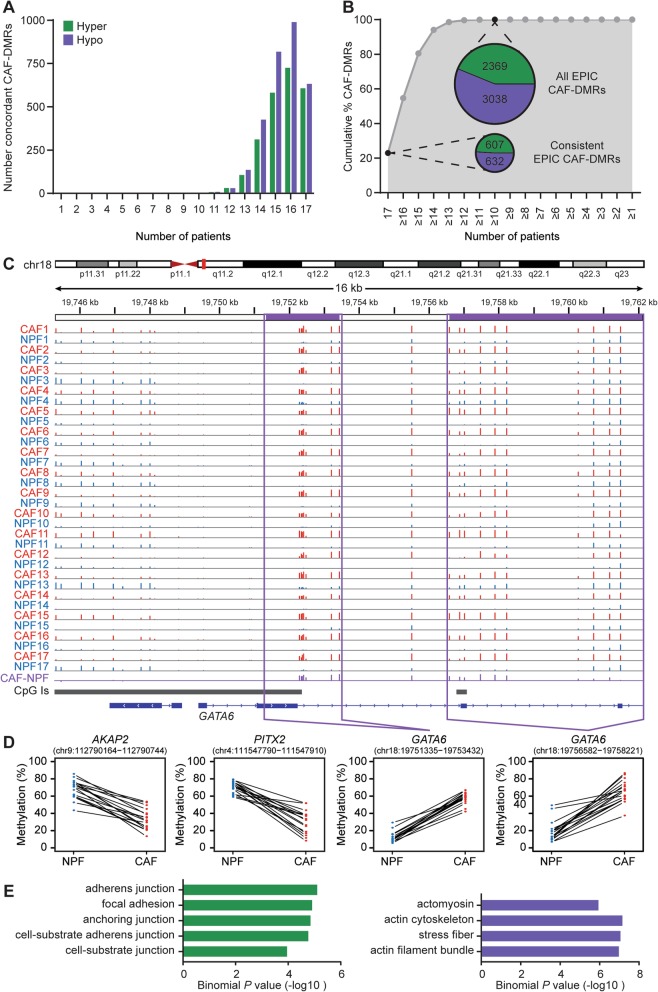
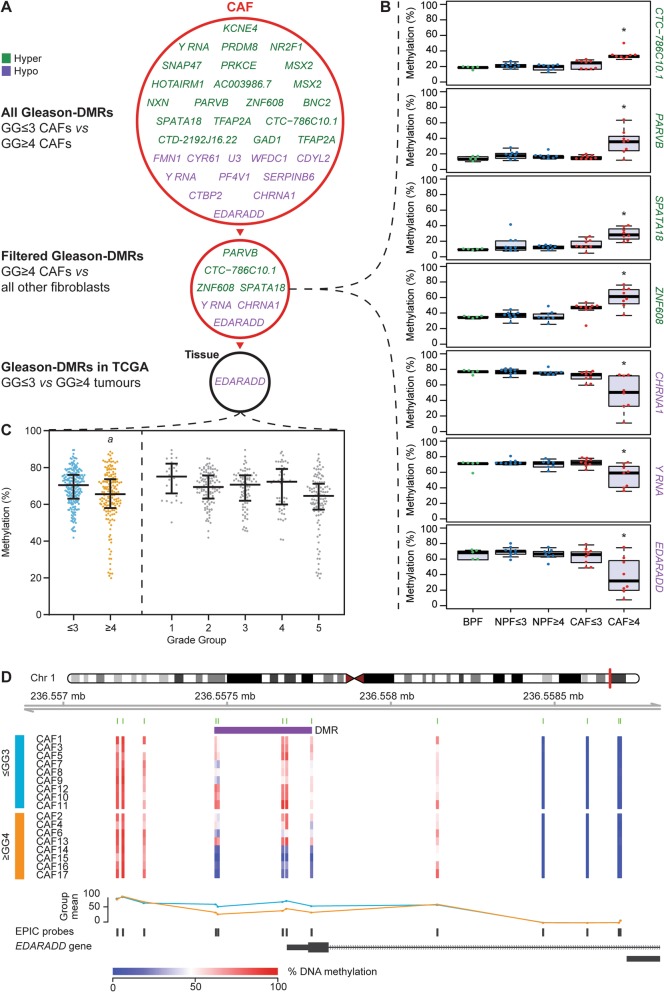
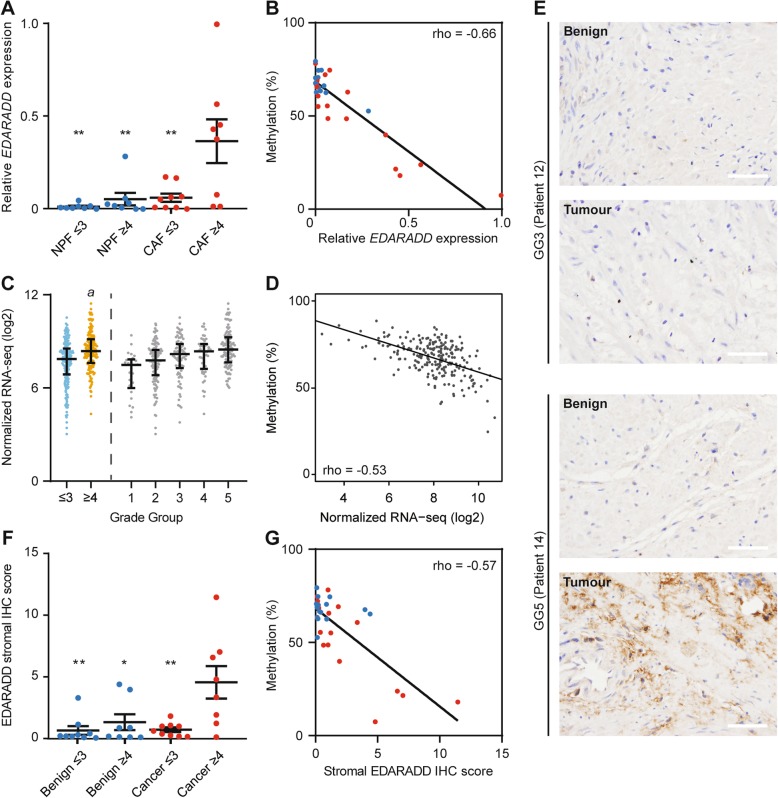
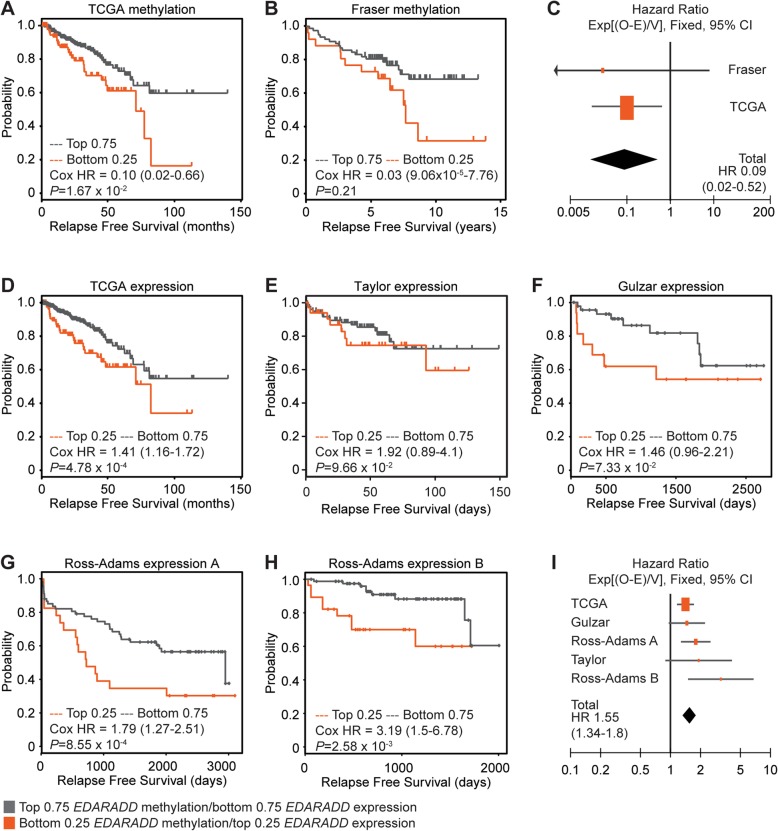
Results: We used Infinium MethylationEPIC BeadChips to evaluate genome-wide DNA methylation profiles from 18 matched CAFs and non-malignant prostate tissue fibroblasts (NPFs) from men with moderate to high grade prostate cancer, as well as five unmatched benign prostate tissue fibroblasts (BPFs) from men with benign prostatic hyperplasia. We identified two sets of differentially methylated regions (DMRs) in patient CAFs. One set of DMRs reproducibly differed between CAFs and fibroblasts from non-malignant tissue (NPFs and BPFs). Indeed, more than 1200 DMRs consistently changed in CAFs from every patient, regardless of tumour grade. The second set of DMRs varied between CAFs according to the severity of the tumour. Notably, hypomethylation of the EDARADD promoter occurred specifically in CAFs from high-grade tumours and correlated with increased transcript abundance and increased EDARADD staining in patient tissue. Across multiple cohorts, tumours with low EDARADD DNA methylation and high EDARADD mRNA expression were consistently associated with adverse clinical features and shorter recurrence free survival.

Conclusions: We identified a large set of DMRs that are commonly shared across CAFs regardless of tumour grade and outcome, demonstrating highly consistent epigenome changes in the prostate tumour microenvironment. Additionally, we found that CAFs from aggressive prostate cancers have discrete methylation differences compared to CAFs from moderate risk prostate cancer. Together, our data demonstrates that the methylome of the tumour microenvironment reflects both the presence and the severity of the prostate cancer and, therefore, may provide diagnostic and prognostic potential.

Keywords: Cancer-associated fibroblast; EPIC microarray; Field effect; Methylation; Prostate cancer; Stroma; Tumour microenvironment.


Conflict of interest statement

The authors declare that they have no competing interests.

Figures

Fig. 1
Fig. 1
Prostate cancer-associated fibroblasts have distinctive changes in DNA methylation. a Schematic of the cohort of patient-derived fibroblasts analysed with EPIC arrays. Asterisks denote that WGBS data was available for three pairs of CAFs and NPFs. b MDS plot of the 1000 most variably methylated CpGs in EPIC array data showing clear separation of CAFs from NPFs and BPFs in patients 4–17; however, CAF18 clustered with NPFs and BPFs. c Volcano plot of differentially methylated positions (DMPs) in CAFs versus NPFs (patients 4–17). DMPs are shown in orange, while other probes are in blue. For all volcano plots, dotted lines indicate > 10% change in methylation and −log10 adjusted P value > 1 (adjusted p value > 0.1). d Dendrogram and heat map from unsupervised hierarchical clustering of the EPIC CAF-DMRs showing clear separation of CAFs from NPFs and BPFs. e and f Volcano plots of DMPs in CAFs versus BPFs and NPFs versus BPFs. DMPs from CAFs versus NPFs (panel c) are shown in orange. g Venn diagram showing the overlap between DMPs in CAFs versus NPFs compared to CAFs versus BPFs
Fig. 2
Fig. 2
Consistently differentially methylated regions across patients in CAFs versus NPFs. a Graph showing the number of EPIC CAF-DMRs that are concordantly differentially methylated in the expected direction in each number of patients. b Graph showing the cumulative percentage of EPIC CAF-DMRs that are concordantly differentially methylated in the expected direction in each number of patients. Inset pie charts show the number of concordant EPIC CAF-DMRs in 17/17 patients (22.0% of DMRs) and 10/17 patients (100% of DMRs). c EPIC data for the GATA6 gene for each NPF (blue) and CAF (red). The average difference in DNA methylation in CAFs compared to NPFs is shown in purple. The height of each vertical line represents the percentage of DNA methylation at each CpG site. Purple boxes show the site of two EPIC CAF-DMRs. d Graphs showing DNA methylation levels in each NPF and CAF for representative hypomethylated (AKAP2 and PITX2) and hypermethylated (GATA6) consistent EPIC CAF-DMRs. Lines connect each patient-matched pair of fibroblasts. For each sample, the percentage of DNA methylation is averaged across CpG sites within each DMR. e Plots showing −log10 binomial P values of pathways within the cellular content category that were enriched in GREAT analysis of hypermethylated (green) and hypomethylated (purple) consistent EPIC CAF-DMRs
Fig. 3
Fig. 3
EDARADD is hypomethylated in CAFs from high-grade group prostate cancer. a Schematic of genes proximal to Gleason-DMRs in CAFs from GG ≤ 3 versus GG ≥ 4 prostate cancer. Gleason-DMRs that are hypermethylated in GG ≥ 4 CAFs are shown in green, while Gleason-DMRs that are hypomethylated in GG ≥ 4 CAFs are shown in purple. Seven of these Gleason-DMRs were also differentially methylated in GG ≥ 4 CAFs versus all other groups of fibroblasts (see panel b). Of these Gleason-DMRs, EDARADD was also significantly differentially methylated in GG ≥ 4 versus GG ≤ 3 tissues from TCGA (see panel c). b Boxplots showing DNA methylation of Gleason-DMRs in different groups of fibroblasts. Each dot represents a different fibroblast sample (*P < 0.05 One-way ANOVA GG ≥ 4 CAF vs all other groups). c Plot of EDARADD DNA methylation levels in patient tissue samples from TCGA. Samples are arranged as GG ≤ 3 versus GG ≥ 4 prostate cancer (aP = 8.3 × 10⁻⁵, diff = − 5.2%, Mann-Whitney test) and as individual grade groups. Each dot represents a different patient, with lines indicating median and ± IQR. d Schematic of the EDARADD Gleason-DMR showing the levels of DNA methylation at each CpG site in each CAF (blue = low methylation; red = high methylation). The trend lines show the average methylation status of GG ≤ 3 CAFs (light blue) versus GG ≥ 4 CAFs (orange). The location of the Gleason-DMR is shown in purple
Fig. 4
Fig. 4
EDARADD expression is increased in high-grade prostate cancer and correlated with DNA methylation. a Plot showing the average expression of EDARADD (± SEM) in each group of NPFs (blue) and CAFs (red). There was significantly higher mRNA abundance in ≥ GG4 CAFs versus each other fibroblast group (**P < 0.01 One-way ANOVA with Tukey post hoc analysis). b Scatter plot showing the significant negative correlation between EPIC data for EDARADD DNA methylation and qRT-PCR data for EDARADD mRNA abundance (Spearman correlation, P < 0.0001). Each dot represents a different fibroblast sample. c Plot of RNA-seq data showing higher EDARADD expression in ≥ GG4 versus ≤ GG3 prostate cancer specimens from TCGA (b logFC between GG1-3 vs GG4-5 = 1.57, genome-wide adjusted P = 6.9 × 10−07, generalized linear model using edgeR). d Scatter plot of matching EDARADD 450K DNA methylation data and RNA-seq data from TCGA showing a significant negative correlation (Spearman correlation, P = 3.2 × 10¹⁷). e Representative images of immunohistochemistry (IHC) for EDARADD in matched benign and tumour tissues. Scale bars equal 50 μm. f Plot of the average EDARADD stromal IHC score (± SEM) in each group of patient tissues. There was significantly higher EDARADD staining in ≥ GG4 tumours versus ≤ GG3 tumours and benign samples (*P < 0.05, **P < 0.01 One-way ANOVA with Tukey post hoc analysis). g Scatter plot showing the significant negative correlation between EDARADD DNA methylation in fibroblasts and the stromal EDARADD IHC score in matching patient tissues (Spearman correlation, P = 0.0006)
Fig. 5
Fig. 5
EDARADD methylation and expression are associated with poor relapse-free survival in prostate cancer cohorts. a, b Kaplan Meier plots of relapse free survival for patients in the lowest quartile of EDARADD methylation (bottom 0.25, orange) versus the rest of each cohort (top 0.75, grey). c Forest plot showing the Cox hazard ratios (± 95% CI) for relapse free survival based on EDARADD methylation and a meta-analysis of both methylation datasets (Heterogeneity: Chi2 = 0.09, df = 1 (P = 0.76); I2 = 0%; Test for overall effect: Z = 3.14 (P = 0.002)). dh Kaplan Meier plots of relapse free survival for patients in the highest quartile of EDARADD expression (top 0.25, orange) versus the rest of each cohort (bottom 0.75, grey) for the TCGA and Fraser datasets. i Forest plot showing the Cox hazard ratios (± 95% CI) for relapse-free survival based on EDARADD expression and a meta-analysis of all methylation datasets (Heterogeneity: Chi2 = 5.45, df = 4 (P = 0.24); I2 = 27%; Test for overall effect: Z = 5.74 (P < 0.00001))

References

    1. Franco OE, Hayward SW. Targeting the tumor stroma as a novel therapeutic approach for prostate cancer. Adv Pharmacol. 2012;65:267–313. doi: 10.1016/B978-0-12-397927-8.00009-9. - DOI - PubMed
    1. Ao M, Franco OE, Park D, Raman D, Williams K, Hayward SW. Cross-talk between paracrine-acting cytokine and chemokine pathways promotes malignancy in benign human prostatic epithelium. Cancer Res. 2007;67(9):4244–4253. doi: 10.1158/0008-5472.CAN-06-3946. - DOI - PubMed
    1. Akerfelt M, Bayramoglu N, Robinson S, Toriseva M, Schukov HP, Harma V, Virtanen J, Sormunen R, Kaakinen M, Kannala J, et al. Automated tracking of tumor-stroma morphology in microtissues identifies functional targets within the tumor microenvironment for therapeutic intervention. Oncotarget. 2015;6(30):30035–30056. doi: 10.18632/oncotarget.5046. - DOI - PMC - PubMed
    1. Cheteh EH, Augsten M, Rundqvist H, Bianchi J, Sarne V, Egevad L, Bykov VJ, Ostman A, Wiman KG. Human cancer-associated fibroblasts enhance glutathione levels and antagonize drug-induced prostate cancer cell death. Cell Death Dis. 2017;8(6):e2848. doi: 10.1038/cddis.2017.225. - DOI - PMC - PubMed
    1. Kato M, Placencio-Hickok VR, Madhav A, Haldar S, Tripathi M, Billet S, Mishra R, Smith B, Rohena-Rivera K, Agarwal P, et al. Heterogeneous cancer-associated fibroblast population potentiates neuroendocrine differentiation and castrate resistance in a CD105-dependent manner. Oncogene. 2018. - PMC - PubMed

Publication types

MeSH terms

Substances