. 2020 Apr;30(4):635-646.
doi: 10.1101/gr.256255.119. Epub 2020 Mar 18.

Inhibition of transcription leads to rewiring of locus-specific chromatin proteomes

Affiliations

Inhibition of transcription leads to rewiring of locus-specific chromatin proteomes

Deepani W Poramba-Liyanage et al. Genome Res. 2020 Apr.

Abstract

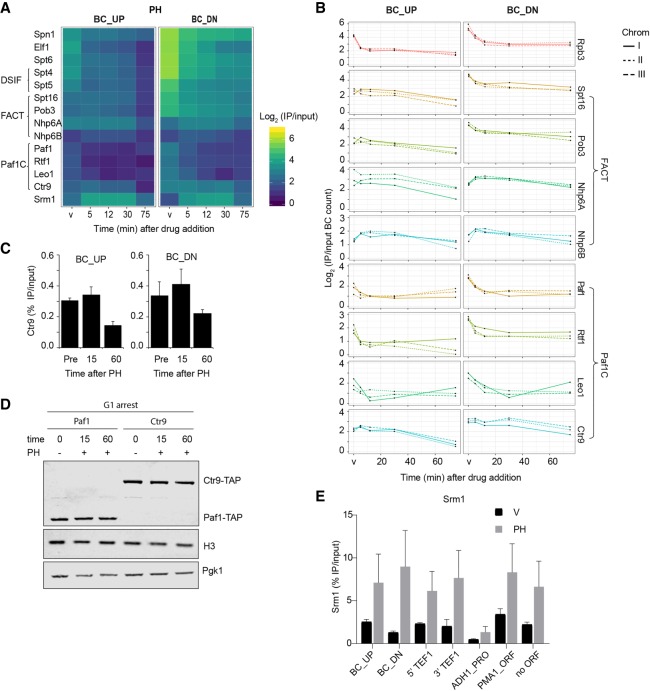
Transcription of a chromatin template involves the concerted interaction of many different proteins and protein complexes. Analyses of specific factors showed that these interactions change during stress and upon developmental switches. However, how the binding of multiple factors at any given locus is coordinated has been technically challenging to investigate. Here we used Epi-Decoder in yeast to systematically decode, at one transcribed locus, the chromatin binding changes of hundreds of proteins in parallel upon perturbation of transcription. By taking advantage of improved Epi-Decoder libraries, we observed broad rewiring of local chromatin proteomes following chemical inhibition of RNA polymerase. Rapid reduction of RNA polymerase II binding was accompanied by reduced binding of many other core transcription proteins and gain of chromatin remodelers. In quiescent cells, where strong transcriptional repression is induced by physiological signals, eviction of the core transcriptional machinery was accompanied by the appearance of quiescent cell-specific repressors and rewiring of the interactions of protein-folding factors and metabolic enzymes. These results show that Epi-Decoder provides a powerful strategy for capturing the temporal binding dynamics of multiple chromatin proteins under varying conditions and cell states. The systematic and comprehensive delineation of dynamic local chromatin proteomes will greatly aid in uncovering protein-protein relationships and protein functions at the chromatin template.


Figures

Figure 1.
Figure 1.
Outline of expanded and optimized Epi-Decoder analysis. (A) Three Epi-Decoder-HO libraries were generated by crossing the TAP-tag library to an expanded HO-BC library in three different ways to combine each TAP-tag protein with three independent barcodes (BCs) (see also Supplemental Fig. S1A). The HO-BC locus consists of a constitutively expressed 1.5-kb KanMX resistance gene integrated at the HO locus, controlled by the heterologous AgTEF1 promoter and terminator from Ashbya gossypii, and flanked by a promoter-proximal BC_UP and a terminator-proximal BC_DN. Downstream from BC_DN lies an origin of replication (ARS404). (B) Clones of each Epi-Decoder-HO library are combined and processed in two separate pools and used for ChIP of TAP-tagged proteins (spheres with black handle). The BCs (colored lines), which flank the KanMX reporter gene (gray box) at the HO locus, are amplified from ChIP and input and indexed, allowing for the pools to be combined and counted by massive parallel sequencing. The relative BC count (IP/input) reports on protein abundance of each TAP-tagged protein (approximately 4250) at the barcoded locus. (C) Comparison of the binding scores (IP/input) of both BC_UP and BC_DN of chromatin binders (as determined previously by Korthout et al. 2018) in the three Epi-Decoder-HO libraries. Indicated are the Spearman’s correlation coefficients, and the diagonal line represents x = y. Density plots show the distribution of the BC counts in each of the three replicates. For counts of all proteins examined, see Supplemental Table S1. The results for BC_UP and BC_DN separately are shown in Supplemental Figure S1, B and C.
Figure 2.
Figure 2.
Chromatin-proteome dynamics at the Barcoded-HO locus upon chemical inhibition of transcription. (A) Three versions of the chromatin TAP-tag subset, each containing a unique set of BC pairs, were combined into one pool (Chrom-3×BC). The culture was incubated with a-factor pheromone to synchronize the cells in G1, after which PH or AU was added and samples were collected at the time points indicated for Epi-Decoder analysis, RNA analysis, and flow cytometry. A sample treated with vehicle was collected at the last time point, and a control sample was taken of a G1-arrested culture without treatment. All experiments were performed at 16°C to facilitate capturing dynamic binding events. (B) Analysis of mRNA changes over time by RT-qPCR confirmed the decay of most transcripts and an increase in the PH-responsive ZRT1 gene under conditions shown in panel A. RNA levels are relative to untreated (Pre) and normalized to a transcript from a spike-in of untreated Schizosaccharomyces pombe cells (see Methods) to correct for global changes (mean of three biological replicates ± SD). (C) Heatmap of the binding scores (mean IP/input of three biological replicates) of selected proteins with a binding score >0.5 at any of the four local proteome time series indicated. For mean binding scores of all proteins examined in the Chrom-3×BC library, see Supplemental Table S2. Proteins were manually clustered and ranked in functional subcategories.
Figure 3.
Figure 3.
Treatment with phenanthroline (PH) leads to rapid loss of Pol II and transcription-associated proteins. (A) Differential and dynamic binding behavior of proteins representing different chromatin processes upon treatment with PH and AU. The lines indicate the three different BC pairs of the indicated TAP-tagged proteins in the Chrom-3×BC library (Log2 IP/input at time points indicated in Fig. 2). (B) Zoom-in of heatmap of Figure 2 showing the Pol II subunits present in the library. (C,D) Immunoblot analysis of the largest subunit of Pol II (Rpo21-TAP) with and without PH and AU treatment in G1-arrested cells at 16°C. Pgk1, Hmo1, and a nonspecific band (*) were used as loading controls. (E) ChIP-qPCR analysis of Rpo21 binding at the BC_UP and BC_DN regions in G1-arrested cells treated with (15 and 60 min) and without (Pre) PH at 16°C (average of three biological replicates ± SD).
Figure 4.
Figure 4.
Differential response of transcription elongation factors to chemical inhibition of Pol II. (A) Zoom-in on the heatmap of Figure 2 (PH treatment), showing proteins annotated to transcription elongation. (B) Independent replicates of proteins related to FACT and Paf1C (Log2 IP/input at time points as in Fig. 2). The lines show the three different BC pairs of the indicated TAP-tagged proteins in the Chrom-3×BC library. (C) ChIP-qPCR analysis of Ctr9 binding at the BC_UP and BC_DN regions in G1-arrested cells treated with (15 and 60 min) and without (Pre) PH at 16°C (average of three biological replicates ± SD). (D) Immunoblot analysis of Ctr9-TAP and Paf1-TAP with and without PH treatment in G1-arrested cells at 16°C. Pgk1 and H3 were used as loading controls. (E) ChIP-qPCR analysis of Srm1 binding in G1-arrested cells at 16°C, treated for 15 min with vehicle (V) or PH (average of three biological replicates ± SD). Analyzed loci are the BC_UP and BC_DN regions, the 5′ and 3′ end of the endogenous TEF1 gene, the ADH1 promoter, the PMA1 open reading frame, and a nontranscribed locus (for more details, see Supplemental Table S5; van Welsem et al. 2018).
Figure 5.
Figure 5.
Chromatin-proteome rewiring upon transcriptional repression in quiescence. (A) Heatmap of the HO Epi-Decoder binding scores in mid-log, Q, and NQ cells (mean IP/input of three biological replicates). For mean binding scores of all proteins examined in the Chrom-3×BC library, see Supplemental Table S3. Proteins were manually clustered and ranked in functional subcategories as in Figure 2C. (BE) Zoom-in of heatmap of panel A (promoter region BC_UP, except replication for which terminator BC_DN next to the origin of replication was used) showing proteins in the indicated annotated clusters. PH treatment during G1 arrest (vehicle, 5 and 12 min) is shown for comparison.

References

    1. Adams CC, Gross DS. 1991. The yeast heat shock response is induced by conversion of cells to spheroplasts and by potent transcriptional inhibitors. J Bacteriol 173: 7429–7435. 10.1128/JB.173.23.7429-7435.1991 - DOI - PMC - PubMed
    1. Allen C, Büttner S, Aragon AD, Thomas JA, Meirelles O, Jaetao JE, Benn D, Ruby SW, Veenhuis M, Madeo F, et al. 2006. Isolation of quiescent and nonquiescent cells from yeast stationary-phase cultures. J Cell Biol 174: 89–100. 10.1083/jcb.200604072 - DOI - PMC - PubMed
    1. Aparicio OM, Weinstein DM, Bell SP. 1997. Components and dynamics of DNA replication complexes in S. cerevisiae: redistribution of MCM proteins and Cdc45p during S phase. Cell 91: 59–69. 10.1016/S0092-8674(01)80009-X - DOI - PubMed
    1. Aragon AD, Rodriguez AL, Meirelles O, Roy S, Davidson GS, Tapia PH, Allen C, Joe R, Benn D, Werner-Washburne M. 2008. Characterization of differentiated quiescent and nonquiescent cells in yeast stationary-phase cultures. Mol Biol Cell 19: 1271–1280. 10.1091/mbc.e07-07-0666 - DOI - PMC - PubMed
    1. Bell SP, Labib K. 2016. Chromosome duplication in Saccharomyces cerevisiae. Genetics 203: 1027–1067. 10.1534/genetics.115.186452 - DOI - PMC - PubMed

Publication types

LinkOut - more resources