. 2020 Apr;30(4):622-634.
doi: 10.1101/gr.257063.119. Epub 2020 Mar 18.

Time course regulatory analysis based on paired expression and chromatin accessibility data

Affiliations

Time course regulatory analysis based on paired expression and chromatin accessibility data

Zhana Duren et al. Genome Res. 2020 Apr.

Abstract

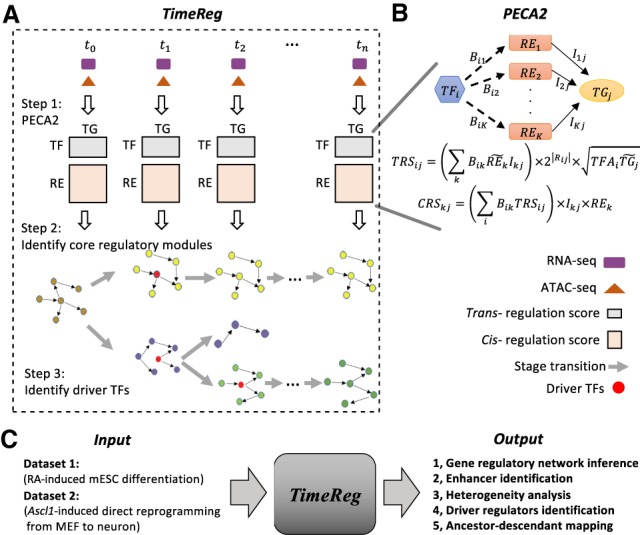
A time course experiment is a widely used design in the study of cellular processes such as differentiation or response to stimuli. In this paper, we propose time course regulatory analysis (TimeReg) as a method for the analysis of gene regulatory networks based on paired gene expression and chromatin accessibility data from a time course. TimeReg can be used to prioritize regulatory elements, to extract core regulatory modules at each time point, to identify key regulators driving changes of the cellular state, and to causally connect the modules across different time points. We applied the method to analyze paired chromatin accessibility and gene expression data from a retinoic acid (RA)-induced mouse embryonic stem cells (mESCs) differentiation experiment. The analysis identified 57,048 novel regulatory elements regulating cerebellar development, synapse assembly, and hindbrain morphogenesis, which substantially extended our knowledge of cis-regulatory elements during differentiation. Using single-cell RNA-seq data, we showed that the core regulatory modules can reflect the properties of different subpopulations of cells. Finally, the driver regulators are shown to be important in clarifying the relations between modules across adjacent time points. As a second example, our method on Ascl1-induced direct reprogramming from fibroblast to neuron time course data identified Id1/2 as driver regulators of early stage of reprogramming.


Figures

Figure 1.
Figure 1.
Schematic overview of Time Course Regulatory Analysis (TimeReg) based on paired gene expression and chromatin accessibility data. (A) TimeReg proposes a three-step framework to infer a high-quality gene regulatory network. Step 1: PECA2 infers context-specific GRN from matched ATAC-seq and RNA-seq data at a single time point to output TF-TG and RE-TG regulatory matrix. Step 2: NMF decomposes the regulatory matrix and extracts the core regulatory modules at each time point. Step 3: Driver regulators are identified (Methods). (B) Overview of PECA2 method. (C) Schematic overview of the major results on two data sets.
Figure 2.
Figure 2.
Genome-wide profiling of gene expression and chromatin accessibility during RA induction reveals landscape for RA-driven lineage transition. (A) Schematic outline of study design. (B,C) PCA and heat map of the Pearson's correlation matrix on ATAC-seq data. (D,E) PCA and heatmap of the Pearson's correlation matrix on RNA-seq data. (F) Enriched GO terms in the top 200 specific genes at each time point. The horizontal axis is −log10(P-value) and the number behind the bar represents fold enrichment.
Figure 3.
Figure 3.
PECA2 infers accurate gene regulation supported by ChIP-seq, shRNA knockdown, and HiChIP experiments. (A) Comparison of PECA2 TRS with ChIP-seq experiment on five important regulators in mESC by taking the knockdown data as ground truth. Shapes represent different transcription factors and colors represent different methods. Red represents results from PECA2 and black represents results from ChIP-seq experiment. (B) Conservation score distribution comparison between REs predicted to regulate at least one gene and randomly selected REs. (C,D) Validation of PECA2 predicted RE-TG pairs by the HiChIP experiment on mESC and RA D4. Background RE-TG pairs are randomly selected to have the same distance distribution as the predicted RE-TG pairs. “Fold” represents fold change of average read count of predicted RE-TG pairs versus background RE-TG pairs.
Figure 4.
Figure 4.
Identification and annotation of novel enhancers. (A) Pie charts of the promoter, known enhancers, and novel enhancers in REs. (B) Bar plot of numbers of known enhancers and novel enhancers at different time points. (C) Conservation score distribution of different sets of REs. (D) Comparison of GO enrichment on known enhancers’ targets and novel enhancers’ targets on D10. Top 500 specifically expressed genes in each group are chosen to perform GO analysis. The x-axis represents enrichment score on known enhancers’ targets, and the y-axis represents that on novel enhancers’ targets. Each dot represents one GO term. The enrichment score is defined as the geometric mean of fold change and −log10 P-value.
Figure 5.
Figure 5.
Core regulatory modules extracted from gene regulatory networks are supported by subpopulation from single-cell RNA-seq data. (A) Heatmap of reordered normalized TRS scores at D2 to D20. The black line represents the detected modules from NMF. (B) Heatmap of D4 normalized TRS on selected specific genes and TFs. (C) Mean expression pattern of genes from three different modules of RA D4 on the developmental stage of seven tissues. (D) Mean expression pattern of genes from three different modules of RA D4 on RA time course. (E) Distribution of RA D4 top 500 module-specific genes’ maximum expressed subpopulations from single-cell RNA-seq data.
Figure 6.
Figure 6.
Core regulatory modules decompose the mixture populations consistently across time points. (A) Jaccard similarity of modules between neighboring time points. Line width represents the Jaccard similarity, and the similarity value is labeled on the line if it is >0.1. (B) GO analysis on modules at each time points. Top 100 specifically expressed genes of each module at each time point are selected for GO enrichment analysis. The x-axis represents time points, and the y-axis represents fold enrichment. The size of circles represents the enrichment P-value. (C) Mean expression pattern of genes from D10_Module1 and D10_Module4 on developmental stage of seven tissues. (D) Mean expression pattern of genes from D10_Module1 and D10_Module4 on RA time course. (E) Expression pattern of the glial marker gene Gfap on RA time course. (F) Heatmap of D10 normalized TRS on selected specific genes and TFs.
Figure 7.
Figure 7.
Identification of driver regulators reveals ancestor–descendant fates for regulatory modules. (A) Driver regulators of D2_Module1, D2_Module2, and D2_Module3. The x-axis is log2 fold change; the y-axis is −log10(P-value). (B) Distribution comparison of Rxra’s PCC with up-regulated genes and randomly selected genes. (C) Distribution comparison of RXRA’s motif enrichment on REs of up-regulated genes and randomly selected genes. (D) Distribution of D10_Module4 driver TF expression (blue bar) and their RE openness (red bar) on D4. Expression or openness greater than the median are labeled as “Expressed,” less than decile are labeled as “Not exp,” and the remaining are labeled as “Low exp.” (E) Distribution of Z-score of TRS between top 50 module-specific TFs and driver TFs of D10_Module4. (F) Expression distribution of the Module4's driver regulators on D4 scRNA-seq data. Columns represent subpopulations identified from scRNA-seq data.
Figure 8.
Figure 8.
TimeReg suggests the developmental trajectory of the subpopulations for RA-driven lineage transition. Schematic overview of the subpopulations at each stage. The gray line represents the similarity of neighboring regulatory modules. The orange line represents the ancestor–descendant mapping among regulatory modules. TFs on the orange lines represent the important driver regulators causally connecting the modules.
Figure 9.
Figure 9.
TimeReg analysis on direct reprogramming from fibroblast to neuron. (A) Heatmap of reordered normalized TRS scores at day 2. The black line represents the detected modules from NMF. (B) t-SNE plot of single-cell RNA-seq data. Color represents clustering label. (C) Distribution of day 2 top 500 module-specific genes’ maximum-expressed subpopulations from single-cell RNA-seq data. (D,E) Expression of module-specific genes on t-SNE plot. (F,G) Module 1–specific genes are enriched in ASCL1 ChIP-seq target genes. (H) List of driver regulators of Module 1 in day 2.

References

    1. Bansal M, Gatta GD, Di Bernardo D. 2006. Inference of gene regulatory networks and compound mode of action from time course gene expression profiles. Bioinformatics 22: 815–822. 10.1093/bioinformatics/btl003 - DOI - PubMed
    1. Brunet JP, Tamayo P, Golub TR, Mesirov JP. 2004. Metagenes and molecular pattern discovery using matrix factorization. Proc Natl Acad Sci 101: 4164–4169. 10.1073/pnas.0308531101 - DOI - PMC - PubMed
    1. Buenrostro JD, Giresi PG, Zaba LC, Chang HY, Greenleaf WJ. 2013. Transposition of native chromatin for fast and sensitive epigenomic profiling of open chromatin, DNA-binding proteins and nucleosome position. Nat Methods 10: 1213–1218. 10.1038/nmeth.2688 - DOI - PMC - PubMed
    1. Cao S, Yu S, Li D, Ye J, Yang X, Li C, Wang X, Mai Y, Qin Y, Wu J, et al. 2018. Chromatin accessibility dynamics during chemical induction of pluripotency. Cell Stem Cell 22: 529–542.e5. 10.1016/j.stem.2018.03.005 - DOI - PubMed
    1. Chen J, Kubalak SW, Chien KR. 1998. Ventricular muscle-restricted targeting of the RXRα gene reveals a non-cell-autonomous requirement in cardiac chamber morphogenesis. Development 125: 1943–1949. - PubMed

Publication types

MeSH terms