. 2020 Mar 18;10(1):4941.
doi: 10.1038/s41598-020-61723-7.

Evaluation of bile salt hydrolase inhibitor efficacy for modulating host bile profile and physiology using a chicken model system

Affiliations

Evaluation of bile salt hydrolase inhibitor efficacy for modulating host bile profile and physiology using a chicken model system

Wenjing Geng et al. Sci Rep. .

Abstract

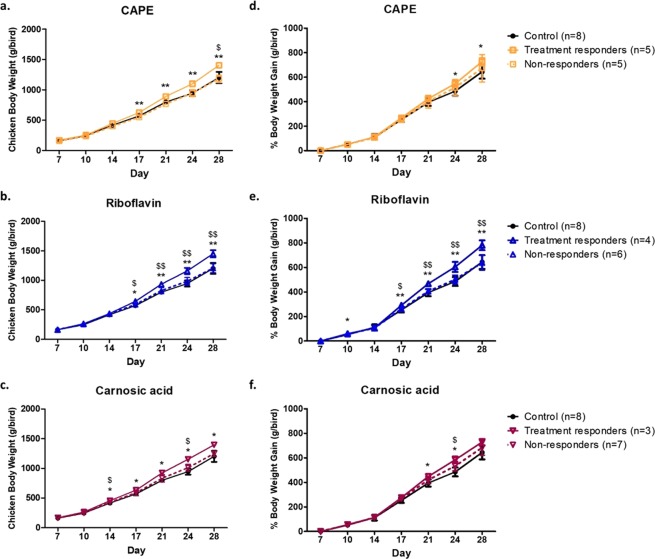
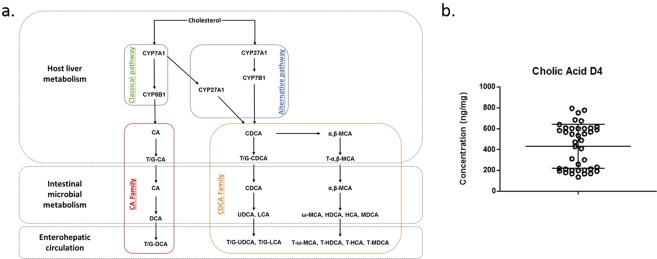
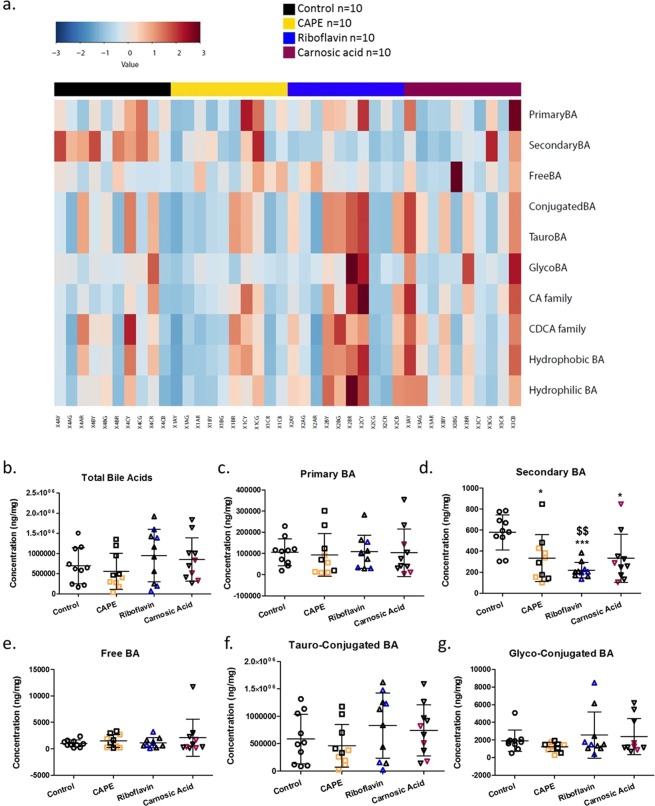
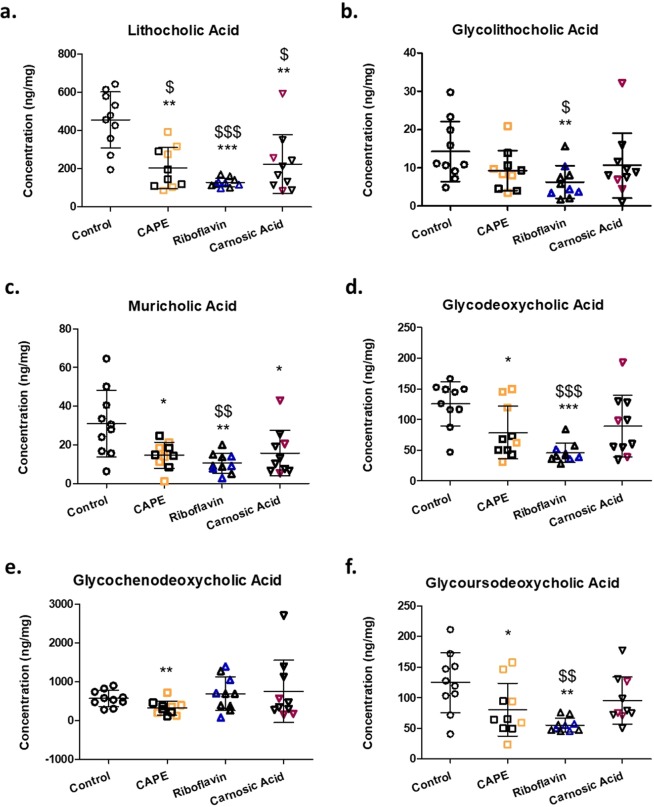
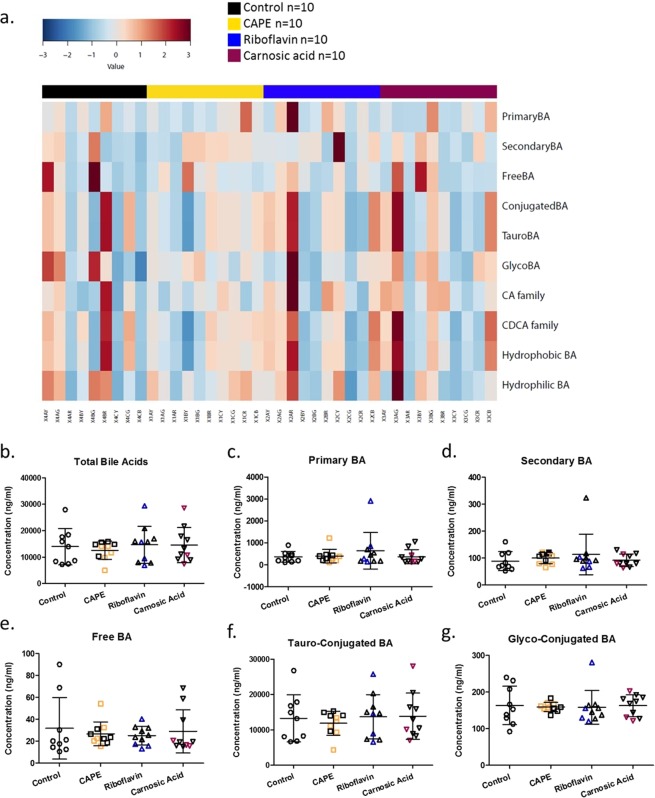
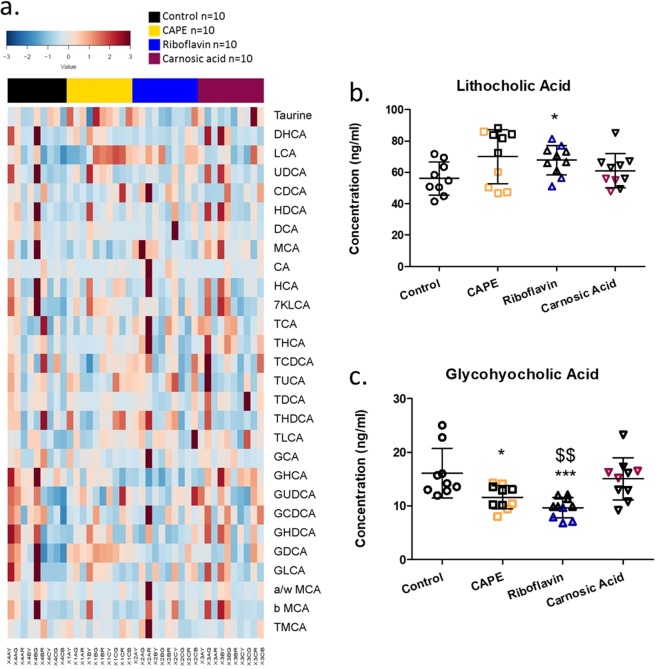
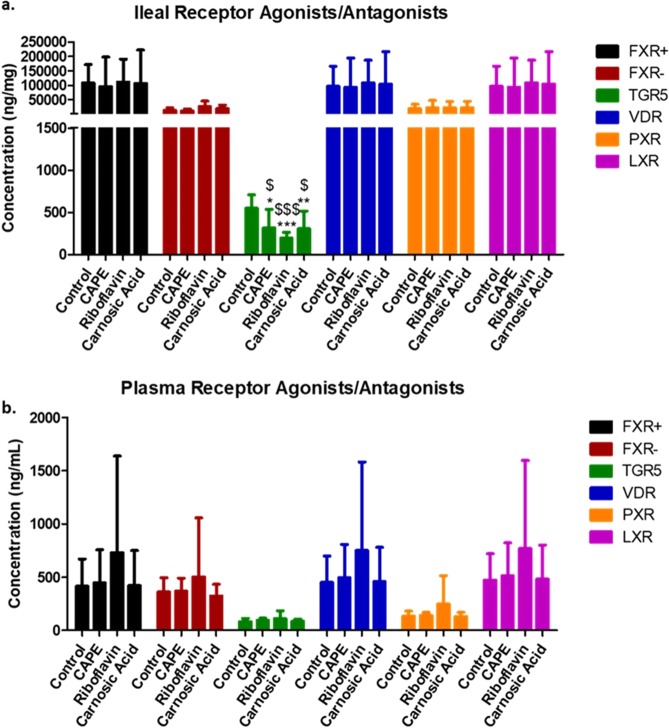
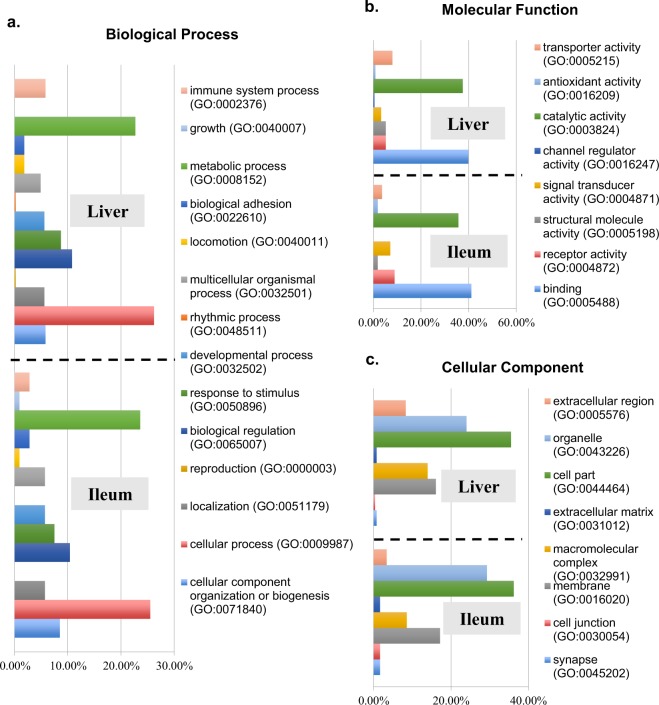
Gut microbial enzymes, bile salt hydrolases (BSHs) are the gateway enzymes for bile acid (BA) modification in the gut. This activity is a promising target for developing innovative non-antibiotic growth promoters to enhance animal production and health. Compelling evidence has shown that inhibition of BSH activity should enhance weight gain by altering the BA pool, host signalling and lipid metabolism. We recently identified a panel of promising BSH inhibitors. Here, we address the potential of them as alternative, effective, non-antibiotic feed additives, for commercial application, to promote animal growth using a chicken model. In this study, the in vivo efficacy of three BSH inhibitors (caffeic acid phenethylester, riboflavin, carnosic acid) were evaluated. 7-day old chicks (10 birds/group) were either untreated or they received one of the specific BSH inhibitors (25 mg/kg body weight) via oral gavage for 17 days. The chicks in treatment groups consistently displayed higher body weight gain than the untreated chicks. Metabolomic analysis demonstrated that BSH inhibitor treatment led to significant changes in both circulating and intestinal BA signatures in support of blunted intestinal BSH activity. Consistent with this finding, liver and intestinal tissue RNA-Seq analysis showed that carnosic acid treatment significantly altered expression of genes involved in lipid and bile acid metabolism. Taken together, this study validates microbial BSH activity inhibition as an alternative target and strategy to antibiotic treatment for animal growth promotion.


Conflict of interest statement

The authors declare no competing interests.

Figures

Figure 1
Figure 1
Body weight (BW) gain is influenced by BSH inhibitor treatment. Treatments were sub-divided according to responders (RS) and non-responders (NRS) and graphed relative to untreated control animals. BW gain is shown following treatment with (a) CAPE, (b) riboflavin and (c) carnosic acid via oral gavage for 21 consecutive days. Corresponding values for actual weight gain are shown for (d) CAPE, (e) riboflavin and (f) carnosic acid. Data is represented as mean ± SD.
Figure 2
Figure 2
Assessment of Ileum bile acid extraction efficiency (a) Schematic of bile acid synthesis and subsequent microbial modifications from liver through the intestine indicating family and other classifications (b) Levels of internal standard deuterated cholic acid (D4 CA). Data is expressed as ng/mg of each sample and represented as mean ± SD.
Figure 3
Figure 3
Assessment of the effects of BSH inhibitors on ileal bile acids classifications. (a) Heatplot showing relative representation of bile acids according to their classification/family for individual animals following respective treatments. Significantly altered (b–g) bile acid family representations. Coloured subjects represent responder (RS) animals with black subjects classified as non-responders (NRS).
Figure 4
Figure 4
Assessment of the effects of BSH inhibitors on ileal bile acid signatures. Only significantly altered BAs are show (a) lithocholic acid, (b) glycolithocholic acid, (c) muricholic acid, (d) glycodeoxycholic acid, (e) glycochenodeoxycholic acid and (f) glycoursodeoxycholic acid. Data is represented as mean ± SD. Colored subjects represent responder (RS) animals with black subjects classified as non-responders (NRS).
Figure 5
Figure 5
Assessment of the effects of BSH inhibitors on circulating bile acid classifications: (a) Heatplot showing relative representation of bile acids according to their classification/family for individual animals following BSH inhibitor treatments. Significantly altered (b–g) bile acid family representations. Data is represented as mean ± SD. Coloured subjects represent responder (RS) animals with black subjects classified as non-responders (NRS).
Figure 6
Figure 6
Assessment of the effects of BSH inhibitors on circulating bile acid signatures (a) heatplot showing relative representation of individual bile acid moieties for individual animals following their respective treatments. (b) lithocholic acid and (c) glycohyocholic acid levels are significantly altered in plasma samples following either CAPE or riboflavin treatments, similar trends are evident with carnosic acid. Data is represented as mean ± SD. Coloured subjects represent responder (RS) animals with black subjects classified as non-responders (NRS).
Figure 7
Figure 7
Prediction of (a) Ileal and (b) circulating bile acid receptor activation post BSH inhibitor treatment relative to non treated animals. Agonists (+) and antagonists (−) for FXR; agonists for TGR5, VDR and PXR are represented. Data is represented as mean ± SD.
Figure 8
Figure 8
Functional enrichment of Gene Ontology or up-regulated transcripts detected from chicken liver and ileum in response to carnosic acid treatment. Functional enrichment of differentially abundant genes was analyzed by Gene Ontology Consortium with GO Enrichment Analysis tool (http://www.geneontology.org/page/go-enrichment-analysis). The set of differentially abundant genes was functionally annotated with DAVID bioinformatics resources (https://david.ncifcrf.gov/). (a) Up-regulated genes classified with the specific biological process terms, (b) Up-regulated genes classified with the specific molecular function terms, (c) Up-regulated genes classified with the specific cellular component terms.
Figure 9
Figure 9
Functional enrichment of GO terms of down-regulated transcripts in chicken liver and ileum in response to carnosic acid treatment. Functional enrichment of differentially abundant genes was analyzed by Gene Ontology Consortium with GO Enrichment Analysis tool (http://www.geneontology.org/page/go-enrichment-analysis). The set of differentially abundant genes was functionally annotated with DAVID bioinformatics resources (https://david.ncifcrf.gov/). (a) Down-regulated genes classified with the specific biological process terms, (b) Down-regulated genes classified with the specific molecular function terms, (c) Down-regulated genes classified with the specific cellular component terms.

Similar articles

Cited by

References

    1. Moore P, et al. Use of sulfasuxidine, streptothricin, and streptomycin in nutritional studies with the chick. J. Biol. Chem. 1946;165:437–441. - PubMed
    1. Dibner J, Richards J. Antibiotic growth promoters in agriculture: history and mode of action. Poultry Sci. 2005;84:634–643. doi: 10.1093/ps/84.4.634. - DOI - PubMed
    1. Turnidge J. Antibiotic use in animals-prejudices, perceptions and realities. J. Antimicrob. Chemoth. 2004;53:26–27. doi: 10.1093/jac/dkg493. - DOI - PubMed
    1. Geng W, Lin J. Bacterial bile salt hydrolase: an intestinal microbiome target for enhanced animal health. Anim. Health Res. Rev. 2016;17:148–158. doi: 10.1017/S1466252316000153. - DOI - PubMed
    1. Brown K, Uwiera RR, Kalmokoff ML, Brooks SP, Inglis GD. Antimicrobial growth promoter use in livestock: a requirement to understand their modes of action to develop effective alternatives. Int. J. Antimicrob. Ag. 2017;49:12–24. doi: 10.1016/j.ijantimicag.2016.08.006. - DOI - PubMed

Publication types