. 2020 Mar 18;3(1):130.
doi: 10.1038/s42003-020-0842-3.

Loss of the branched-chain amino acid transporter CD98hc alters the development of colonic macrophages in mice

Collaborators, Affiliations

Loss of the branched-chain amino acid transporter CD98hc alters the development of colonic macrophages in mice

Philipp Wuggenig et al. Commun Biol. .

Abstract

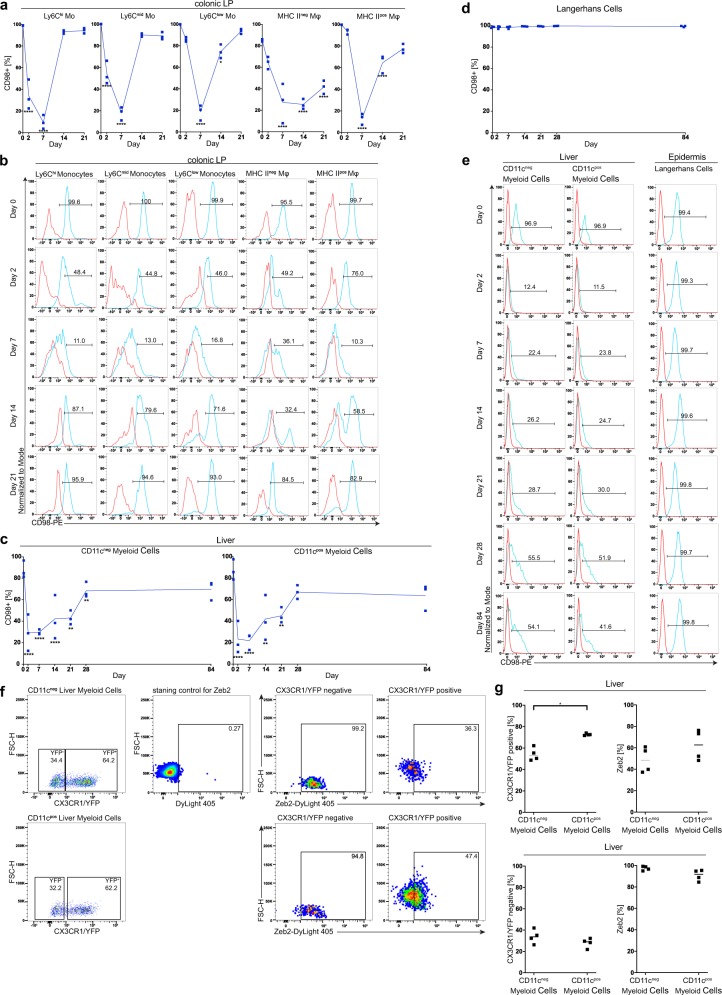
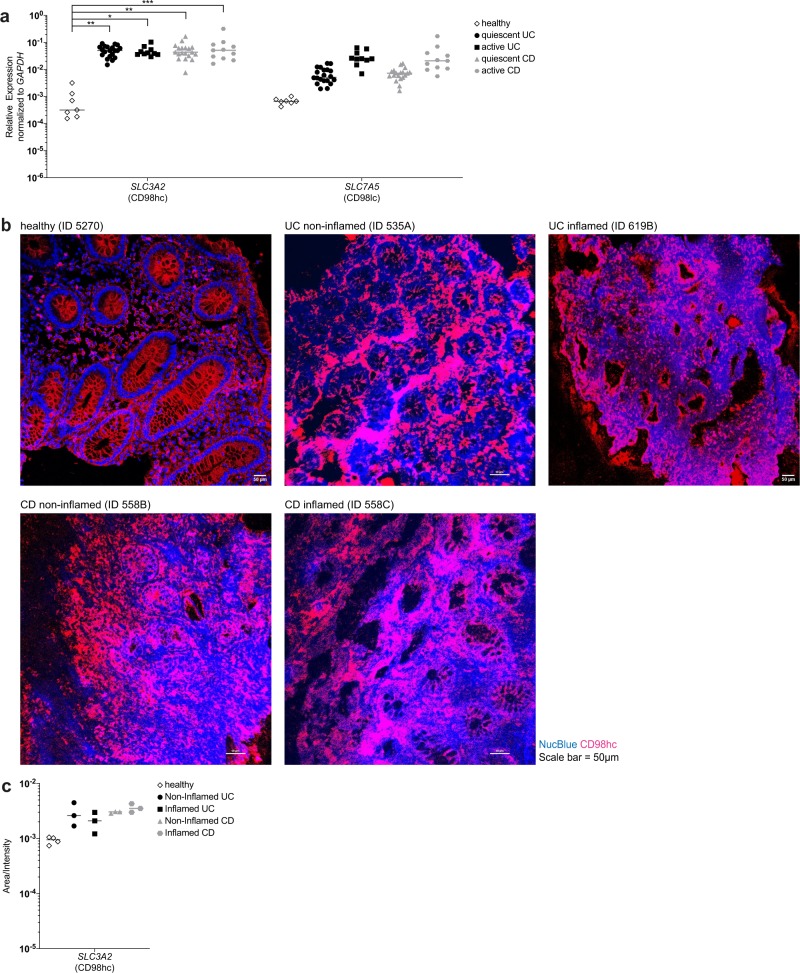
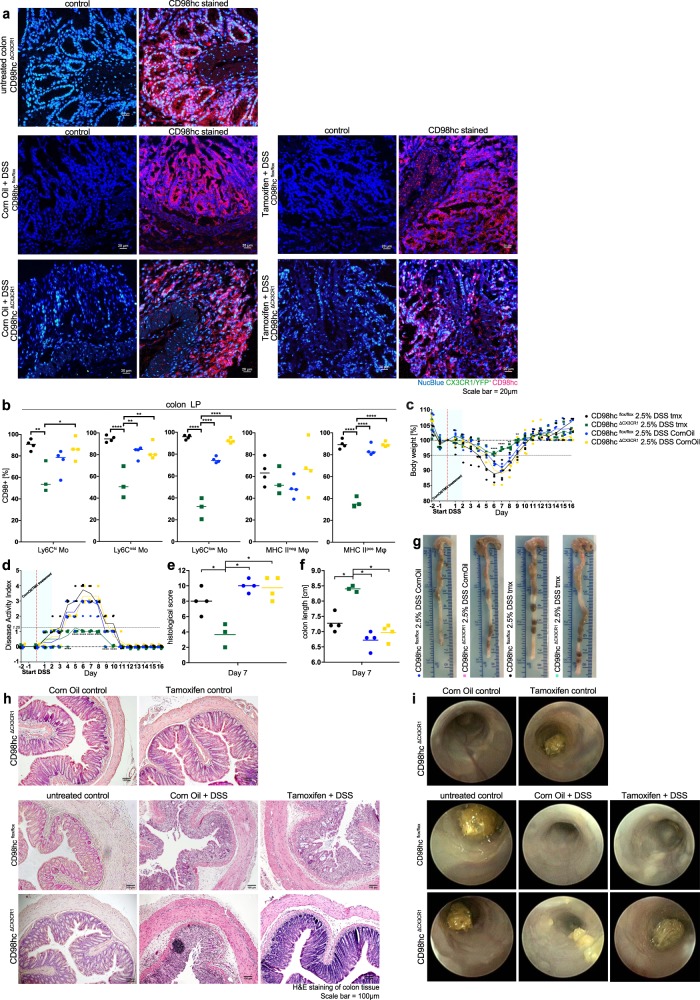
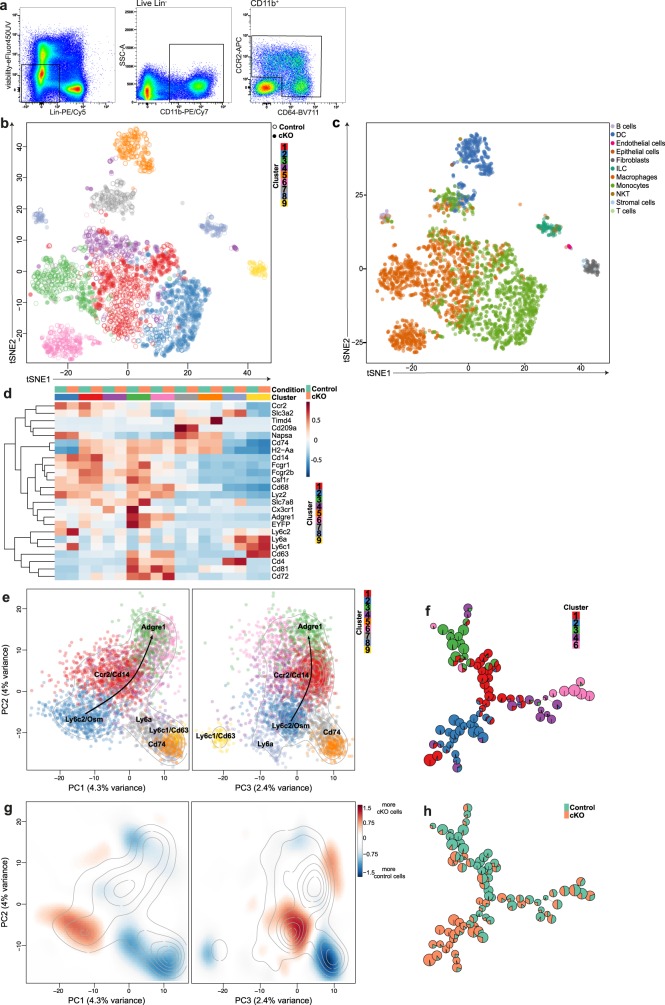
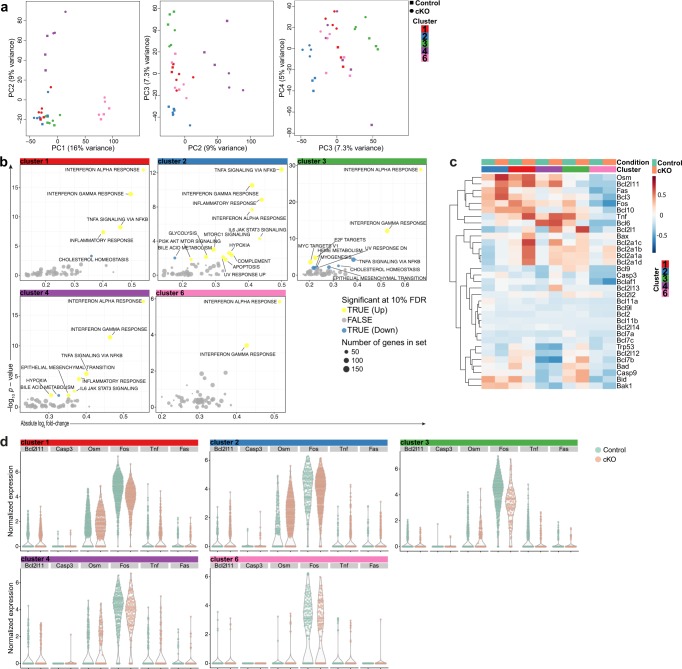
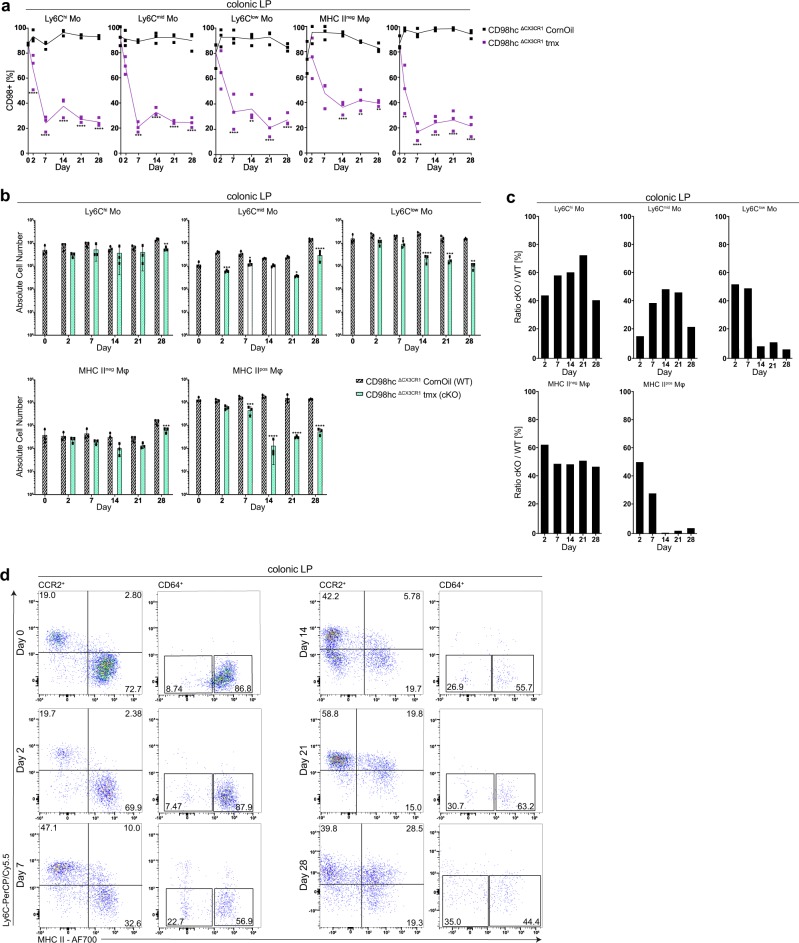
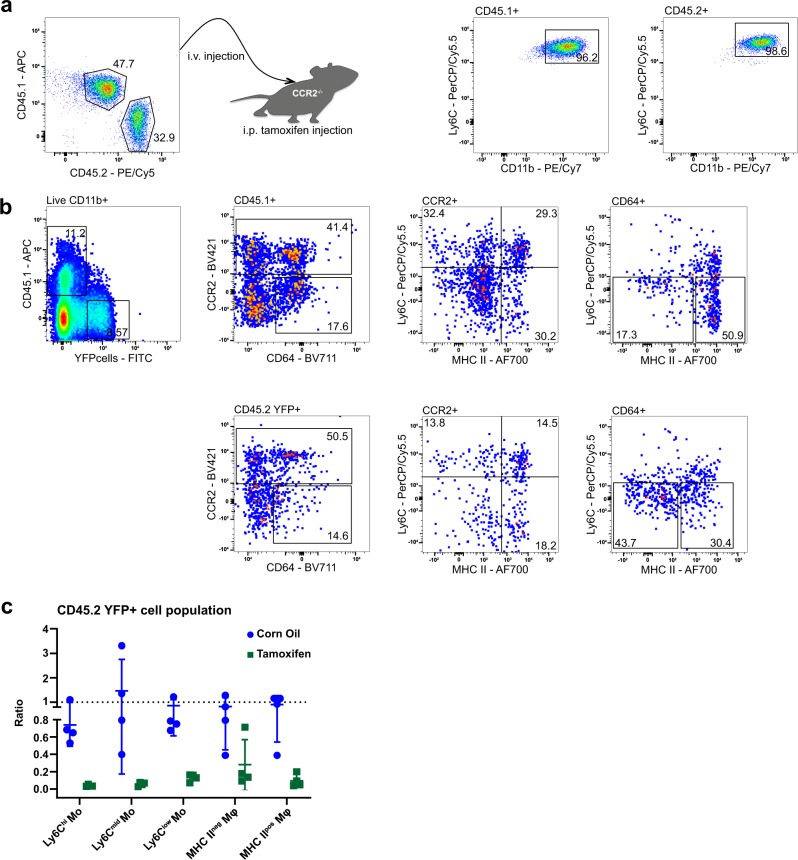
Comprehensive development is critical for gut macrophages being essential for the intestinal immune system. However, the underlying mechanisms of macrophage development in the colon remain elusive. To investigate the function of branched-chain amino acids in the development of gut macrophages, an inducible knock-out mouse model for the branched-chain amino acid transporter CD98hc in CX3CR1+ macrophages was generated. The relatively selective deletion of CD98hc in macrophage populations leads to attenuated severity of chemically-induced colitis that we assessed by clinical, endoscopic, and histological scoring. Single-cell RNA sequencing of colonic lamina propria macrophages revealed that conditional deletion of CD98hc alters the "monocyte waterfall"-development to MHC II+ macrophages. The change in the macrophage development after deletion of CD98hc is associated with increased apoptotic gene expression. Our results show that CD98hc deletion changes the development of colonic macrophages.


Conflict of interest statement

The authors declare no competing interests.

Figures

Fig. 1
Fig. 1. Monocytes, macrophages, and their progenitors express CD98hc.
Bone marrow cells were isolated from C57Bl/6 wild-type (WT) mice. Monocyte–macrophage dendritic cell progenitors, (MDP), common monocyte progenitors (cMoP) and monocytes (Mo) were analyzed for CD98hc expression. a After gating on viable, CD115+ and lineage-negative cells, MDPs were identified as, CD117+, CD135+, Ly6C, and CD11b cells. cMoPs were defined as CD117+, CD135, Ly6C+, and CD11b cells, and monocytes characterized as CD117, CD135, and CD11b+ cells with Ly6Chigh, Ly6Cmid, and Ly6Clow expression. b Expression and c median fluorescence intensity (MFI) of the glycoprotein CD98hc by indicated monocytes and their progenitors. (n = 5 independent animals). d In the colonic lamina propria, after gating on viable and lineage-negative population, CD11b+ cells were used for further classification. CCR2/CD64 dot plots were obtained by gating on CD11b+ cells to discriminate CCR2+/CD64 and CCR2+/CD64+ monocytes from CD64+/CCR2 macrophages (Mφ), which were further distinguished by Ly6C and MHCII staining. e Representative scanning electron microscopy images of colonic monocytes and macrophages. f Expression and g MFI of CD98hc in distinct populations FMO controls are indicated by red histograms, blue histograms indicate CD98hc stained cells. Numbers in histogram plots indicated the percentage of CD98hc+ cells (b, f). Each dot represents one independent animal; the mean is indicated. The data were analyzed by Kruskal–Wallis test followed by Dunn’s correction; *p < 0.05, ***p < 0.001 (c, g). Experiments were performed thrice with three to five biological replicates in each group.
Fig. 2
Fig. 2. Tamoxifen injection into CD98hcΔCX3CR1 animals leads to the excision of CD98hc in monocytes and macrophages.
Following intraperitoneal tamoxifen injection, monocytes, and macrophages were isolated from the colonic lamina propria (cLP) of CD98hcΔCX3CR1 animals at indicated time points and analyzed for CD98hc expression by flow cytometry. a Percentage of CD98hc+ monocytes and macrophages (n = 3). b Histogram plots showing CD98hc staining intensity in cLP monocytes and macrophages. c Mean (±SD) percentage of CD98hc+ CD11cneg, and CD11cpos liver myeloid cells and (d) Langerhans cells (n = 3). e Histogram plots of CD11cneg and CD11cpos liver myeloid cells and Langerhans cells isolated from liver and epidermis, respectively. Red histograms display FMO controls, blue histograms CD98hc+ cells; Numbers in histograms show the percentage of CD98hc+ cells (b, e). The data are shown as the mean (± SD), and the results were analyzed by two-way ANOVA followed by Sidak’s correction; *p < 0.05, **p < 0.01, ***p < 0.001, ****p < 0.0001 (ad). f After gating on CX3CR1/YFP+ or CX3CR1/YFP CD11c+ or CD11c liver myeloid cells, Zeb2 expression by CD11c+ or CD11c liver myeloid cells were analyzed. Numbers in dot plots indicate the percentage of positive cells. g Percentage of CX3CR1/YFP+ or CX3CR1/YFP, and percentage of Zeb2+ CD11c+ or CD11c liver myeloid cells. Each dot represents one animal; the mean is indicated. The data were analyzed by Mann–Whitney U test; *p < 0.05. Experiments were performed once with three biological replicates for CD98hc silencing kinetics, and once with four biological replicates for Zeb2 expression.
Fig. 3
Fig. 3. Inflammatory bowel disease patients express CD98.
The Swiss IBD cohort study provided colonic or ileal biopsies from Crohn’s disease (CD) or ulcerative colitis (UC) patients which were in remission (quiescent) or with active disease. Healthy patients were recruited at the University Hospital Basel. a CD98hc/SLC3A2 and CD98lc/SLC7A5 expression was determined by qRT-PCR. b Cryosections of inflamed and non-inflamed regions of the same CD or UC patient (patient identification numbers in brackets) were stained for CD98hc and counterstained with NucBlue. Immunofluorescence was carried out with biopsies of five healthy patients, and four UC and four CD patients. c CD98hc fluorescence intensity of staining of biopsies from CD and UC patients. In the figures of the panels (a) and (c), the mean is indicated with each dot representing one patient. The data were analyzed by Mann–Whitney U test; *p ≤ 0.05, **p ≤ 0.01, ***p ≤ 0.001.
Fig. 4
Fig. 4. Conditional deletion of CD98hc in monocytes and macrophages leads to attenuated colitis.
a CD98hc immunofluorescence of CD98hcΔCX3CR1 mice, CD98hcflox/flox, and CD98hcΔCX3CR1 with DSS colitis treated either with corn oil or tamoxifen. b Percentage of CD98hc+ monocytes and macrophages of indicated groups 7 days after start of DSS administration. Colitis was induced by adding 2.5% dextran sodium sulfate (DSS) to CD98hcflox/flox and CD98hcΔCX3CR1 mice which were treated either with corn oil or tamoxifen 2 days before DSS administration. Each dot represents one animal. Data were analyzed by two-way ANOVA followed by Sidak’s correction; *p < 0.05, **p < 0.01, ***p < 0.001. c The mean percentage body weight change (± SD) and d disease activity index are shown. The data were analyzed by two-way ANOVA followed by Sidak’s correction; ****p < 0.0001. e Histological scores were assessed in a blinded fashion by two independent investigators. The mean histological score was determined for each animal after H&E staining of colonic tissues, presented as individual dot and analyzed with a Mann–Whitney U test; *p < 0.05. f The colon length was determined at day 7 after start of DSS administration, colon length is shown for each individual animal, the mean indicated and analyzed with a Mann–Whitney U test; *p < 0.05. g A representative image of the colon from each group is shown. h Hematoxylin staining of colonic tissues, and i endoscopic images from indicated groups. Experiments were performed four times with three to four biological replicates in each group.
Fig. 5
Fig. 5. Single-cell RNA sequencing suggests a developmental trajectory from monocytes to macrophages in the colonic lamina propria.
After sorting of viable CCR2+CD64/CCR2+CD64+ and CCR2CD64+ cells from CD98hcΔCX3CR1 mice treated with corn oil or tamoxifen, sorted monocytes, and macrophages were further analyzed by single-cell RNA sequencing (scRNA-seq). scRNA-seq was performed in quadruples. a Gating strategy for the isolation of CCR2+CD64/CCR2+CD64+ and CCR2CD64+ colonic monocytes and macrophages for scRNA-seq analysis. b t-SNE analysis depicts the distribution of the nine different clusters and indicates their relationship in corn oil (vehicle control) or tamoxifen (cKO) treated CD98hcΔCX3CR1 mice. c t-SNE visualization shows the annotation of the scRNA-seq data set by using SingleR comparing our data set to the immunological genome project (ImmGen) reference data set. d Genes that are characteristic for monocytes and macrophages were depicted and presented as a heatmap. The heatmap of top cluster-specific genes consists of the union of the top ten genes from each between-clusters pairwise comparison. e Principal component analysis of single-cells, based on the 500 most variable genes across all cells. The colors represent cells from the different clusters. Contour lines indicate the density of the cells in the principal component analysis space. f FlowSOM analysis after exclusion of the contaminant clusters 5, 7, 8, and 9. g The color of the differential 2D density plot represents the log2 ratio of 2D densities of cKO cells over control cells. h Pie charts within the FlowSOM tree indicate the relative enrichment of cKO cells over control cells. The experiment was performed once (scRNA-seq) with four biological replicates in each group.
Fig. 6
Fig. 6. Enrichment of apoptosis-related genes in CD98hc cKO cells.
a Gene expression variations between control and cKO cells were retrospectively analyzed and presented in a principal component analysis plots for each cluster. b Gene set enrichment analysis indicates enrichment of differential expresses genes in CD98 cKO cells over control cells in indicated signatures per cluster. c Heatmap of genes associated with apoptosis were displayed. d Expression of Bcl2l11, Casp3, Osm, Fos, Tnf, and Fas by CD98 cKO cells and control cells per individual cluster. The experiment was done once (scRNA-seq) with four biological replicates in each group.
Fig. 7
Fig. 7. Deletion of CD98hc in monocytes and macrophages leads to reduced macrophage numbers in the colonic lamina propria.
Percentage of monocytes and macrophages that express CD98hc and total monocyte and macrophage number in the colonic lamina propria of CD98hcΔCX3CR1 mice was determined after receiving tamoxifen for 28 days. a Percentage of CD98hc+ monocytes and macrophages, and b the total monocyte and macrophage numbers in the colonic lamina propria of corn oil- and tamoxifen-treated CD98hcΔCX3CR1 animals (n = 3) are shown as the mean (± SD) and analyzed by two-way ANOVA followed by Sidak’s correction; ****p < 0.0001. c Ratios (cKO/WT cells) of total colonic lamina propria monocytes and macrophages cell numbers between corn oil and tamoxifen-treated CD98hcΔCX3CR1 at indicated time points. d Dot plots were generated by gating on CCR2+CD64/CCR2+CD64+ and CCR2CD64+ colonic lamina propria monocytes and macrophages isolated from tamoxifen-treated CD98hcΔCX3CR1 animals at indicated time points. Numbers show the percentage of the indicated gates. Experiments performed twice with three biological replicates in each group.
Fig. 8
Fig. 8. Deletion of CD98hc leads to reduced MHCII+ macrophages in competitive adoptive BM monocyte transfer experiments.
After isolation of bone marrow monocytes from B6 Ly5.1 (CD45.1+) and CD98hcΔCX3CR1 (CD45.2 YFP+), CD11b+ monocytes were injected into CCR2−/− recipients. a Dot plots of bone marrow CD45.1 and CD45.2 monocytes mixtures before transfer into CCR2−/− animals. CD11b+/Ly6C+ dot plots were obtained after gating either on CD45.1 or CD45.2 monocytes. b Dot plots were generated by gating on live CD11b+ colonic lamina propria monocytes and macrophages isolated from tamoxifen-treated CCR2−/− recipients. c Ratios between CD45.2 YFP+ and CD45.1+ WT colonic lamina propria monocytes and macrophages isolated from corn oil- or tamoxifen-treated CCR2−/− hosts 5 days after transfer normalized to input ratios. Each dot indicates one respective host. Experiment was performed once with four biological replicates in each group.

References

    1. Mowat AM, Scott CL, Bain CC. Barrier-tissue macrophages: functional adaptation to environmental challenges. Nat. Med. 2017;23:1258–1270. doi: 10.1038/nm.4430. - DOI - PubMed
    1. Bain CC, et al. Constant replenishment from circulating monocytes maintains the macrophage pool in the intestine of adult mice. Nat. Immunol. 2014;15:929–937. doi: 10.1038/ni.2967. - DOI - PMC - PubMed
    1. Bogunovic M, et al. Origin of the lamina propria dendritic cell network. Immunity. 2009;31:513–525. doi: 10.1016/j.immuni.2009.08.010. - DOI - PMC - PubMed
    1. Varol C, et al. Intestinal lamina propria dendritic cell subsets have different origin and functions. Immunity. 2009;31:502–512. doi: 10.1016/j.immuni.2009.06.025. - DOI - PubMed
    1. Shaw TN, et al. Tissue-resident macrophages in the intestine are long lived and defined by Tim-4 and CD4 expression. J. Exp. Med. 2018;215:1507–1518. doi: 10.1084/jem.20180019. - DOI - PMC - PubMed

Publication types

MeSH terms