. 2020 Mar;579(7799):415-420.
doi: 10.1038/s41586-020-2071-9. Epub 2020 Mar 11.

Gasdermin E suppresses tumour growth by activating anti-tumour immunity

Affiliations

Gasdermin E suppresses tumour growth by activating anti-tumour immunity

Zhibin Zhang et al. Nature. 2020 Mar.

Abstract

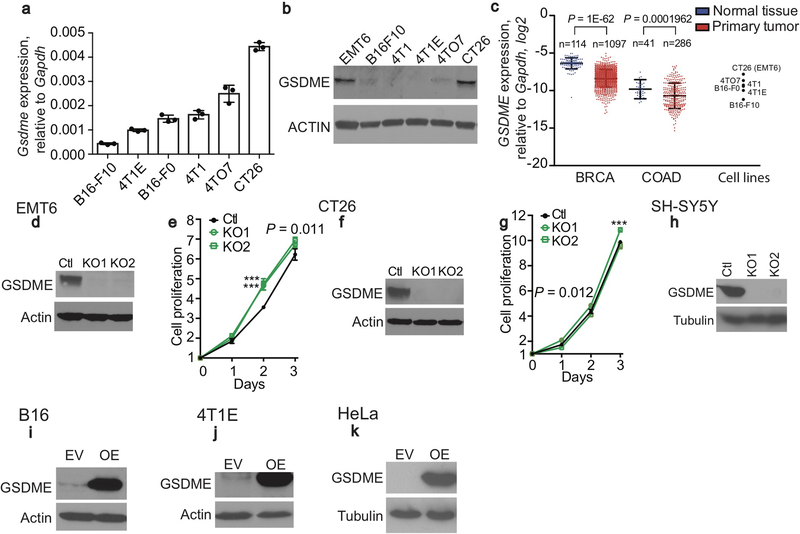
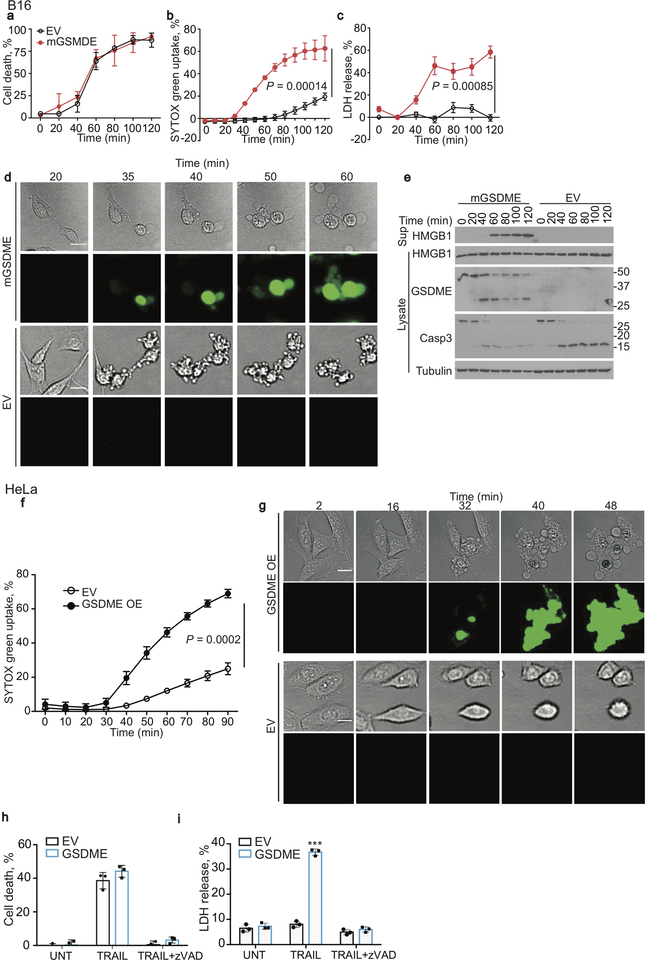
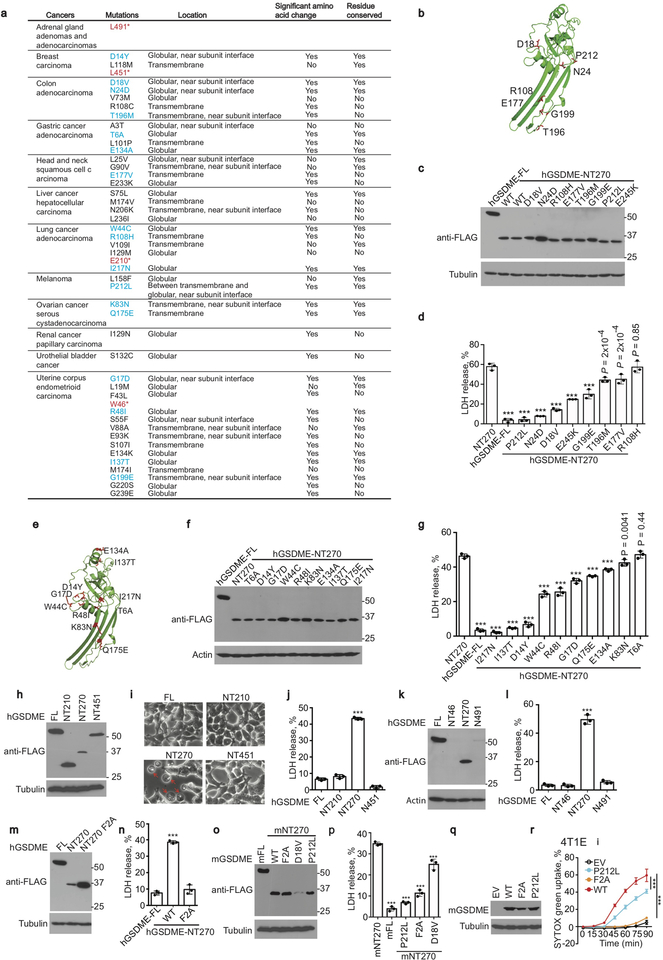
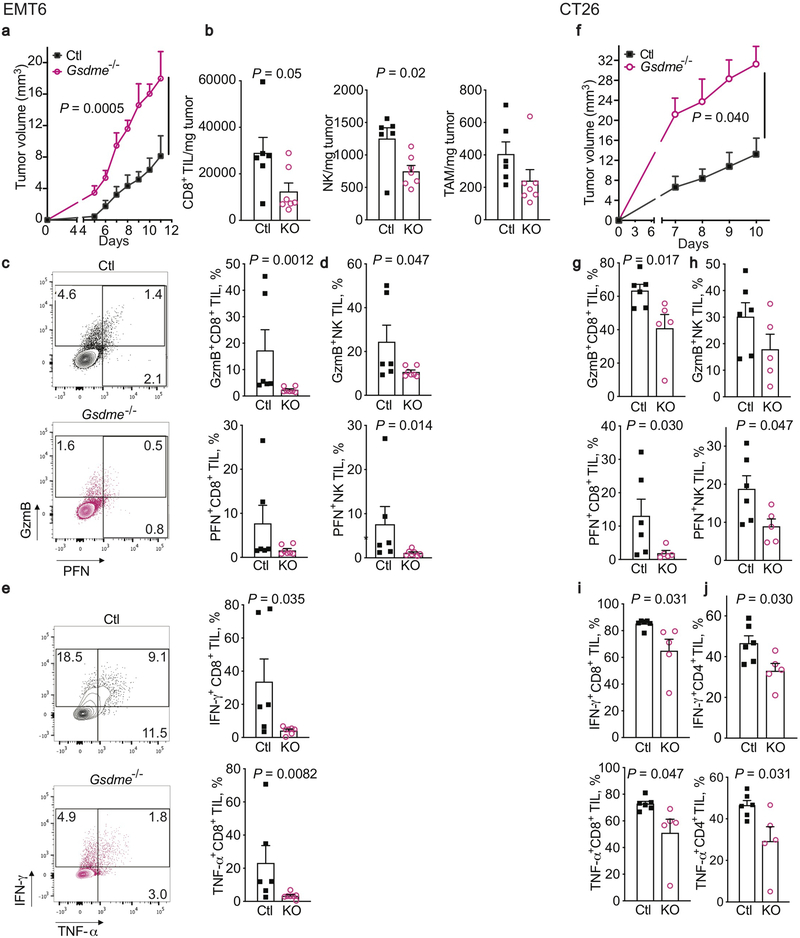
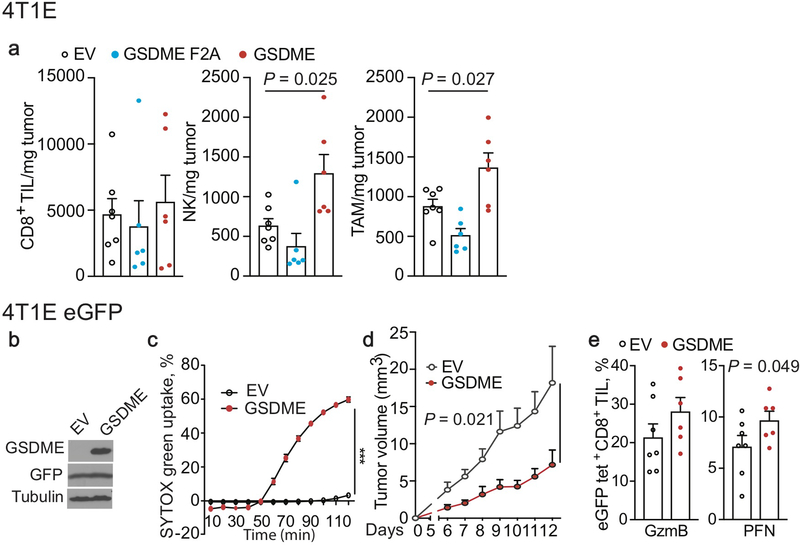
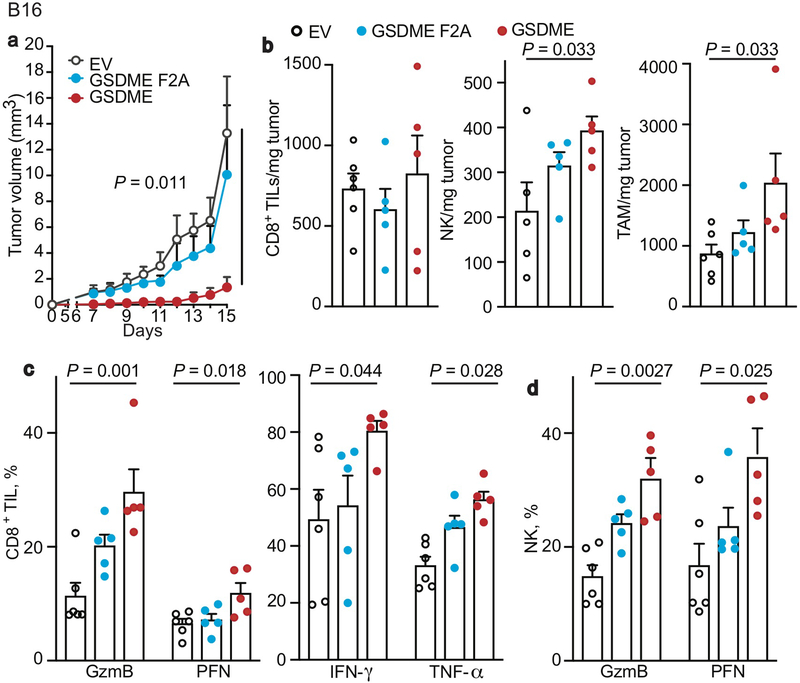
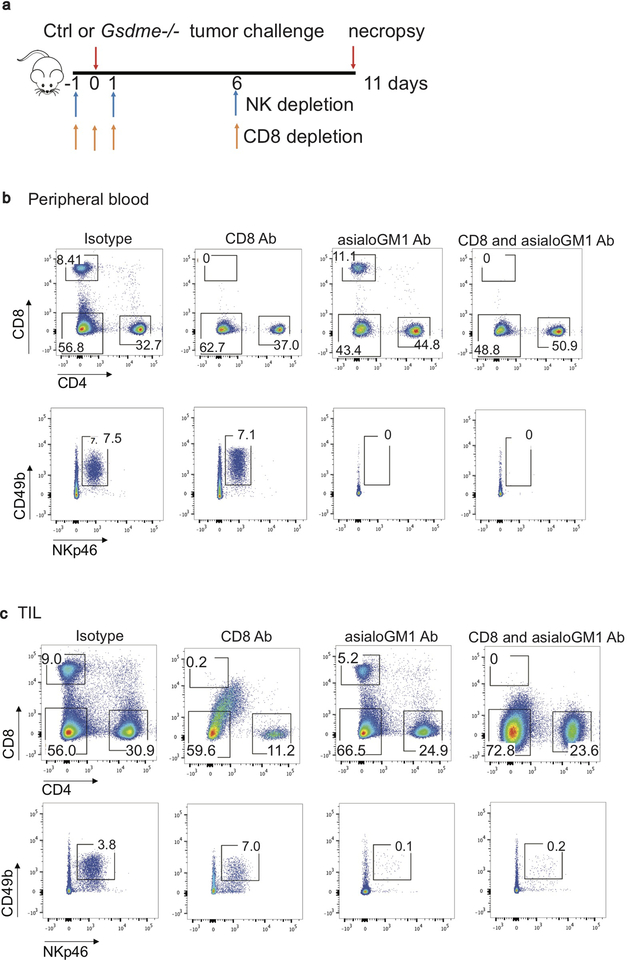
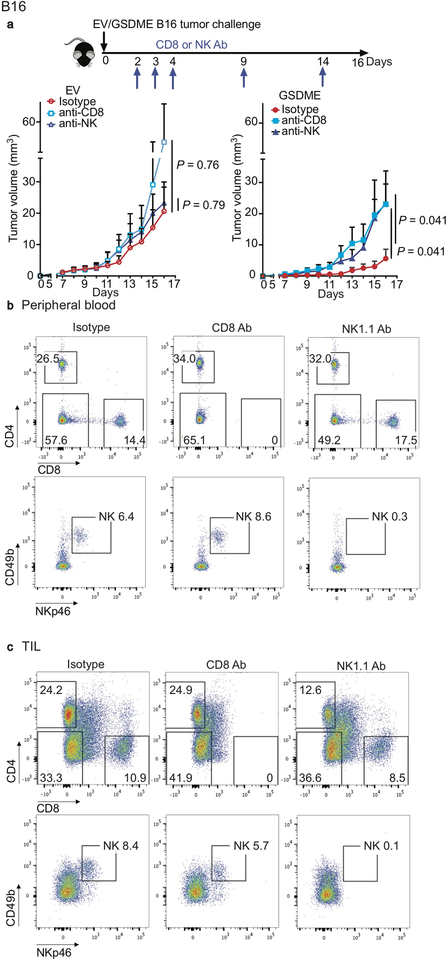
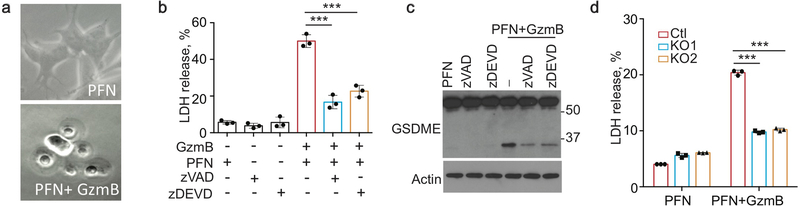
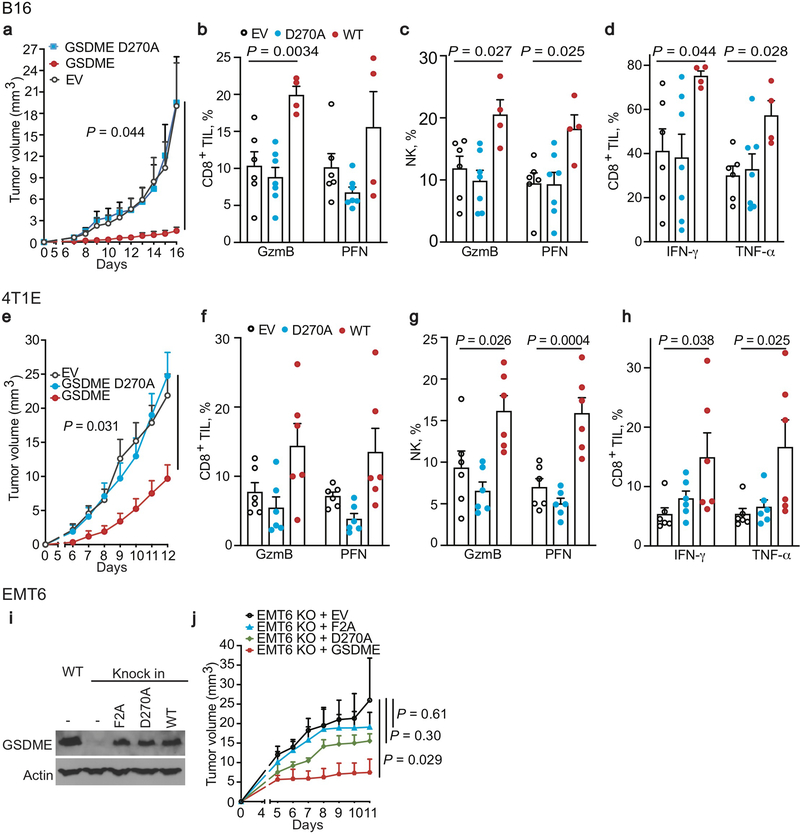
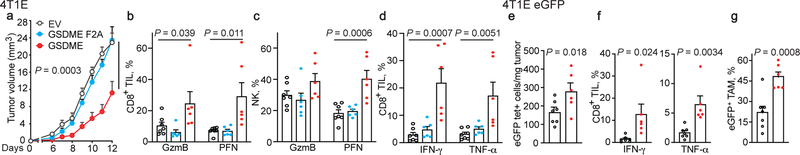
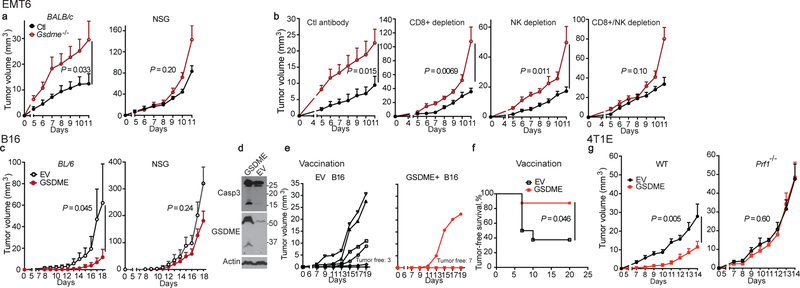
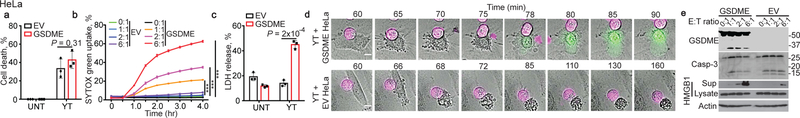
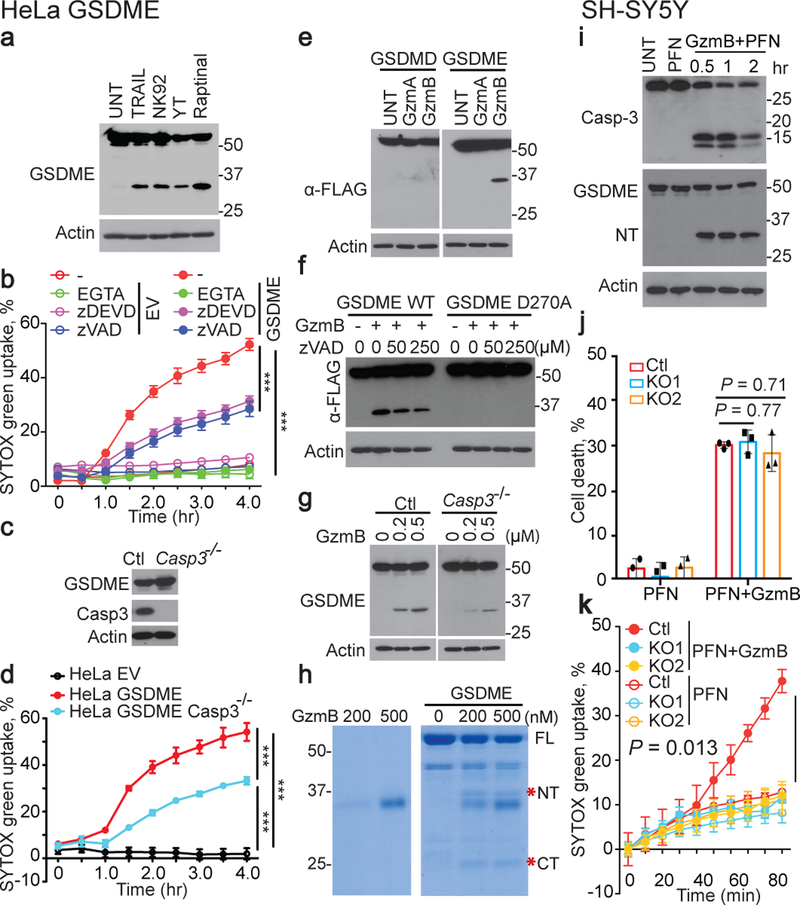
Cleavage of the gasdermin proteins to produce pore-forming amino-terminal fragments causes inflammatory cell death (pyroptosis)1. Gasdermin E (GSDME, also known as DFNA5)-mutated in familial ageing-related hearing loss2-can be cleaved by caspase 3, thereby converting noninflammatory apoptosis to pyroptosis in GSDME-expressing cells3-5. GSDME expression is suppressed in many cancers, and reduced GSDME levels are associated with decreased survival as a result of breast cancer2,6, suggesting that GSDME might be a tumour suppressor. Here we show that 20 of 22 tested cancer-associated GSDME mutations reduce GSDME function. In mice, knocking out Gsdme in GSDME-expressing tumours enhances, whereas ectopic expression in Gsdme-repressed tumours inhibits, tumour growth. This tumour suppression is mediated by killer cytotoxic lymphocytes: it is abrogated in perforin-deficient mice or mice depleted of killer lymphocytes. GSDME expression enhances the phagocytosis of tumour cells by tumour-associated macrophages, as well as the number and functions of tumour-infiltrating natural-killer and CD8+ T lymphocytes. Killer-cell granzyme B also activates caspase-independent pyroptosis in target cells by directly cleaving GSDME at the same site as caspase 3. Uncleavable or pore-defective GSDME proteins are not tumour suppressive. Thus, tumour GSDME acts as a tumour suppressor by activating pyroptosis, enhancing anti-tumour immunity.


Conflict of interest statement

Competing interests The authors declare no competing interests.

Figures

Extended Data Figure 1.
Extended Data Figure 1.. GSDME expression in human and mouse tumor cell lines.
a,b, Gsdme mRNA (a) and protein (b) levels of indicated mouse cancer cell lines assessed by qPCR, relative to Gapdh, and by immunoblot, respectively. c, GSDME expression relative to GAPDH in normal tissue and tumors from breast invasive carcinoma (BRCA) and colon adenocarcinoma (COAD) patients from The Cancer Genome Atlas (TCGA) compared to the qRT-PCR values for mouse cancer cell lines used in this study. P-values comparing normal tissue and cancer tissues were calculated using unpaired two-tailed Student’s t-test. d,f, Expression of mGSDME in EMT6 (d), CT26 (f) clones knocked out (KO) for Gsdme or control (Ctl) cells treated with nontargeting vector, assessed by immunoblot for GSDME. Actin serves as loading control. e,g Cell proliferation determined by CellTiter 96 in EMT6 (e) or CT26 (g) ctl and Gsdme KO cells (n=6 samples/group). h, Expression of hGSDME in SH-SY5Y clones knocked out for GSDME or control (Ctl) cells treated with nontargeting vector, assessed by immunoblot for GSDME. i, j, Expression of mGSDME in GSDME OE and empty vector (EV)-transduced B16 (i) or 4T1E (j) by immunoblot. k, Expression of hGSDME in GSDME OE and empty vector (EV)-transduced HeLa by immunoblot. Differences among multiple groups in (e,g) were analyzed by one-way ANOVA, using the Holm-Sidak method for multiple comparisons. P-values in (e,g) compare KO and Ctl cells. *** P<0.0001. Data are mean ± SD of three technical (a) or six biological (e,g) replicates. Data are representative of at least two independent experiments.
Extended Data Figure 2.
Extended Data Figure 2.. Raptinal and/or TRAIL induce pyroptosis in B16 and HeLa overexpressing GSDME.
a-e, Comparison of cell death after adding raptinal to EV and mGSDME OE B16. a, Kinetics of overall cell death assayed by counting annexin V+ and/or PI+ cells by flow cytometry. b,c, Pyroptosis assessed by SYTOX green uptake (b) and LDH release (c). d, Time-lapse microscopy images showing morphological changes and SYTOX green uptake. e, Kinetics of caspase-3 and GSDME cleavage and HMGB1 release by immunoblot of cell lysates and culture supernatants. f,g, SYTOX green uptake by plate reader (f) and time-lapse confocal microscopy (g) after raptinal treatment of EV and hGSDME OE HeLa. h,i, TRAIL induction of cell death 16 h post treatment, assessed by CellTiter-Glo (h), and LDH release (i) in HeLa cells transduced with an EV or in hGSDME OE HeLa in the presence or absence of the pan-caspase inhibitor zVAD-fmk. UNT, untreated. The area under the curve in (a-c,f) and data in (h,i) were compared by two-tailed Student’s t-test. Data are mean ± SD of biological triplicate wells. *** P<0.0001. Scale bar, 20 μm. Data are representative of two independent experiments.
Extended Data Figure 3.
Extended Data Figure 3.. GSDME mutations in tumors are mostly loss of function.
a, GSDME-NT mutations in primary cancer cells in The Cancer Genome Atlas (TCGA) (https://www.cancer.gov/about-nci/organization/ccg/research/structural-genomics/tcga). *, stop codon. Red, truncations. Blue, mutants analyzed in this study. b-g, 18 GSDME-NT cancer mutations mapped onto GSDME-NT (amino acids 1–241), modeled based on the cryo-EM structure of the pore conformation of GSDMA3-NT (PDB ID: 6CB8) (b,e) were analyzed after transient expression of WT FL GSDME or WT or mutated GSDME-NT (amino acids 1–270) in HEK293T cells for expression by immunoblot (c,f) and LDH release by CytoTox 96 assay (d,g). h-l, Effect of four cancer-related truncation mutations (amino acid 1–46, 1–210, 1–451 and 1–491) on GSDME function. GSDME expression of truncated proteins or FL or GSDME-NT (1–270) in HEK293T (h,k) and their effect on HEK293T cell death, assessed by morphology using microscopy (i) and LDH release (j,l). The NT46 truncated protein is too small to be detected in (k). Red arrows indicate ballooning pyroptotic cells. m,n, Effect of F2A mutation on GSDME-NT-induced pyroptosis in HEK293T. Protein expression (m) detected by anti-FLAG immunoblot and pyroptosis (n) assessed by LDH release. o,p Effect of transient expression of mouse WT FL GSDME or WT or mutated GSDME-NT (mNT270, amino acids 1–270) in HEK293T (o) on LDH release (p). q,r, Effect in 4T1E of expression of WT or mutated FL mGSDME (g) on raptinal-induced SYTOX green uptake (r). Differences among multiple groups in (d,g,j,l,n,p,r) were analyzed by one-way ANOVA, using the Holm-Sidak method for multiple comparisons. Data are mean ± SD of 3 technical (d,g,j,l,n,p) or biological (r) replicates. P-values compare unmutated to mutated constructs. *** P<0.0001. Data are representative of three independent experiments.
Extended Data Figure 4.
Extended Data Figure 4.. Gsdme knockout in EMT6 and CT26 increases tumor growth and reduces immune responses within tumors.
Comparison of control (Ctl) and Gsdme−/− orthotopic EMT6 (Ctl n=6, Gsdme−/− n=7) (a-e) and subcutaneous CT26 (Ctl n=6, Gsdme−/− n=5) (f-j) tumors in BALB/c mice. (Knockout (KO) is demonstrated in Extended Data Fig. 1.) Shown are tumor growth (a,f), numbers of CD8+ TIL (left), NK (middle) and TAM (right), normalized to tumor weight (b), representative flow plots (left) and mean percentage of CD8+ TILs expressing GzmB or PFN (right) (c,g), mean percentage of NK expressing GzmB or PFN (d,h), and representative flow plots (left) and mean percentage of CD8+TIL (right e,i) and CD4 TIL (j) producing IFN-γ or TNF-α after PMA and ionomycin stimulation. The area under the curve in (a,f) and differences between two groups in (b-e, g-j) were compared by two-tailed Student’s t-test. Data are mean + SEM. Data are representative of at least two independent experiments.
Extended Data Figure 5.
Extended Data Figure 5.. The effects of GSDME expression on tumor growth and immune responses within 4T1E tumors.
a, Mammary fat pad-implanted 4T1E cells stably expressing WT mGSDME (n=6 mice/group), the inactive F2A mutant of mGSDME (n=6 mice/group) or an empty vector (EV, n=7 mice/group) were analyzed for tumor-infiltrating immune cell numbers. b-e, 4T1E, stably expressing eGFP and then stably transduced to express mGSDME or EV (b), were compared for raptinal-induced SYTOX green uptake in vitro (c), tumor growth after orthotopic implantation (n=7 mice/group) (d), and percentage of CD8+ TIL expressing GzmB or PFN (e); Comparisons in (a) were calculated by one-way ANOVA using the Holm-Sidak method for multiple comparisons; (e) were calculated by two-tailed Student’s t-test. Comparisons in (c,d) were calculated by comparing the difference between the area under the curve by two-tailed Student’s t-test. Data shown are mean + SEM. *** P<0.0001. All data are representative of two independent experiments.
Extended Data Figure 6.
Extended Data Figure 6.. GSDME overexpression in B16 reduces tumor growth and increases immune responses within tumors.
a, Tumor growth in C57BL/6 mice that were implanted subcutaneously with B16 stably transduced with empty vector (EV) (n=6 mice/group) or to express mGSDME (n=8 mice/group) or inactive F2A GSDME (n=5 mice/group). b, Numbers of CD8+ (left) and NK (middle) TIL and TAM (right) in tumors, normalized to tumor weight. c, Percentage of CD8+ TIL expressing GzmB or PFN (left), and IFN-γ or TNF-α after PMA and ionomycin stimulation (right). d, Percentage of NK expressing Gzm B or PFN. Area under the curve of tumor growth curves in (a) was compared by one-way ANOVA with Holm-Sidak correction for type I error. Comparisons in (b-d) were calculated by one-way ANOVA using the Holm-Sidak method for multiple comparisons. Data are mean + SEM. All data are representative of at least two independent experiments.
Extended Data Figure 7.
Extended Data Figure 7.. CD8+ T and NK depletion in mice bearing EMT6 tumors.
Experimental scheme (a) and representative flow plots of CD4+ and CD8+ T cell and NK in the peripheral blood (b) and tumors (c) of mice bearing EMT6 tumors treated with isotype control antibody or anti-CD8 and/or anti-asialo GM1 antibodies in Fig. 2b. Samples were obtained on day 3 (blood) and day 11 (tumors) post tumor challenge. Data are representative of at least two independent experiments.
Extended Figure 8.
Extended Figure 8.. B16 tumor growth in mice depleted of CD8+ or NK.
a, Experimental scheme and growth of EV or mGSDME+ B16 tumors in mice depleted of CD8+ T cells (n=6 mice/group) or NK (n=6 mice/group) or treated with an isotype control antibody (EV n=6 mice/group, mGSDME+ n=7 mice/group). b,c, Antibody depletion was verified by flow cytometry using PBMC on day 7 post tumor challenge or using TILs at the time of necropsy. Representative flow plots of CD8+ T cell (upper) or NK cell (lower) depletion in the peripheral blood (b) and tumors (c) of mice bearing B16 EV or B16 GSDME tumors treated with isotype control, anti-CD8 or anti-NK1.1 antibodies. Area under the curve of tumor growth curves was compared by one-way ANOVA with Holm-Sidak correction for type I error. Data are mean + SEM. All data are representative of two independent experiments.
Extended Data Figure 9.
Extended Data Figure 9.. Necroptosis and ferroptosis are not involved in GSDME-mediated pyroptosis.
a, Effect of EGTA, necrostatin-1s (Nec-1s), α-tocopherol (Vit. E), ferrostatin-1 (Fer-1) and desferoxamine (DFO) on YT-induced SYTOX green uptake in EV and hGSDME+ HeLa. b-g, Cell death-related gene expression in mouse and human cancer cell lines. Ripk3 (b), RIPK3 (c), Mlkl (d), MLKL (e), Il1b (f) and IL1B (g) mRNA levels of indicated mouse (b,d,f) or human (c,e,g) cancer cell lines assayed by qRT-PCR, relative to Gapdh or GAPDH, respectively. Data are mean ± SD of biological (a) or technical (b-g) triplicates and are representative of two independent experiments.
Extended Data Figure 10.
Extended Data Figure 10.. PFN plus GzmB induce pyroptosis in SH-SY5Y cells.
SH-SY5Y treated with PFN ± GzmB or medium (UNT) for 2 hr or indicated time were analyzed by microscopy (a), immunoblot of cell lysates probed for GSDME and tubulin (c) or LDH release (b). In (b,c), treatment was in the presence of 30 μM caspase inhibitors as indicated. d, Effects of GSDME knockout on PFN ± GzmB-induced pyroptosis assessed after 1 hr treatment by LDH release. Differences among multiple groups in (b,d) were analyzed by one-way ANOVA using the Holm-Sidak method for multiple comparisons. Data are mean ± SD of biological triplicate wells. *** P<0.0001. Data are representative of two independent experiments.
Extended Data Figure 11.
Extended Data Figure 11.. Noncleavable D270A mutation blocks GSDME-mediated tumor protection and induction of anti-tumor immunity.
a-d, B16 stably expressing EV (n=7 mice/group), WT (n=8 mice/group) or D270A non-cleavable GSDME (n=7 mice/group) were implanted in C57BL/6 mice and followed for tumor growth (a) and the functional phenotype of CD8+ and NK TIL (b-d). Shown are the percentage of CD8+ or NK TIL expressing GzmB or PFN (b, c) or CD8+ TIL expressing IFN-γ or TNF-α induced by PMA and ionomycin (d). e-h, 4T1E stably expressing EV, WT or D270A non-cleavable GSDME were implanted in syngeneic (BALB/c, n=6 mice/group) mice and followed for tumor growth (e) and the functional phenotype of CD8+ and NK TIL (f-h). Shown are the percentage of CD8+ TIL expressing GzmB or PFN (f) or induced by PMA and ionomycin to express IFN-γ or TNF-α (h) and of NK TIL expressing GzmB or PFN (g). i, j, Gsdme−/− EMT6 rescued by transduction with lentiviruses expressing EV, WT, F2A or D270A non-cleavable GSDME were examined by immunoblot for GSDME expression (i) and for tumor growth after orthotopic implantation in BALB/c mice (n=8 mice/group) (j). Area under the curve of tumor growth curves or differences among multiple groups were compared by one-way ANOVA with Holm-Sidak correction for type I error. Data are mean + SEM. All data are representative of two independent experiments.
Figure 1.
Figure 1.. Ectopic expression of pore-forming, but not inactive, GSDME reduces tumor growth and enhances tumor immune responses.
a-d, Orthotopically implanted 4T1E cells stably expressing WT mGSDME (n=6 mice/group), inactive F2A mGSDME (n=6 mice/group) or empty vector (EV, n=7 mice/group) were analyzed for tumor growth (a) and TIL function (b-d). Percentage of CD8+ (b) and NK (c) TIL expressing GzmB or PFN; CD8+ TIL producing IFN-γ or TNF-α induced by PMA and ionomycin (d). e-g, Anti-tumor immunity after orthotopic implantation of 4T1E, stably expressing eGFP and then stably transduced to express mGSDME or EV (n=7 mice/group). e, Mean numbers of tumor-specific GFP tetramer+ (tet+) CD8+ TIL/mg of tumor. f, Percentage of CD8+ TIL activated by eGFP peptide to produce IFN-γ or TNF-α. g, Percentage of GFP+ TAM that phagocytosed tumor cells. The area under the curve of tumor growth curves were compared by one-way ANOVA with Holm-Sidak correction for type I error (a). Comparisons in (b-d) were calculated by one-way ANOVA using the Holm-Sidak method for multiple comparisons; (e-g) were calculated by two-tailed Student’s t-test. Data shown are mean + SEM and are representative of two independent experiments.
Figure 2.
Figure 2.. GSDME-mediated tumor inhibition depends on cytotoxic lymphocytes.
a,b, Growth of control (Ctl) or Gsdme−/− EMT6 in BALB/c (left, n=8 mice/group) and NSG mice (right, Ctl n=7 mice/group; Gsdme−/− n=8 mice/group) (a) or in BALB/c mice treated with an isotype control antibody (n=6 mice/group) or depleted of CD8+ T cells (n=8 mice/group), NK (n=7 mice/group) or both (n=8 mice/group) (b). Antibody depletion (schematic, Extended Data Fig. 7a) was verified on day 3 post tumor challenge and day 11 at necropsy (Extended Data Fig. 7b,c). c, Growth of EV or mGSDME-overexpressing B16 in C57BL/6 (left, EV n=5 mice/group, mGSDME n=8 mice/group) and NSG (right, n=6 mice/group). d-f, B16 vaccination model. C57BL/6 mice were vaccinated in the left flank with EV or GSDME+ B16 and challenged 10 days later with EV B16 in the right flank (n=8 mice/group). Shown are immunoblot of lysates of representative left flank tumors at necropsy probed for caspase-3, GSDME and actin loading control (d), right flank tumor growth (e) and tumor-free survival (f). g, Comparison of growth of orthotopic EV and mGSDME+ 4T1E tumors in WT (n=7 mice/group) and Prf1−/− (EV n=6 mice/group, mGSDME n=7 mice/group) BALB/c mice. The area under the growth curves was compared by two-tailed Student’s t-test. Log-rank test was used for survival analysis. Data are mean + SEM and are representative of two independent experiments.
Figure 3.
Figure 3.. Killer cells cleave GSDME and induce GSDME-dependent pyroptosis in target cells.
Cell death induced by YT NK in EV and hGSDME-expressing HeLa, assessed by CellTiter-Glo (a, E:T ratio=2:1, 4 h), SYTOX green uptake (b, E:T ratios indicated) and LDH release (c, E:T ratio=2:1, 4 h). d, Time-lapse confocal microscopy images of co-cultures of Vybrant DiD-labeled YT (magenta) with EV and hGSDME+ HeLa in SYTOX green containing medium. e, Caspase-3 and GSDME cleavage and HMGB1 release in HeLa incubated with YT at indicated E:T ratios for 4 h, assessed by immunoblot. Comparisons were calculated by two-tailed Student’s t-test (a,c) or by one-way ANOVA with Holm-Sidak method for multiple comparisons (b). Data are mean ± SD of biological triplicates and are representative of three independent experiments. *** P<0.0001. Scale bar, 10 μm.
Figure 4.
Figure 4.. GzmB directly cleaves GSDME to cause pyroptosis.
a, Immunoblot of hGSDME+ HeLa after no treatment (UNT) or treatment with YT or NK92 or TRAIL for 4 h or raptinal for 1 h. b, Effect of EGTA, zVAD-fmk and zDEVD-fmk on YT-induced SYTOX green uptake in EV and hGSDME+ HeLa. c,d, Expression of GSDME and caspase-3 (c) and YT-induced SYTOX green uptake (d) in hGSDME+ and hGSDME- Casp3−/− HeLa. e,f, Immunoblots, probed for FLAG-GSDMD (e, left) or FLAG-GSDME (e, right; f), of cell lysates of HEK293T expressing FLAG-tagged WT or D270A (f, right lanes) hGSDME after 1 h incubation with PBS (UNT) or recombinant GzmA or GzmB (800 nM). g, Immunoblots, probed for GSDME, of cell lysates of hGSDME+ HeLa, knocked out or not for Casp3, after 1 h incubation with GzmB. h, Coomassie-stained SDS-PAGE gel of in vitro reaction of recombinant GzmB incubated with recombinant hGSDME for 1 h. *, N-terminal (NT) and C-terminal (CT) GSDME cleavage products. i, SH-SY5Y treated with PFN ± GzmB or medium (UNT) for 2 h or indicated times were analyzed by immunoblot of cell lysates probed for caspase-3, GSDME or tubulin. j,k, Effects of GSDME knockout (KO) on PFN ± GzmB-induced SH-SY5Y cell death and pyroptosis assessed after 1 h by CellTiter-Glo (j), SYTOX green uptake (k). Differences among multiple groups in (b,d,j,k) were analyzed by one-way ANOVA using the Holm-Sidak method for multiple comparisons. Data are mean ± SD of biological triplicates and are representative of three (a-h) or two (i-k) independent experiments. *** P<0.0001.

Comment in

References

    1. Liu X & Lieberman J A Mechanistic Understanding of Pyroptosis: The Fiery Death Triggered by Invasive Infection. Adv. Immunol 135, 81–117 (2017). - PMC - PubMed
    1. de Beeck KO, Van Laer L & Van Camp G DFNA5, a gene involved in hearing loss and cancer: a review. Ann. Otol. Rhinol. Laryngol 121, 197–207 (2012). - PubMed
    1. Rogers C et al. Cleavage of DFNA5 by caspase-3 during apoptosis mediates progression to secondary necrotic/pyroptotic cell death. Nature Commun. 8, 14128 (2017). - PMC - PubMed
    1. Wang Y et al. Chemotherapy drugs induce pyroptosis through caspase-3 cleavage of a gasdermin. Nature 547, 99–103 (2017). - PubMed
    1. Rogers C et al. Gasdermin pores permeabilize mitochondria to augment caspase-3 activation during apoptosis and inflammasome activation. Nature Commun. 10, 1689 (2019). - PMC - PubMed

Publication types