

Urinary proteomics of Henoch-Schönlein purpura nephritis in children using liquid chromatography-tandem mass spectrometry
- PMID: 32190014
- PMCID: PMC7066733
- DOI: 10.1186/s12014-020-09274-x
Urinary proteomics of Henoch-Schönlein purpura nephritis in children using liquid chromatography-tandem mass spectrometry
Abstract
Background: Henoch-Schönlein purpura nephritis (HSPN) is the principal cause of morbidity and mortality in children with Henoch-Schönlein purpura (HSP). However, the criteria for risk assessment currently used is not satisfactory. The urine proteome may provide important clues to indicate the development of HSPN.
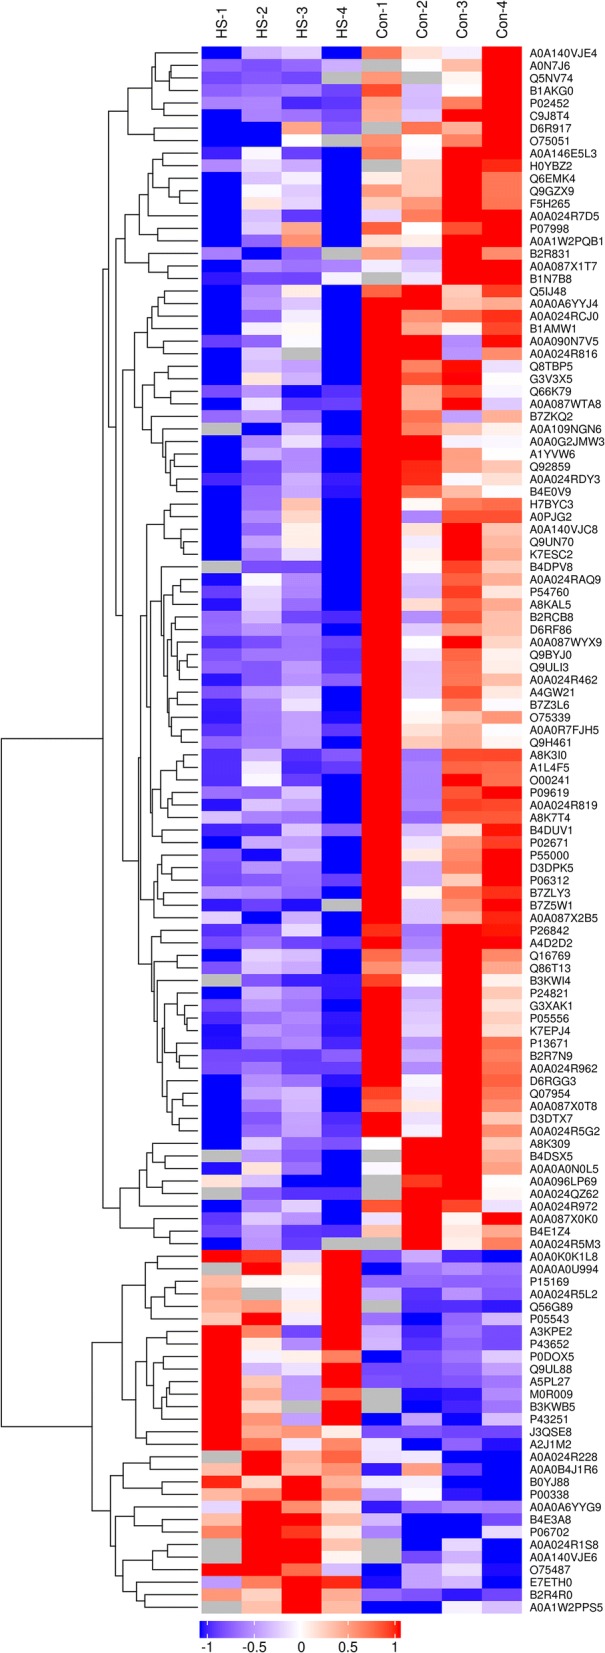
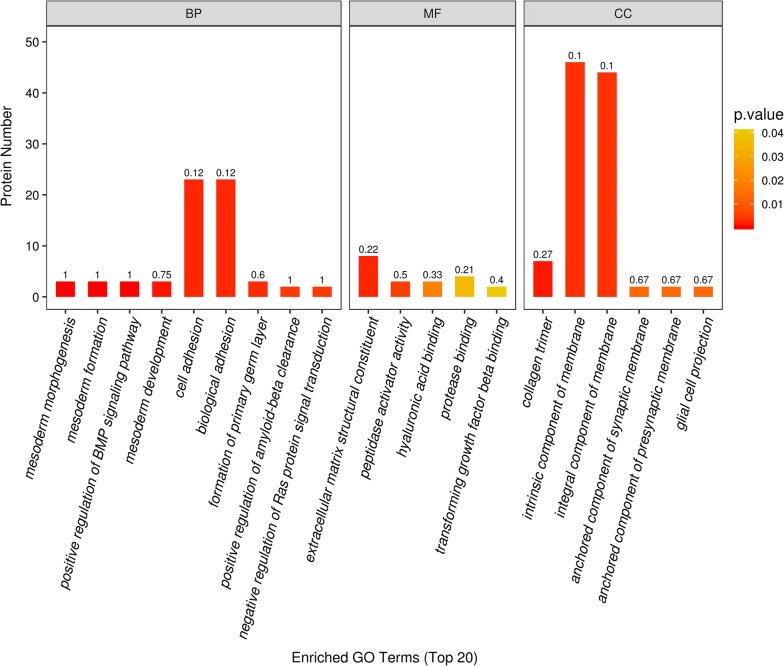
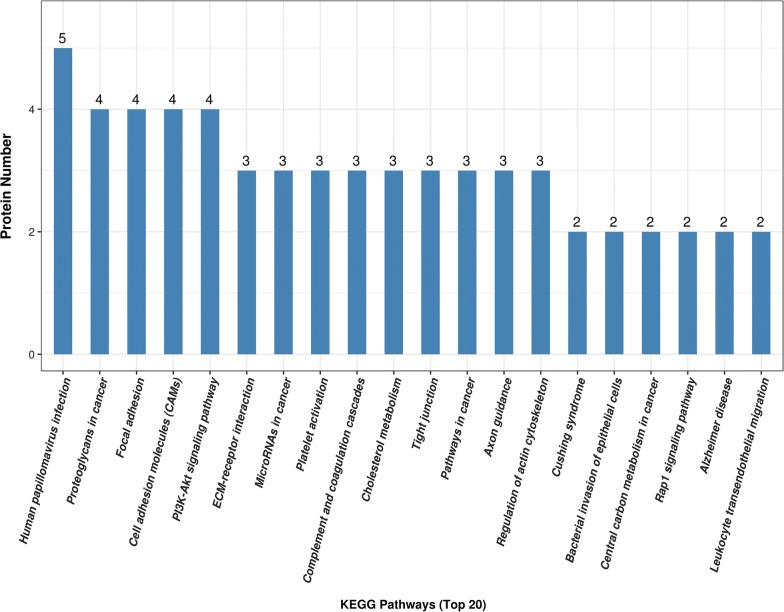
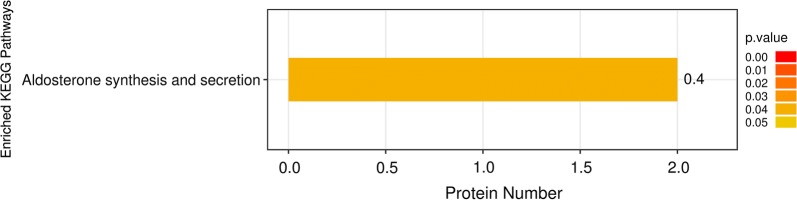
Methods: Here, we detected and compared the urine proteome of patients with HSPN and healthy controls by liquid chromatography-tandem mass spectrometry (LC-MS/MS) in the data-independent acquisition (DIA) mode. The differentially expressed proteins were analysed by gene ontology (GO) analysis and Kyoto Encyclopedia of Genes and Genomes (KEGG) analysis. For validation, enzyme-linked immunosorbent assay (ELISA) was used to analyse the selected proteins.
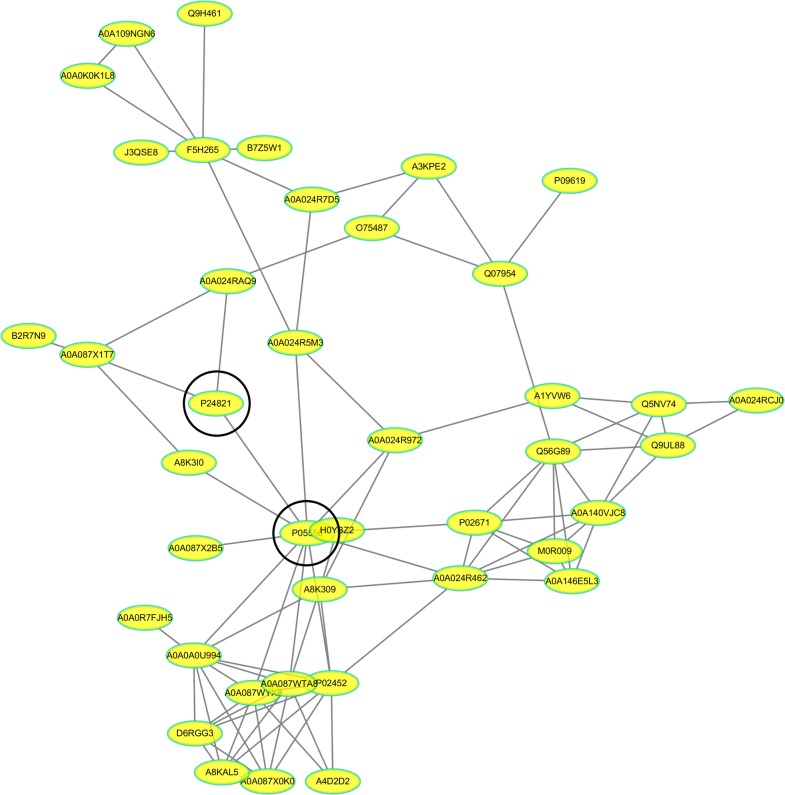
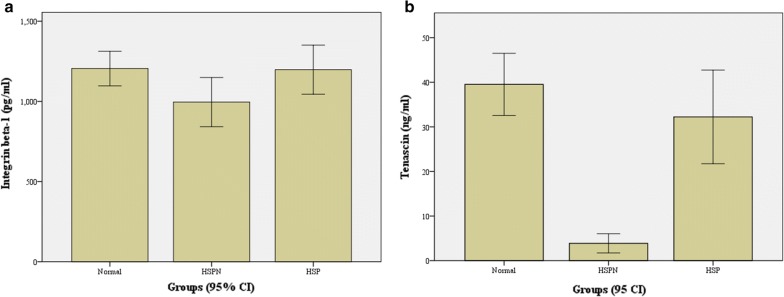
Results: A total of 125 proteins (29 upregulated and 96 downregulated) were found to be differentially expressed in children with HSPN compared with the controls. Forty-one proteins were predicted to have direct interactions. The enriched pathways mainly included focal adhesion, cell adhesion molecules, the PI3K-Akt signalling pathway, ECM-receptor interactions and so on. Cell adhesion related to the pathogenesis of HSPN was the main biological process identified in this study. The decrease in two proteins (integrin beta-1 and tenascin) was validated by ELISA.
Conclusions: Our study provides new insights into the assessment of HSPN progression in children, as well as new potential biomarkers. The data confirm the value of the urinary proteome in capturing the emergence of HSPN.
Keywords: Children; Henoch-Schönlein purpura nephritis; Mass spectrometry; Proteomics; Urine.
© The Author(s) 2020.
Conflict of interest statement
Competing interestsThe authors declare that they have no conflict of interests.
Figures
Similar articles
-
Use of liquid chromatography-tandem mass spectrometry to perform urinary proteomic analysis of children with IgA nephropathy and Henoch-Schönlein purpura nephritis.J Proteomics. 2021 Jan 6;230:103979. doi: 10.1016/j.jprot.2020.103979. Epub 2020 Sep 12. J Proteomics. 2021. PMID: 32932007
-
Proteomic analysis of urine reveals biomarkers for identification of kidney injury in children's abdominal-type Henoch-Schönlein purpura.Technol Health Care. 2025 Apr 27:9287329251324829. doi: 10.1177/09287329251324829. Online ahead of print. Technol Health Care. 2025. PMID: 40289489
-
Exploring potential predictors of Henoch-Schönlein purpura nephritis: a pilot investigation on urinary metabolites.Eur J Pediatr. 2024 Jul;183(7):3117-3128. doi: 10.1007/s00431-024-05573-9. Epub 2024 Apr 26. Eur J Pediatr. 2024. PMID: 38668796
-
Henoch-Schönlein purpura nephritis in children: incidence, pathogenesis and management.World J Pediatr. 2015 Feb;11(1):29-34. doi: 10.1007/s12519-014-0534-5. Epub 2014 Dec 29. World J Pediatr. 2015. PMID: 25557596 Review.
-
Different histological classifications for Henoch-Schönlein purpura nephritis: which one should be used?Pediatr Rheumatol Online J. 2019 Feb 28;17(1):10. doi: 10.1186/s12969-019-0311-z. Pediatr Rheumatol Online J. 2019. PMID: 30819179 Free PMC article. Review.
Cited by
-
A Novel Classifier Based on Urinary Proteomics for Distinguishing Between Benign and Malignant Ovarian Tumors.Front Cell Dev Biol. 2021 Aug 30;9:712196. doi: 10.3389/fcell.2021.712196. eCollection 2021. Front Cell Dev Biol. 2021. PMID: 34527671 Free PMC article.
-
Serum proteomic profiling in patients with advanced Schistosoma japonicum-induced hepatic fibrosis.Parasit Vectors. 2021 May 1;14(1):232. doi: 10.1186/s13071-021-04734-1. Parasit Vectors. 2021. PMID: 33933138 Free PMC article.
-
AZGP1 as a potential biomarker of IgA vasculitis with nephritis in a children‑based urinary proteomics study by diaPASEF.Mol Med Rep. 2023 Aug;28(2):157. doi: 10.3892/mmr.2023.13044. Epub 2023 Jul 7. Mol Med Rep. 2023. PMID: 37417365 Free PMC article.
-
A systematic review of urine biomarkers in children with IgA vasculitis nephritis.Pediatr Nephrol. 2021 Oct;36(10):3033-3044. doi: 10.1007/s00467-021-05107-7. Epub 2021 May 15. Pediatr Nephrol. 2021. PMID: 33993342 Free PMC article.
-
Proanthocyanidins alleviate Henoch-Schönlein purpura by mitigating inflammation and oxidative stress through regulation of the TLR4/MyD88/NF-κB pathway.Skin Res Technol. 2024 Sep;30(9):e13921. doi: 10.1111/srt.13921. Skin Res Technol. 2024. PMID: 39252568 Free PMC article.
References
LinkOut - more resources
Full Text Sources