. 2020 Feb 28:2020:5129562.
doi: 10.1155/2020/5129562. eCollection 2020.

Acupotomy Alleviates Energy Crisis at Rat Myofascial Trigger Points

Affiliations

Acupotomy Alleviates Energy Crisis at Rat Myofascial Trigger Points

Yi Zhang et al. Evid Based Complement Alternat Med. .

Abstract

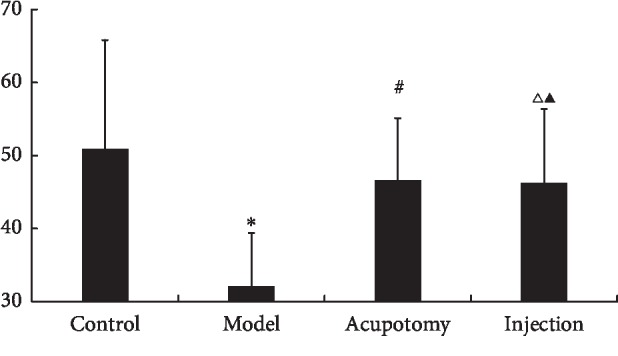
The aim of this study was to determine the effects of acupotomy on energy crises in rat trigger points (TrPs) by measuring mechanical pain thresholds (MPTs) and levels of acetylcholinesterase (AChE), free sarcoplasmic calcium (Ca2+), adenosine 5'-triphosphate (ATP), adenosine 5'-monophosphate (AMP), substance P (SP), and calcitonin gene-related peptide (CGRP) in rat muscle TrP tissue. Male Sprague Dawley rats (n = 32) were randomly divided into four groups: control, TrP, acupotomy, and lidocaine injection. Enzyme-linked immunosorbent assays were used to measure AChE, and free sarcoplasmic Ca2+ concentrations were determined by fluorescent staining with Fura-2 AM; high-performance liquid chromatography was used to measure ATP and AMP, and SP and CGRP were evaluated by immunohistochemistry. Compared with the control group, free sarcoplasmic Ca2+, AMP, SP, and CGRP were higher in the model group, while MPT, AChE, and ATP were lower. Treatment with acupotomy or lidocaine injection reduced free sarcoplasmic Ca2+, SP, and CGRP and increased MPTs and AChE levels compared with the model group. However, only acupotomy also led to decreased AMP and increased ATP levels relative to the model group. We conclude that acupotomy can alleviate energy crises at TrPs.


Conflict of interest statement

The authors declare that there are no conflicts of interest regarding the publication of this paper.

Figures

Figure 1
Figure 1
The flow chart shows procedures applied to the animals in timeline. Model preparation was in the 1st–8th week. Electromyography detection was in the 9th week. Acupotomy and injection were conducted in the 10–12th week. MPT was detected in the 13th week. Sample collection and other tests were in the 14th week and beyond.
Figure 2
Figure 2
(a) The typical endplate potential, which turns negative from baseline. (b) The fibrillation potential, which is positive from baseline and then turns negative. The scanning speed and sensitivity are 10 ms/D and 20 μV/D, respectively.
Figure 3
Figure 3
MPT changes (g) in each group (control, model, acupotomy, and injection; n = 8 per group) determined by the Von Frey mechanical pain stimulator test. P < 0.05 versus the model group. ΔP < 0.05 versus the model group. P < 0.05 versus the model group. The error bars represent standard deviations.
Figure 4
Figure 4
AChE concentrations (pg/mg) in each group (control, model, acupotomy, and injection; n = 8 per group). P < 0.05 compared with the control group, #P < 0.05 compared with the model group, ΔP < 0.05 compared with the model group, and P > 0.05 compared with the acupotomy group. The error bars represent the standard deviations.
Figure 5
Figure 5
Free sarcoplasmic Ca2+ concentrations (nmol/L) in each group (control, model, acupotomy, and injection; n = 8 per group). P < 0.01 compared with the control group, #P < 0.05 compared with the model group, ΔP < 0.05 compared with the model group, and P > 0.05 compared with the acupotomy group. The error bars represent the standard deviations.
Figure 6
Figure 6
ATP and AMP levels (ng/mg) in each group (control, model, acupotomy, and injection; n = 8 per group). P < 0.05 for ATP levels compared with the control group, #P < 0.05 for ATP levels compared with the model group, ΔP > 0.05 for ATP levels compared with the model group, ∗∗P < 0.05 for AMP levels compared with the control group, ##P < 0.05 for AMP levels compared with the model group, and ΔΔP > 0.05 for AMP levels compared with the model group. The error bars represent the standard deviations.
Figure 7
Figure 7
Immunohistochemistry for SP (light microscopy, ×200). SP expression was yellowish brown in muscle fibers. SP and CGRP levels by group (control, model, acupotomy, and injection; n = 8 per group). P < 0.05 for SP compared with the control group; #P < 0.05 for SP compared with the model group; ΔP < 0.05 for SP compared with the model group; P > 0.05 for SP compared with the acupotomy group. The error bars represent the standard deviations. (a) Control group. (b) Model group. (c) Acupotomy group. (d) Injection group. (e) SP IOD.
Figure 8
Figure 8
Immunohistochemistry for CGRP (light microscopy, ×200). CGRP expression was yellowish brown in muscle fibers. CGRP levels were significantly higher in the model group than the control (P < 0.05), acupotomy (P < 0.05), and injection (P < 0.05) groups. There was no significant difference in CGRP content between the acupotomy and injection groups (P > 0.05). SP and CGRP levels by group (control, model, acupotomy, and injection; n = 8 per group). P < 0.05 for CGRP compared with the control group; #P < 0.05 for CGRP compared with the model group; P > 0.05 for CGRP compared with the acupotomy group; ΔP < 0.05 for CGRP compared with the model group. The error bars represent the standard deviations. (a) Control group. (b) Model group. (c) Acupotomy group. (d) Injection group. (e) CGRP IOD.

Similar articles

Cited by

References

    1. Money S. Pathophysiology of trigger points in myofascial pain syndrome. Journal of Pain & Palliative Care Pharmacotherapy. 2017;31(2):158–159. doi: 10.1080/15360288.2017.1298688. - DOI - PubMed
    1. Chen C. K., Nizar A. J. Myofascial pain syndrome in chronic back pain patients. The Korean Journal of Pain. 2011;24(2):100–104. doi: 10.3344/kjp.2011.24.2.100. - DOI - PMC - PubMed
    1. Simons D. G., Travell J. Myofascial trigger points, a possible explanation. Pain. 1981;10:106–109. - PubMed
    1. Simons D. G. New views of myofascial trigger points: etiology and diagnosis. Archives of Physical Medicine and Rehabilitation. 2008;89(1):157–159. doi: 10.1016/j.apmr.2007.11.016. - DOI - PubMed
    1. Huang Q.-M., Ye G., Zhao Z.-Y., Lv J.-J., Tang L. Myoelectrical activity and muscle morphology in a rat model of myofascial trigger points induced by blunt trauma to the vastus medialis. Acupuncture in Medicine. 2013;31(1):65–73. doi: 10.1136/acupmed-2012-010129. - DOI - PubMed