. 2020 Apr;12(4):299-310.
doi: 10.3892/mco.2020.1991. Epub 2020 Jan 30.

Network-based identification of signature genes KLF6 and SPOCK1 associated with oral submucous fibrosis

Affiliations

Network-based identification of signature genes KLF6 and SPOCK1 associated with oral submucous fibrosis

Prithvi Singh et al. Mol Clin Oncol. 2020 Apr.

Abstract

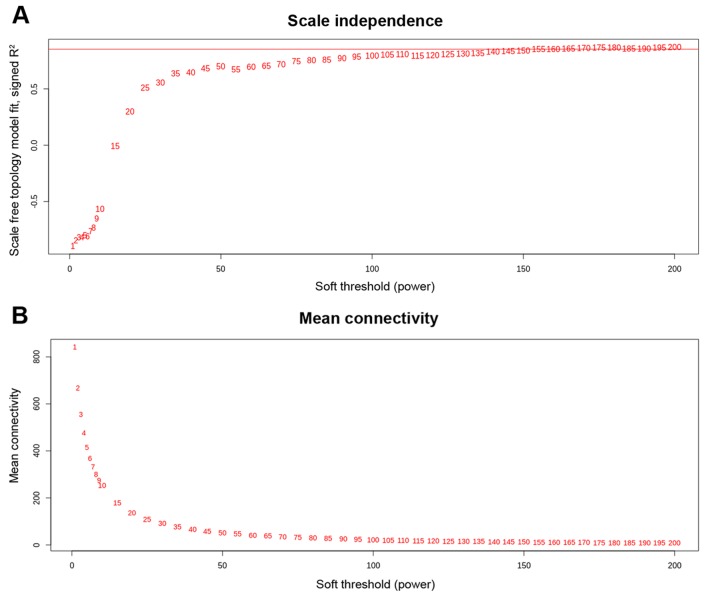
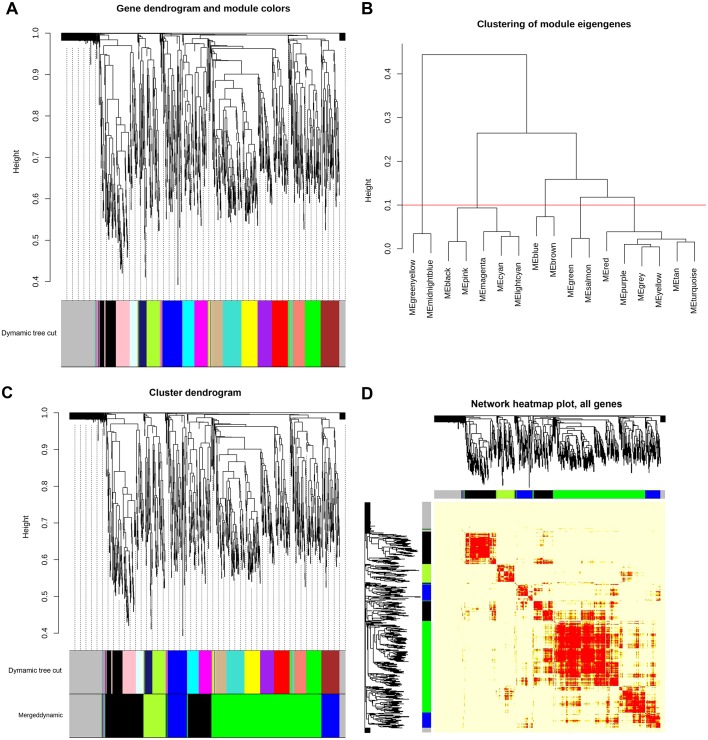
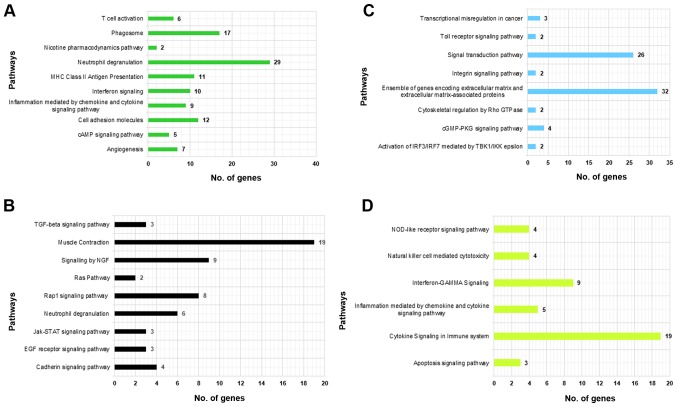
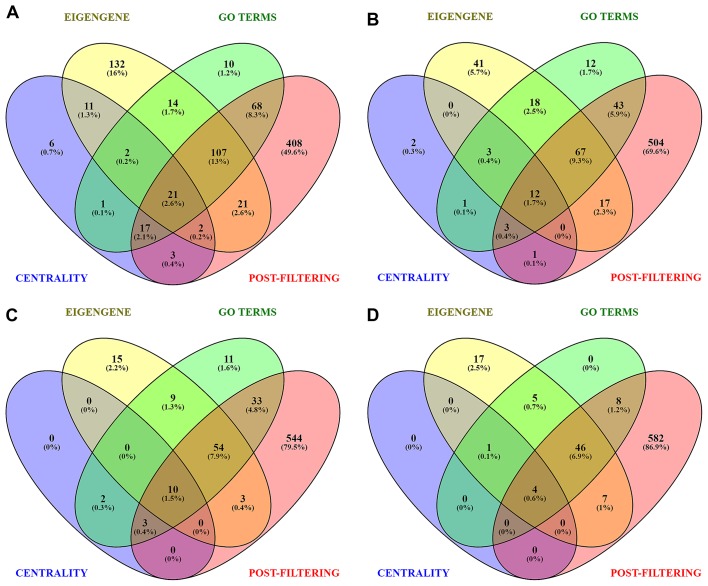
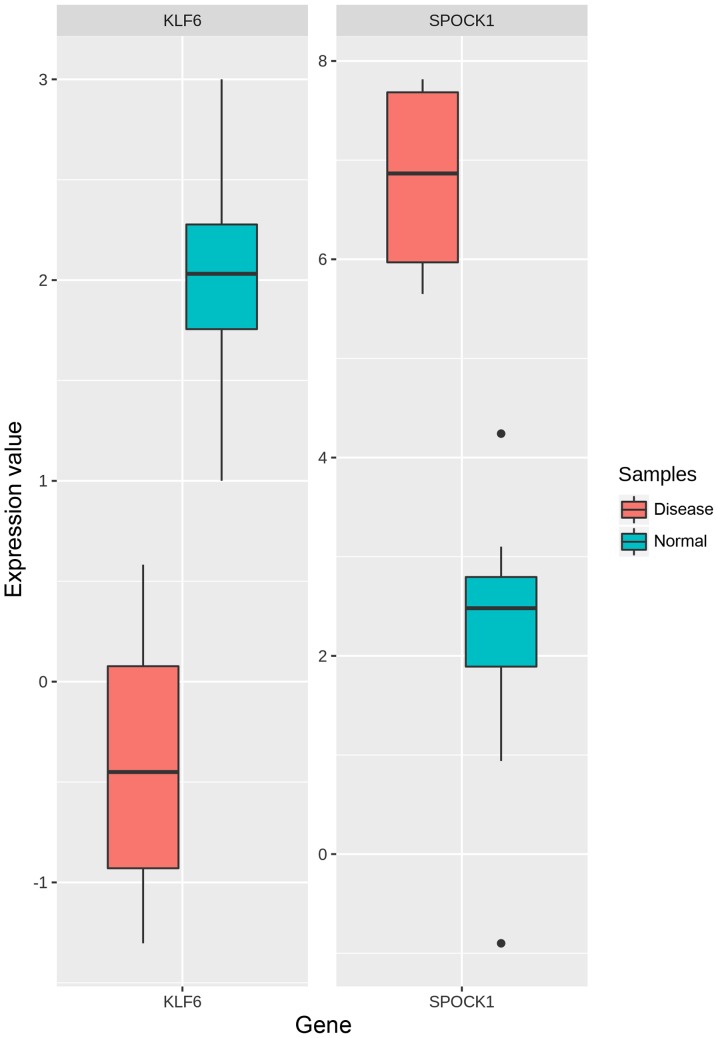
The molecular mechanism of oral submucous fibrosis (OSF) is yet to be fully elucidated. The identification of reliable signature genes to screen patients with a high risk of OSF and to provide oral cancer surveillance is therefore required. The present study produced a filtering criterion based on network characteristics and principal component analysis, and identified the genes that were involved in OSF prognosis. Two gene expression datasets were analyzed using meta-analysis, the results of which revealed 1,176 biologically significant genes. A co-expression network was subsequently constructed and weighted gene modules were detected. The pathway and functional enrichment analyses of the present study allowed for the identification of modules 1 and 2, and their respective genes, SPARC (osteonectin), cwcv and kazal like domain proteoglycan 1 (SPOCK1) and kruppel like factor 6 (KLF6), which were involved in the occurrence of OSF. The results revealed that both genes had a prominent role in epithelial to mesenchymal transition during OSF progression. The genes identified in the present study require further exploration and validation within clinical settings to determine their roles in OSF.

Keywords: eigengene; epithelial to mesenchymal transition; meta-analysis; module; protein-protein interaction; singular value decomposition; weighted gene co-expression network analysis.


Figures

Figure 1.
Figure 1.
Network topology analysis of several soft-threshold powers in weighted gene co-expression network analysis, where (A) depicts R2 as a function of β and (B) depicts mean connectivity as a function of β.
Figure 2.
Figure 2.
WGCNA co-expression network and module detection analysis. (A) represents clustering dendrogram of genes with dissimilarity based on topological overlap. A total of 16 distinct modules are presented with different assigned colors in the horizontal bar below the dendrogram, with grey representing unassigned genes in any module. (B) Hierarchical clustering of 16 module eigengenes. The distance (1-TOM) is denoted by the y-axis and different MEs are denoted by the x-axis (labled as color with ME prefixed in each color module). The horizontal red line (1-TOM=0.10) depicts the benchmark for defining meta-modules. The green, blue, black and green-yellow modules illustrate meta-modules, while grey colored eigengenes were not assigned to any meta-module. (C) Original and merged co-expression modules with assigned original module colors and merged module colors. Genes were clustered based on a dissimilarity measure (1-TOM). The branches correspond to modules of highly correlated or interconnected groups of genes. Colors in the horizontal bar depict the modules before and after merging. Cluster dendrograms of genes with dissimilarity based on topological overlap is presented above the modules. A total of 16 original modules were merged to obtain 4 highly significant meta-modules denoted by the colors green, black, blue and green-yellow. Grey colored modules represent unassigned genes. (D) Heatmap plot of the weighted gene co-expression network. The plot indicates the TOM among all genes analyzed. Genes in columns and their corresponding rows are hierarchically clustered by cluster dendrograms, which are presented along the top and left side of the plot. Color-coded module membership is presented with colored bars (green, black, blue, green-yellow and grey) below and to the right of dendrograms. Green, black, blue and green-yellow colors signify the 4 significant meta-modules and grey represents the insignificant module. Progressively light and darker red colors in the matrix signify lower and higher overlap among genes. High co-expression interconnectedness are indicated by progressively more saturated yellow to red colors. TOM, topological overlap matrix; ME, module eigengene.
Figure 3.
Figure 3.
Representation of the top 20% significantly enriched GO terms. Top 20% of significantly enriched gene ontology terms (molecular function and biological process) using DAVID and ToppFun software, presented as pie-charts for (A) Module-1, (B) Module-2, (C) Module-3 and (D) Module-4.
Figure 4.
Figure 4.
Representation of the top 20% significantly enriched pathways. Top 20% significantly enriched pathways obtained using WebGestalt and ToppFun platforms, presented as clustered bar charts for (A) Module-1, (B) Module-2, (C) Module-3 and (D) Module-4.
Figure 5.
Figure 5.
Venn plots for Set-A, B, C and D. (A) Identification of signature genes using top ranked unique genes (Centrality set), significant GO terms (GO Terms set), eigengene based on principal component analysis correlation (Eigengene set) and Post-filtering set. The genes shared by all four sets revealed potent signature genes from (A) Module-1(21), (B) Module-2(12), (C) Module-3(10) and (D) Module-4(4). Blue represents centrality Set-A, green represents significant GO term Set-B, yellow represents eigengene Set-C and red represents post-filtering Set-D. GO, gene ontology.
Figure 6.
Figure 6.
Box-and-whisker plot comparing the relative gene expression of KLF6 and SPOCK1 in OSF and normal samples. The centre line of each box indicates the median result. SPOCK1, SPARC (osteonectin), cwcv and kazal like domain proteoglycan 1; KLF6, kruppel like factor 6. OSF, oral submucous fibrosis.

Similar articles

Cited by

References

    1. Bari S, Metgud R, Vyas Z, Tak A. An update on studies on etiological factors, disease progression, and malignant transformation in oral submucous fibrosis. J Cancer Res Ther. 2017;13:399–405. doi: 10.4103/0973-1482.179524. - DOI - PubMed
    1. Ray JG, Ranganathan K, Chattopadhyay A. Malignant transformation of oral submucous fibrosis: Overview of histopathological aspects. Oral Surg Oral Med Oral Pathol Oral Radiol. 2016;122:200–209. doi: 10.1016/j.oooo.2015.11.024. - DOI - PubMed
    1. Ekanayaka RP, Tilakaratne WM. Oral submucous fibrosis: Review on mechanisms of pathogenesis and malignant transformation. J Carcinog Mutagen, 2013. Available from: https://www.omicsonline.org/oral-submucous-fibrosis-a-clinico-histopatho.... - PubMed
    1. Prabhu RV, Prabhu V, Chatra L, Shenai P, Suvarna N, Dandekeri S. Areca nut and its role in oral submucous fibrosis. J Clin Exp Dent. 2014;6:e569–e575. doi: 10.4317/jced.51318. - DOI - PMC - PubMed
    1. Wollina U, Verma SB, Ali FM, Patil K. Oral submucous fibrosis: An update. Clin Cosmet Investig Dermatol. 2015;8:193–204. doi: 10.2147/CCID.S80576. - DOI - PMC - PubMed