

Regional variation in paraspinal muscle composition using chemical shift encoding-based water-fat MRI
- PMID: 32190574
- PMCID: PMC7063279
- DOI: 10.21037/qims.2020.01.10
Regional variation in paraspinal muscle composition using chemical shift encoding-based water-fat MRI
Abstract
Background: Paraspinal musculature forms one of the largest muscle compartments of the human body, but evidence for regional variation of its composition and dependency on gender or body mass index (BMI) is scarce.
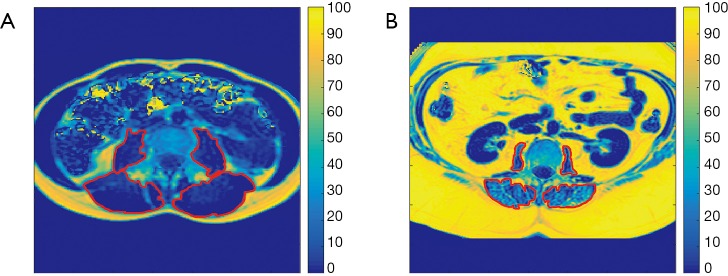
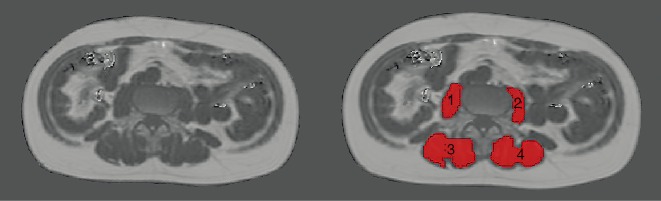
Methods: This study applied six-echo chemical shift encoding-based water-fat magnetic resonance imaging (MRI) at 3 Tesla in 76 subjects (24 males and 52 females, age: 40.0±13.7 years, BMI: 25.4±5.6 kg/m2) to evaluate the proton density fat fraction (PDFF) of psoas muscles and erector spinae muscles, with the latter being divided into three segments in relation to levels of spine anatomy (L3-L5, T12-L2, and T9-T11).
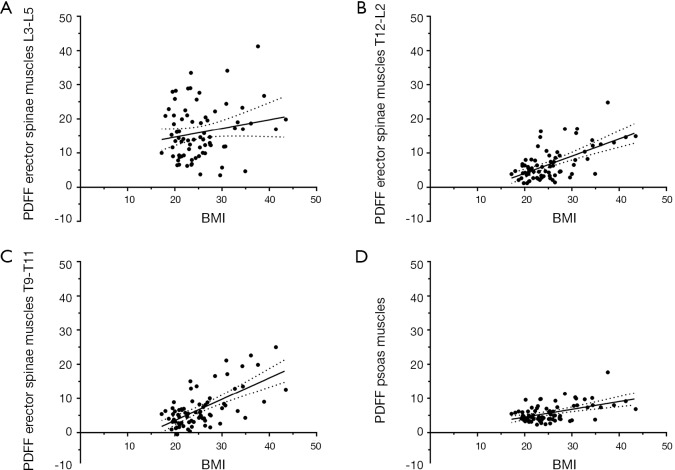
Results: For the psoas muscles and the erector spinae muscles (L3-L5), gender differences in PDFF values were observed (PDFF psoas muscles: males: 5.1%±3.4% vs. females: 6.0%±2.2%, P=0.006; PDFF erector spinae muscles L3-L5: males: 10.7%±7.6% vs. females: 18.2%±6.8%, P<0.001). Furthermore, the PDFF of the erector spinae muscles (L3-L5) showed higher PDFF values when compared to the other segments (PDFF erector spinae muscles L3-L5 vs. T12-L2: P<0.001; PDFF erector spinae muscles L3-L5 vs. T9-T11: P<0.001) and showed to be independent of BMI, which was not the case for the other segments (T12-L2 or T9-T11) or the psoas muscles. When considering age and BMI as control variables, correlations of PDFF between segments of the erector spinae muscles remained significant for both genders.
Conclusions: This study explored regional variation of paraspinal muscle composition and dependency on gender and BMI, thus offering new insights into muscle physiology. The PDFF of the erector spinae muscles (L3-L5) was independent of BMI, suggesting that this level may be suited for representative paraspinal muscle segmentation and PDFF extraction as a biomarker for muscle alterations in the future.
Keywords: Muscular fat deposition; paraspinal musculature; proton density fat fraction (PDFF); quantitative imaging; spine.
2020 Quantitative Imaging in Medicine and Surgery. All rights reserved.
Conflict of interest statement
Conflicts of Interest: The authors have no conflicts of interest to declare.
Figures
References
LinkOut - more resources
Full Text Sources