

Can Social Policies Improve Health? A Systematic Review and Meta-Analysis of 38 Randomized Trials
- PMID: 32191359
- PMCID: PMC7296440
- DOI: 10.1111/1468-0009.12451
Can Social Policies Improve Health? A Systematic Review and Meta-Analysis of 38 Randomized Trials
Abstract
Policy Points Social policies might not only improve economic well-being, but also health. Health policy experts have therefore advocated for investments in social policies both to improve population health and potentially reduce health system costs. Since the 1960s, a large number of social policies have been experimentally evaluated in the United States. Some of these experiments include health outcomes, providing a unique opportunity to inform evidence-based policymaking. Our comprehensive review and meta-analysis of these experiments find suggestive evidence of health benefits associated with investments in early life, income support, and health insurance interventions. However, most studies were underpowered to detect health outcomes.
Context: Insurers and health care providers are investing heavily in nonmedical social interventions in an effort to improve health and potentially reduce health care costs.
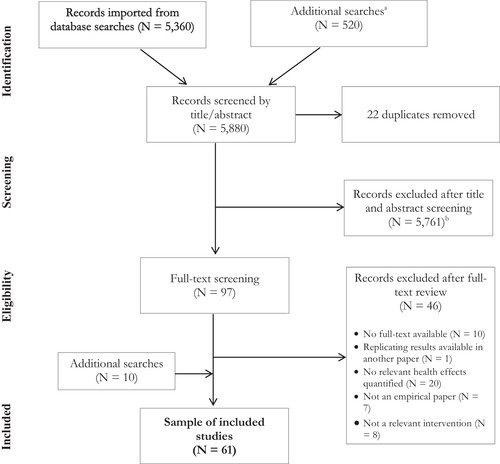
Methods: We performed a systematic review and meta-analysis of all known randomized social experiments in the United States that included health outcomes. We reviewed 5,880 papers, reports, and data sources, ultimately including 61 publications from 38 randomized social experiments. After synthesizing the main findings narratively, we conducted risk of bias analyses, power analyses, and random-effects meta-analyses where possible. Finally, we used multivariate regressions to determine which study characteristics were associated with statistically significant improvements in health outcomes.
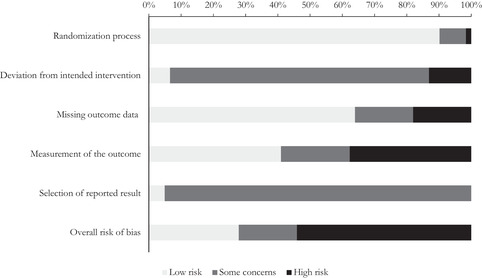
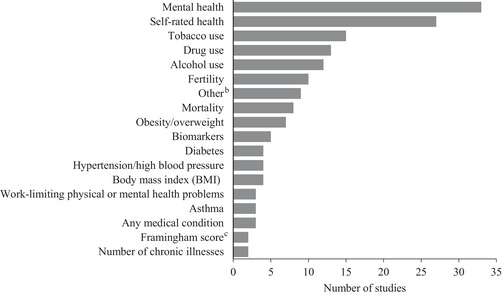
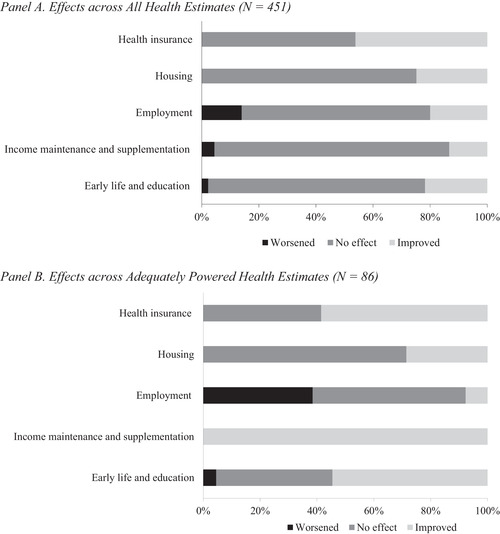
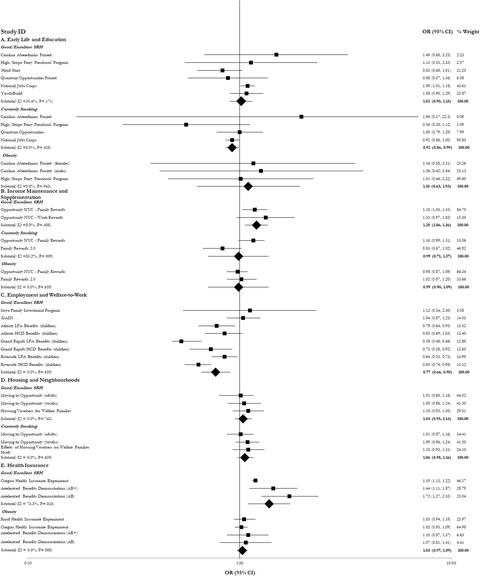
Findings: The risk of bias was low in 17 studies, moderate in 11, and high in 33. Of the 451 parameter estimates reported, 77% were underpowered to detect health outcomes. Among adequately powered parameters, 49% demonstrated a significant health improvement, 44% had no effect on health, and 7% were associated with significant worsening of health. In meta-analyses, early life and education interventions were associated with a reduction in smoking (odds ratio [OR] = 0.92, 95% confidence interval [CI] 0.86-0.99). Income maintenance and health insurance interventions were associated with significant improvements in self-rated health (OR = 1.20, 95% CI 1.06-1.36, and OR = 1.38, 95% CI 1.10-1.73, respectively), whereas some welfare-to-work interventions had a negative impact on self-rated health (OR = 0.77, 95% CI 0.66-0.90). Housing and neighborhood trials had no effect on the outcomes included in the meta-analyses. A positive effect of the trial on its primary socioeconomic outcome was associated with higher odds of reporting health improvements. We found evidence of publication bias for studies with null findings.
Conclusions: Early life, income, and health insurance interventions have the potential to improve health. However, many of the included studies were underpowered to detect health effects and were at high or moderate risk of bias. Future social policy experiments should be better designed to measure the association between interventions and health outcomes.
Keywords: policy analysis; population health; randomized controlled trials; social determinants of health; social experiments.
© 2020 The Authors. The Milbank Quarterly published by Wiley Periodicals LLC on behalf of The Millbank Memorial Fund.
Figures
References
-
- Tountas Y. The historical origins of the basic concepts of health promotion and education: the role of ancient Greek philosophy and medicine. Health Promot Int. 2009;24(2):185‐192. - PubMed
-
- Virchow R. Notes on the typhoid epidemic prevailing in Upper Silesia. Arch Pathologische Anatomic Physiologic Klinische Medizin. 1849;2:143‐322.
-
- Feinstein JS. The relationship between socioeconomic status and health: a review of the literature. Milbank Q. 1993;71(2):279‐322. - PubMed
-
- Adler NE, Ostrove JM. Socioeconomic status and health: what we know and what we don't. Ann N Y Acad Sci. 2006;896(1):3‐15. - PubMed
-
- Marmot M. Social determinants of health inequalities. Lancet. 2005;365(9464):1099‐1104. - PubMed
Publication types
MeSH terms
Grants and funding
LinkOut - more resources
Full Text Sources
