Observational Study
. 2020 Aug;296(2):E55-E64.
doi: 10.1148/radiol.2020200843. Epub 2020 Mar 19.

Temporal Changes of CT Findings in 90 Patients with COVID-19 Pneumonia: A Longitudinal Study

Affiliations
Observational Study

Temporal Changes of CT Findings in 90 Patients with COVID-19 Pneumonia: A Longitudinal Study

Yuhui Wang et al. Radiology. 2020 Aug.

Abstract

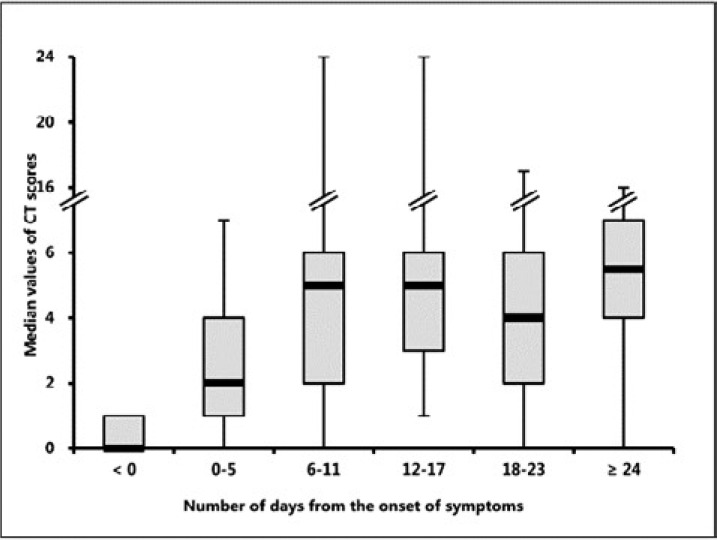
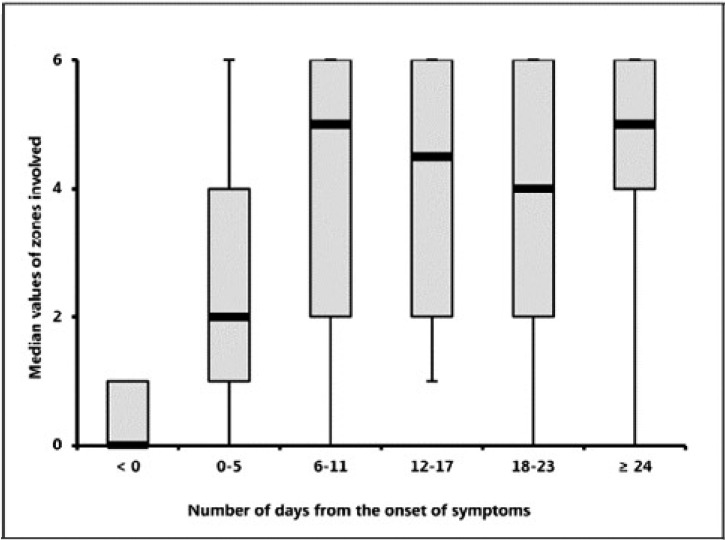
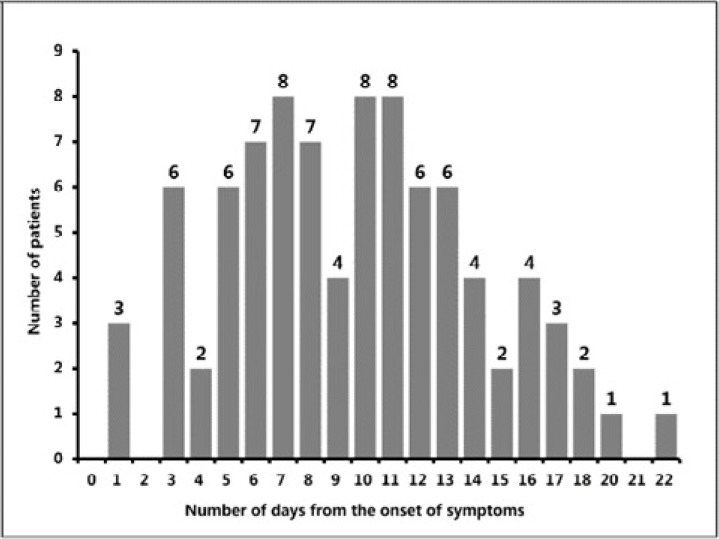
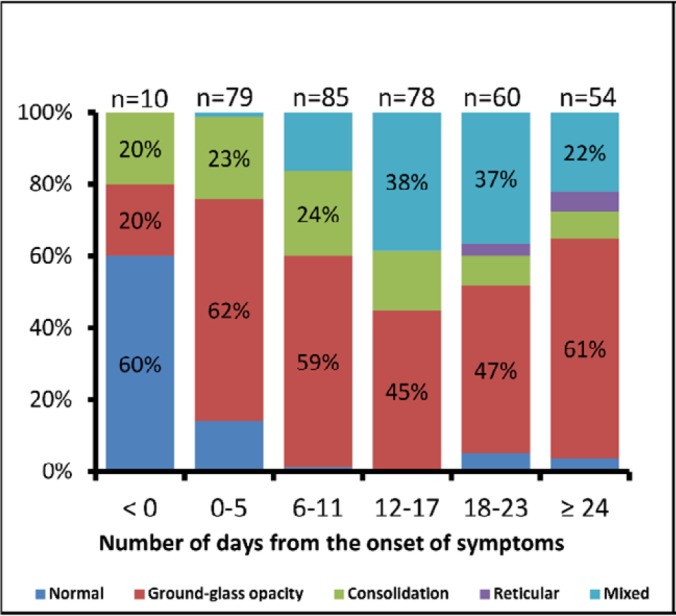
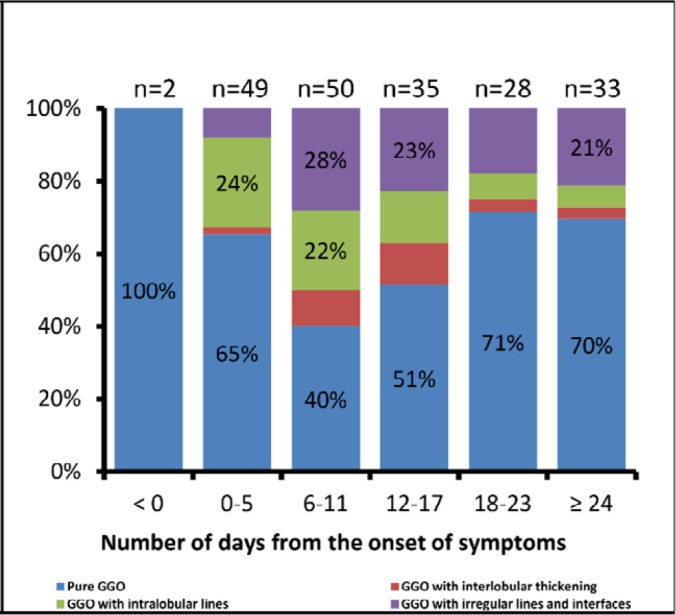
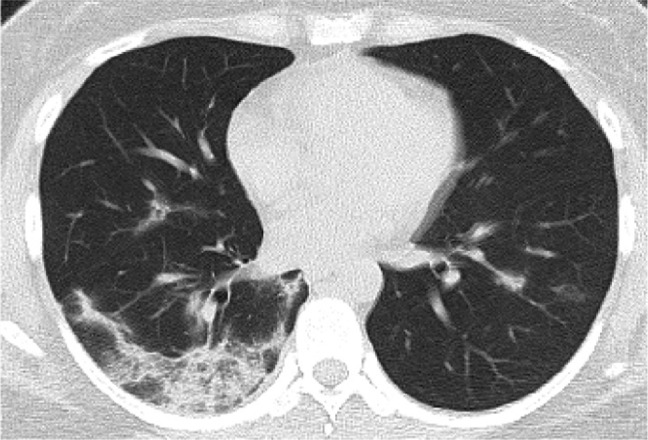
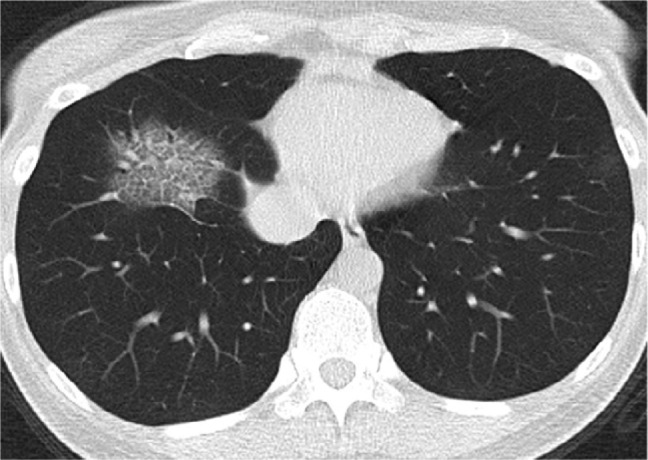
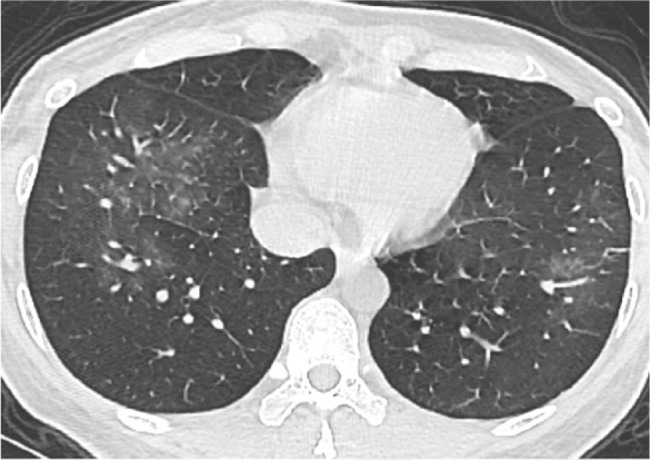
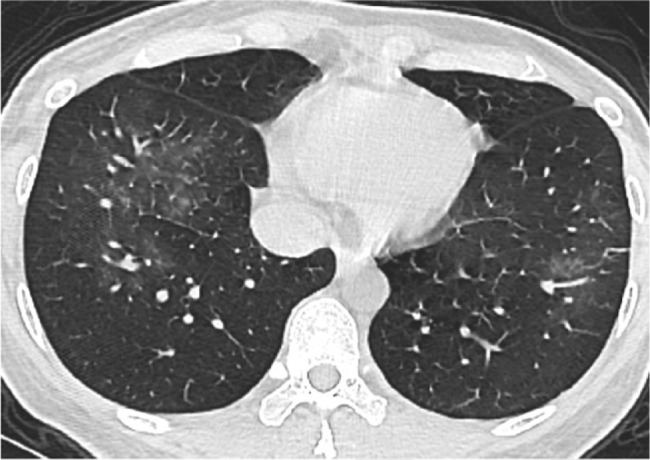
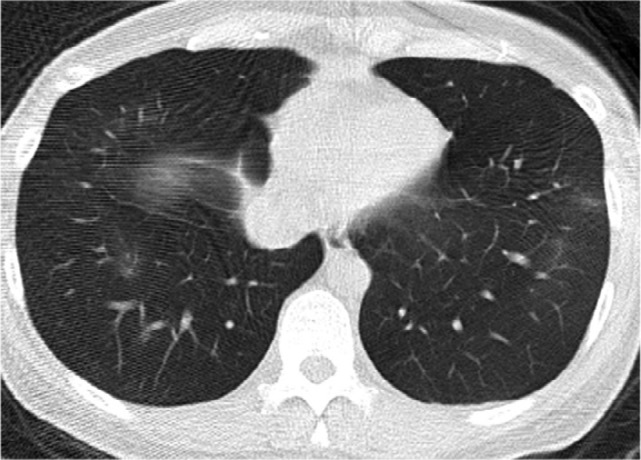
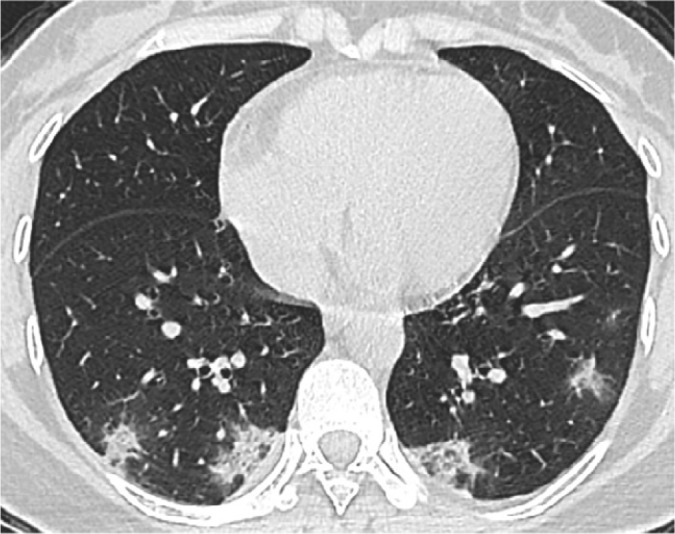
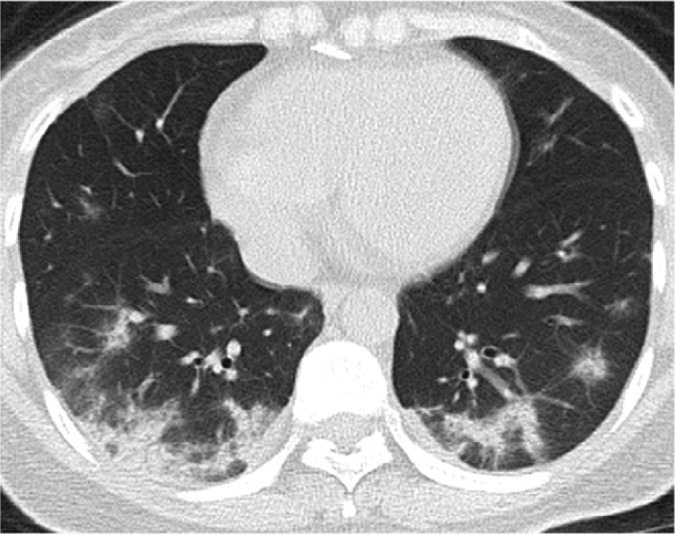
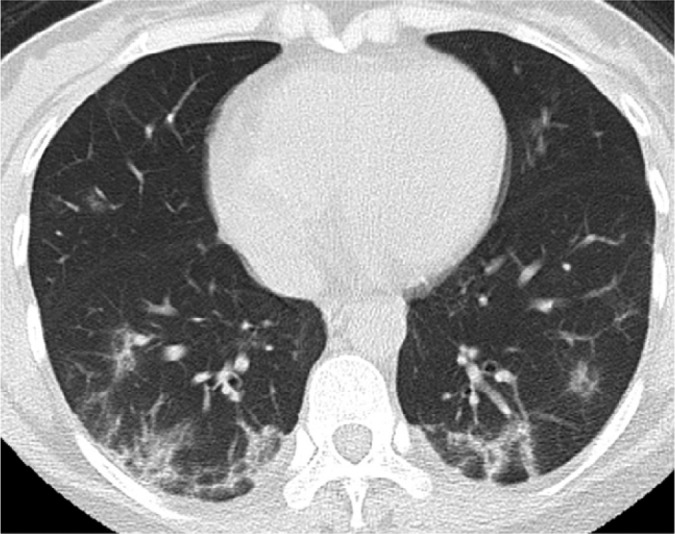
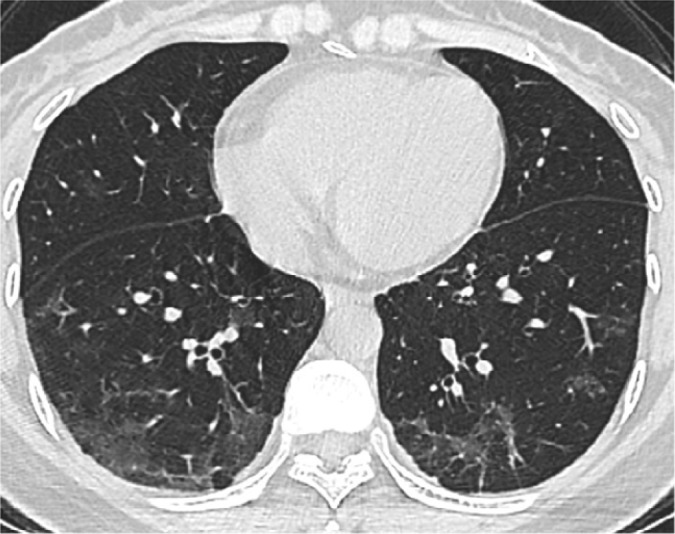
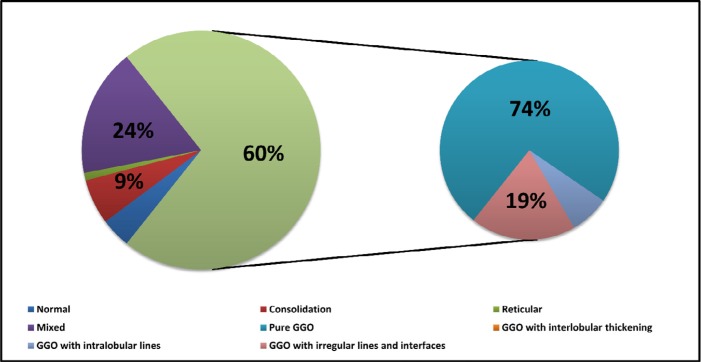
Background CT may play a central role in the diagnosis and management of coronavirus disease 2019 (COVID-19) pneumonia. Purpose To perform a longitudinal study to analyze the serial CT findings over time in patients with COVID-19 pneumonia. Materials and Methods During January 16 to February 17, 2020, 90 patients (33 men, 57 women; mean age, 45 years) with COVID-19 pneumonia were prospectively enrolled and followed up until being discharged, death, or the end of the study. A total of 366 CT scans were acquired and reviewed by two groups of radiologists for the patterns and distribution of lung abnormalities, total CT scores, and number of zones involved. Those features were analyzed for temporal change. Results CT scores and number of zones involved progressed rapidly, peaked during illness days 6-11 (median CT score, 5; median number of zones involved, five), and were followed by persistence of high levels. The predominant pattern of abnormalities after symptom onset was ground-glass opacity (35 of 78 scans [45%] to 49 of 79 scans [62%] in different periods). The percentage of mixed pattern peaked on illness days 12-17 (30 of 78 scans [38%]) and became the second most predominant pattern thereafter. Pure ground-glass opacity was the most prevalent subtype of ground-glass opacity after symptom onset (20 of 50 scans [40%] to 20 of 28 scans [71%]). The percentage of ground-glass opacity with irregular linear opacity peaked on illness days 6-11 (14 of 50 scans [28%]) and became the second most prevalent subtype thereafter. The distribution of lesions was predominantly bilateral and subpleural. Sixty-six of the 70 patients discharged (94%) had residual disease on final CT scans (median CT score, 4; median number of zones involved, four), with ground-glass opacity (42 of 70 patients [60%]) and pure ground-glass opacity (31 of 42 patients [74%]) the most common pattern and subtype. Conclusion The extent of lung abnormalities at CT peaked during illness days 6-11. The temporal changes of the diverse CT manifestations followed a specific pattern, which might indicate the progression and recovery of the illness. © RSNA, 2020 Online supplemental material is available for this article.


Figures

Figure 1a.
Figure 1a.
Temporal change of median values of total CT scores and number of zones involved. Both the median values of total CT scores (a) and number of zones involved (b) increased rapidly after symptom onset, peaked during illness days 6-11, and followed by persistence of high levels. The distribution of days when the peak total CT scores were reached was shown in (c). Note that 2 patients died after the first CT scan, resulting in a total of 88 peaking days.
Figure 1b.
Figure 1b.
Temporal change of median values of total CT scores and number of zones involved. Both the median values of total CT scores (a) and number of zones involved (b) increased rapidly after symptom onset, peaked during illness days 6-11, and followed by persistence of high levels. The distribution of days when the peak total CT scores were reached was shown in (c). Note that 2 patients died after the first CT scan, resulting in a total of 88 peaking days.
Figure 1c.
Figure 1c.
Temporal change of median values of total CT scores and number of zones involved. Both the median values of total CT scores (a) and number of zones involved (b) increased rapidly after symptom onset, peaked during illness days 6-11, and followed by persistence of high levels. The distribution of days when the peak total CT scores were reached was shown in (c). Note that 2 patients died after the first CT scan, resulting in a total of 88 peaking days.
Figure 2a.
Figure 2a.
Temporal change of the main CT patterns and the subtypes of ground-glass opacity. Stacked-bar graphs showed the distribution of the main patterns of lung abnormalities (a) and the subtypes of ground-glass opacity (b) on CT scans at various time points from symptom onset. Categories with percentage ≥ 20% are shown. GGO = ground-glass opacity
Figure 2b.
Figure 2b.
Temporal change of the main CT patterns and the subtypes of ground-glass opacity. Stacked-bar graphs showed the distribution of the main patterns of lung abnormalities (a) and the subtypes of ground-glass opacity (b) on CT scans at various time points from symptom onset. Categories with percentage ≥ 20% are shown. GGO = ground-glass opacity
Figure 3a.
Figure 3a.
Series CT scans in 35-year-old woman with COVID-19 pneumonia. (a) Scan obtained on illness days 1 showed multiple pure ground-glass opacity (GGO) mainly in right lower lobe. (b) Scan obtained on illness days 5 showed increased extent of GGO and early consolidation. (c) Scan obtained on illness days 11 showed multiple consolidation with almost the same extent. (d) Scan obtained on illness days 15 showed a mixed pattern with a slightly smaller extent, and the perilobular consolidation might suggest the presence of organizing pneumonia. The patient was discharged on illness days 17.
Figure 3b.
Figure 3b.
Series CT scans in 35-year-old woman with COVID-19 pneumonia. (a) Scan obtained on illness days 1 showed multiple pure ground-glass opacity (GGO) mainly in right lower lobe. (b) Scan obtained on illness days 5 showed increased extent of GGO and early consolidation. (c) Scan obtained on illness days 11 showed multiple consolidation with almost the same extent. (d) Scan obtained on illness days 15 showed a mixed pattern with a slightly smaller extent, and the perilobular consolidation might suggest the presence of organizing pneumonia. The patient was discharged on illness days 17.
Figure 3c.
Figure 3c.
Series CT scans in 35-year-old woman with COVID-19 pneumonia. (a) Scan obtained on illness days 1 showed multiple pure ground-glass opacity (GGO) mainly in right lower lobe. (b) Scan obtained on illness days 5 showed increased extent of GGO and early consolidation. (c) Scan obtained on illness days 11 showed multiple consolidation with almost the same extent. (d) Scan obtained on illness days 15 showed a mixed pattern with a slightly smaller extent, and the perilobular consolidation might suggest the presence of organizing pneumonia. The patient was discharged on illness days 17.
Figure 3d.
Figure 3d.
Series CT scans in 35-year-old woman with COVID-19 pneumonia. (a) Scan obtained on illness days 1 showed multiple pure ground-glass opacity (GGO) mainly in right lower lobe. (b) Scan obtained on illness days 5 showed increased extent of GGO and early consolidation. (c) Scan obtained on illness days 11 showed multiple consolidation with almost the same extent. (d) Scan obtained on illness days 15 showed a mixed pattern with a slightly smaller extent, and the perilobular consolidation might suggest the presence of organizing pneumonia. The patient was discharged on illness days 17.
Figure 4a.
Figure 4a.
Series CT scans in a 41-year-old woman with COVID-19 pneumonia. (a) Scan obtained on illness days 3 showed ground-glass opacity with intralobular septal thickening (crazy-paving pattern) that affected right lower lobe. (b) Scan obtained on illness days 7 showed intralobular septal thickening superimposed on ground glass opacity with increased extent. Note that patchy ground-glass opacity newly developed in left lower lobe. (c) Scan obtained on illness days 12 showed absorption of abnormalities, with pure ground-glass opacity left in both lower lobes. (d) Scan obtained on illness days 17 showed obvious absorption of abnormalities. Only small pure ground-glass opacity could be observed in both lower lobes. The patient was discharged on illness days 20.
Figure 4b.
Figure 4b.
Series CT scans in a 41-year-old woman with COVID-19 pneumonia. (a) Scan obtained on illness days 3 showed ground-glass opacity with intralobular septal thickening (crazy-paving pattern) that affected right lower lobe. (b) Scan obtained on illness days 7 showed intralobular septal thickening superimposed on ground glass opacity with increased extent. Note that patchy ground-glass opacity newly developed in left lower lobe. (c) Scan obtained on illness days 12 showed absorption of abnormalities, with pure ground-glass opacity left in both lower lobes. (d) Scan obtained on illness days 17 showed obvious absorption of abnormalities. Only small pure ground-glass opacity could be observed in both lower lobes. The patient was discharged on illness days 20.
Figure 4c.
Figure 4c.
Series CT scans in a 41-year-old woman with COVID-19 pneumonia. (a) Scan obtained on illness days 3 showed ground-glass opacity with intralobular septal thickening (crazy-paving pattern) that affected right lower lobe. (b) Scan obtained on illness days 7 showed intralobular septal thickening superimposed on ground glass opacity with increased extent. Note that patchy ground-glass opacity newly developed in left lower lobe. (c) Scan obtained on illness days 12 showed absorption of abnormalities, with pure ground-glass opacity left in both lower lobes. (d) Scan obtained on illness days 17 showed obvious absorption of abnormalities. Only small pure ground-glass opacity could be observed in both lower lobes. The patient was discharged on illness days 20.
Figure 4d.
Figure 4d.
Series CT scans in a 41-year-old woman with COVID-19 pneumonia. (a) Scan obtained on illness days 3 showed ground-glass opacity with intralobular septal thickening (crazy-paving pattern) that affected right lower lobe. (b) Scan obtained on illness days 7 showed intralobular septal thickening superimposed on ground glass opacity with increased extent. Note that patchy ground-glass opacity newly developed in left lower lobe. (c) Scan obtained on illness days 12 showed absorption of abnormalities, with pure ground-glass opacity left in both lower lobes. (d) Scan obtained on illness days 17 showed obvious absorption of abnormalities. Only small pure ground-glass opacity could be observed in both lower lobes. The patient was discharged on illness days 20.
Figure 5a.
Figure 5a.
Series CT scans in a 38-year-old woman with COVID-19 pneumonia. (a) Scan obtained on illness days 8 showed small consolidation scattered in both lower lobes. (b) Scan obtained on illness days 13 showed consolidation with increased extent. (c) Scan obtained on illness days 19 showed a mixed pattern with bandlike consolidation and parenchymal bands in both lower lobes. The perilobular bands of consolidation suggested the possible presence of organizing pneumonia. (d) Scan obtained on illness day 25 showed pure ground-glass opacities with almost the same extent. The patient was discharged on illness days 30.
Figure 5b.
Figure 5b.
Series CT scans in a 38-year-old woman with COVID-19 pneumonia. (a) Scan obtained on illness days 8 showed small consolidation scattered in both lower lobes. (b) Scan obtained on illness days 13 showed consolidation with increased extent. (c) Scan obtained on illness days 19 showed a mixed pattern with bandlike consolidation and parenchymal bands in both lower lobes. The perilobular bands of consolidation suggested the possible presence of organizing pneumonia. (d) Scan obtained on illness day 25 showed pure ground-glass opacities with almost the same extent. The patient was discharged on illness days 30.
Figure 5c.
Figure 5c.
Series CT scans in a 38-year-old woman with COVID-19 pneumonia. (a) Scan obtained on illness days 8 showed small consolidation scattered in both lower lobes. (b) Scan obtained on illness days 13 showed consolidation with increased extent. (c) Scan obtained on illness days 19 showed a mixed pattern with bandlike consolidation and parenchymal bands in both lower lobes. The perilobular bands of consolidation suggested the possible presence of organizing pneumonia. (d) Scan obtained on illness day 25 showed pure ground-glass opacities with almost the same extent. The patient was discharged on illness days 30.
Figure 5d.
Figure 5d.
Series CT scans in a 38-year-old woman with COVID-19 pneumonia. (a) Scan obtained on illness days 8 showed small consolidation scattered in both lower lobes. (b) Scan obtained on illness days 13 showed consolidation with increased extent. (c) Scan obtained on illness days 19 showed a mixed pattern with bandlike consolidation and parenchymal bands in both lower lobes. The perilobular bands of consolidation suggested the possible presence of organizing pneumonia. (d) Scan obtained on illness day 25 showed pure ground-glass opacities with almost the same extent. The patient was discharged on illness days 30.
Figure 6.
Figure 6.
The distribution of CT patterns of the final CT scans at the time of hospital discharge in 70 patients. GGO = ground-glass opacity.

Similar articles

Cited by

References

    1. Li Q, Guan X, Wu P, Wang X, Zhou L, Tong Y, Ren R, Leung KSM, Lau EHY, Wong JY, Xing X, Xiang N, Wu Y, Li C, Chen Q, Li D, Liu T, Zhao J, Li M, Tu W, Chen C, Jin L, Yang R, Wang Q, Zhou S, Wang R, Liu H, Luo Y, Liu Y, Shao G, Li H, Tao Z, Yang Y, Deng Z, Liu B, Ma Z, Zhang Y, Shi G, Lam TTY, Wu JTK, Gao GF, Cowling BJ, Yang B, Leung GM, Feng Z. Early Transmission Dynamics in Wuhan, China, of Novel Coronavirus-Infected Pneumonia. The New England journal of medicine 2020. doi: 10.1056/NEJMoa2001316 - PMC - PubMed
    1. WHO . https://www.who.int/emergencies/diseases/novel-coronavirus-2019/situatio.... (Accessed March 8. 2020).
    1. National Health Commission of the People's Republic of China . The guidlines for the diagnosis and treatment of 2019-nCoV pneumonia (the 5th edition). Available at: http://www.nhc.gov.cn/yzygj/s7653p/202002/d4b895337e19445f8d728fcaf1e3e1.... (Accessed March 8, 2020).
    1. Pan Y, Guan H, Zhou S, Wang Y, Li Q, Zhu T, Hu Q, Xia L. Initial CT findings and temporal changes in patients with the novel coronavirus pneumonia (2019-nCoV): a study of 63 patients in Wuhan, China. European radiology 2020. doi: 10.1007/s00330-020-06731-x - PMC - PubMed
    1. Kanne JP. Chest CT Findings in 2019 Novel Coronavirus (2019-nCoV) Infections from Wuhan, China: Key Points for the Radiologist. Radiology 2020:200241. doi: 10.1148/radiol.2020200241 - PMC - PubMed

Publication types

MeSH terms

LinkOut - more resources