. 2020 Jun 1;130(6):3270-3286.
doi: 10.1172/JCI124382.

c-Rel gain in B cells drives germinal center reactions and autoantibody production

Affiliations

c-Rel gain in B cells drives germinal center reactions and autoantibody production

Maike Kober-Hasslacher et al. J Clin Invest. .

Abstract

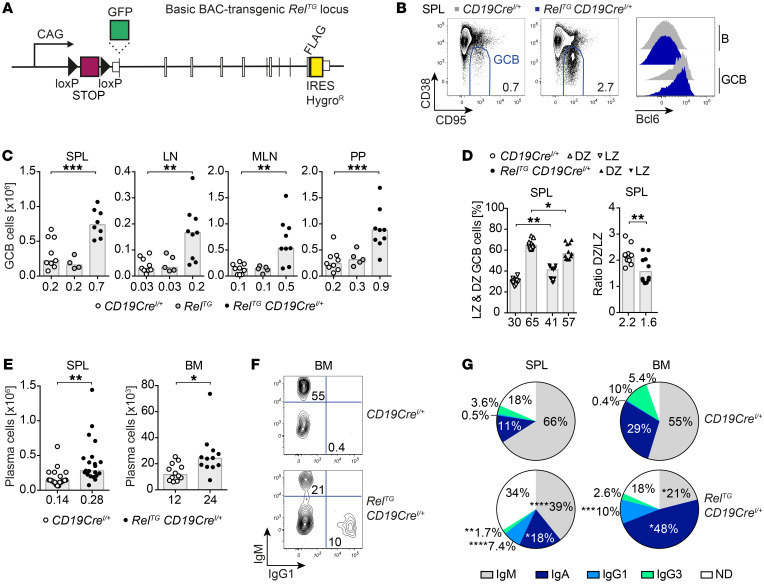
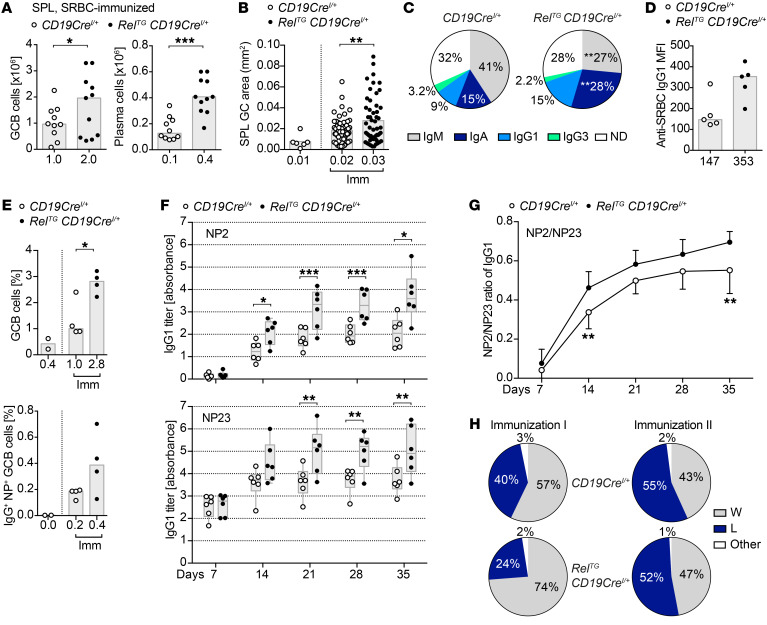
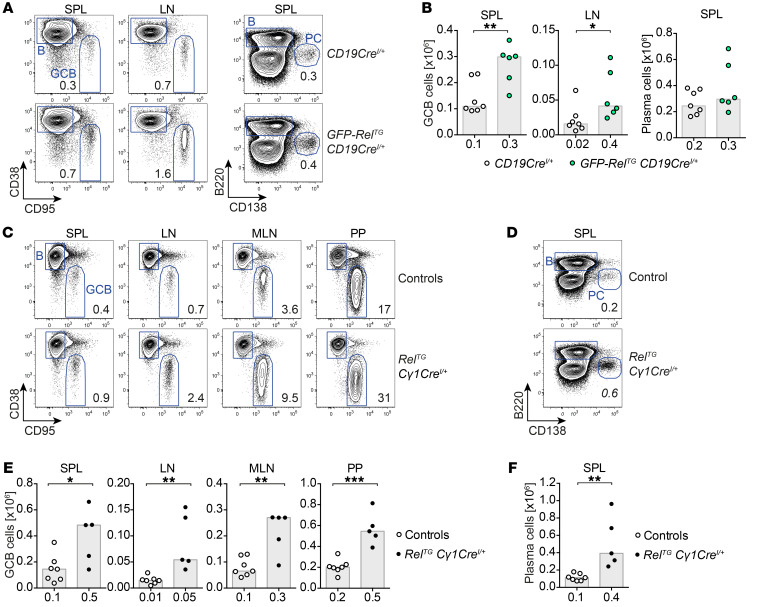
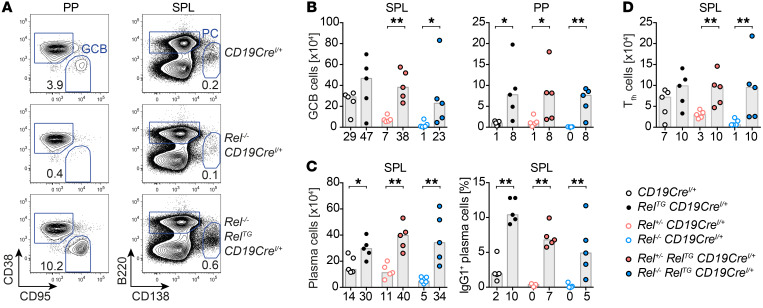
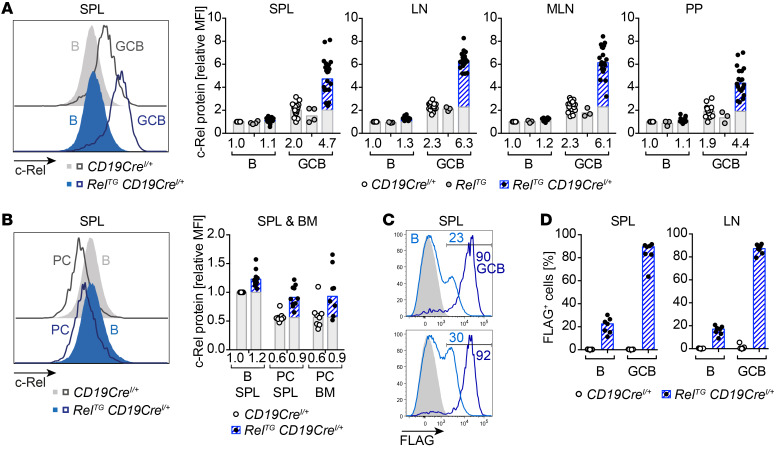
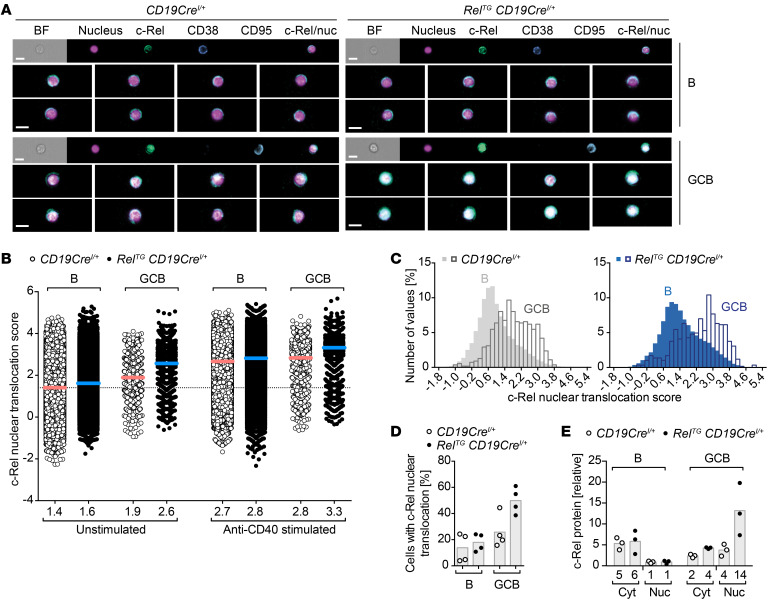
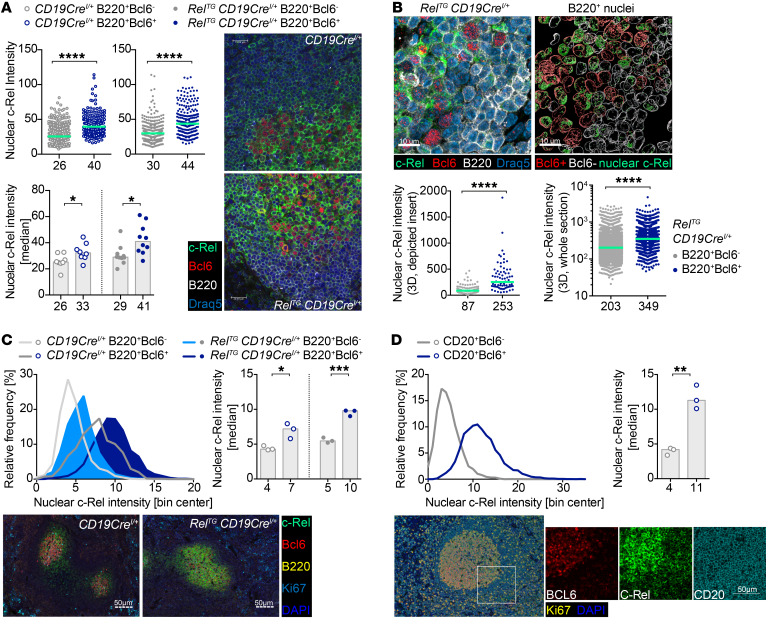
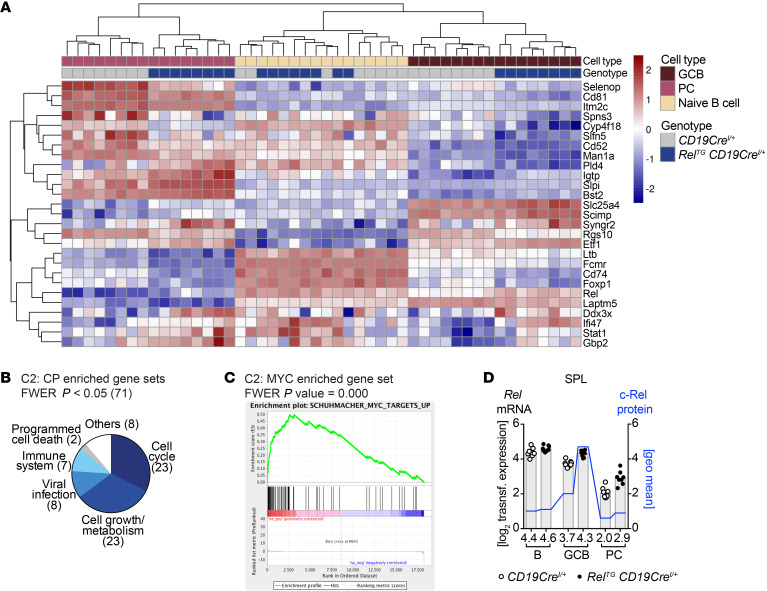
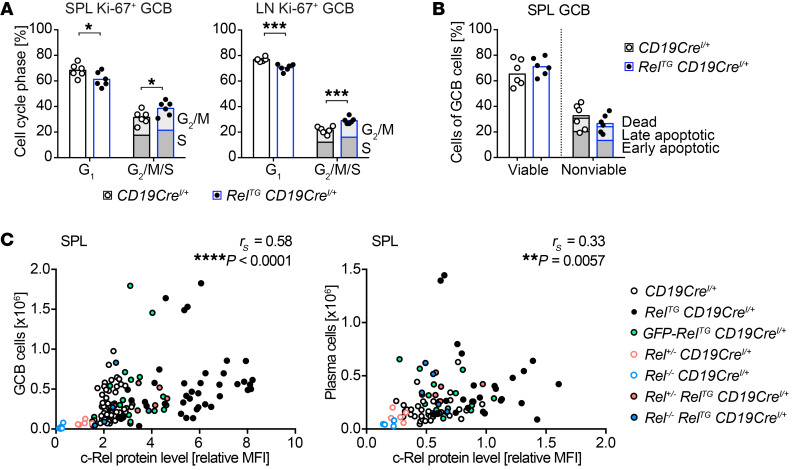
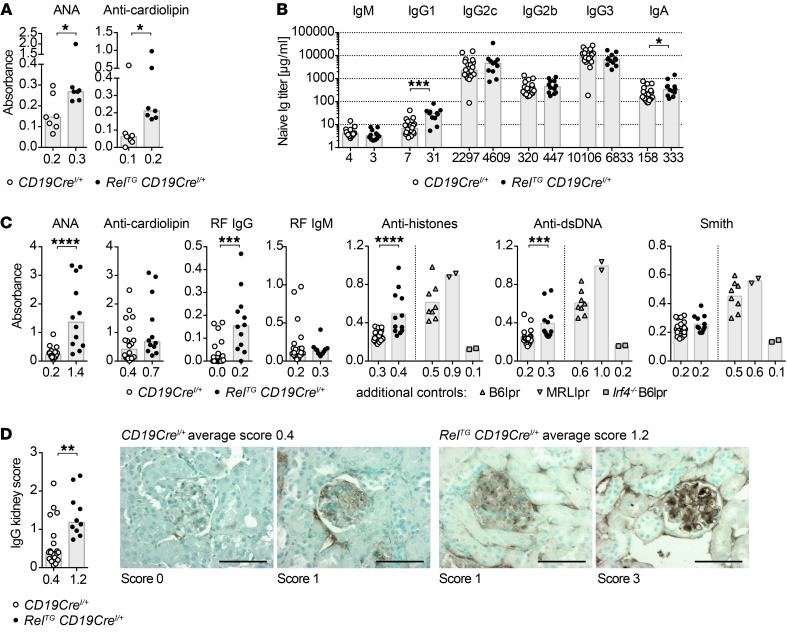
Single-nucleotide polymorphisms and locus amplification link the NF-κB transcription factor c-Rel to human autoimmune diseases and B cell lymphomas, respectively. However, the functional consequences of enhanced c-Rel levels remain enigmatic. Here, we overexpressed c-Rel specifically in mouse B cells from BAC-transgenic gene loci and demonstrate that c-Rel protein levels linearly dictated expansion of germinal center B (GCB) cells and isotype-switched plasma cells. c-Rel expression in B cells of otherwise c-Rel-deficient mice fully rescued terminal B cell differentiation, underscoring its critical B cell-intrinsic roles. Unexpectedly, in GCB cells transcription-independent regulation produced the highest c-Rel protein levels among B cell subsets. In c-Rel-overexpressing GCB cells this caused enhanced nuclear translocation, a profoundly altered transcriptional program, and increased proliferation. Finally, we provide a link between c-Rel gain and autoimmunity by showing that c-Rel overexpression in B cells caused autoantibody production and renal immune complex deposition.

Keywords: Autoimmune diseases; Autoimmunity; B cells; Immunology; NF-kappaB.


Conflict of interest statement

Conflict of interest: The authors have declared that no conflict of interest exists.

Figures

Figure 1
Figure 1. B cell–specific c-Rel overexpression causes spontaneous GCB cell expansion and leads to an accumulation of class-switched plasma cells.
(A) Scheme of the RelTG and GFP-RelTG BAC-transgenic loci. A CAG promoter followed by a loxP-flanked STOP cassette, an N-terminal HA tag or GFP fusion, and a carboxy-terminal FLAG tag were inserted. (B) Representative flow cytometry plots of GCB cells (B220+/CD19+ CD95hiCD38lo). Displayed numbers are median percentages of GCB cells within all B cells (n ≥ 8). Representative flow cytometry histograms of intracellular Bcl6 protein expression. (C) Cell numbers of CD95hiCD38lo GCB cells. Individual data points obtained in 3 or more independent experiments are plotted. Bars and numbers below graphs are median values. **P ≤ 0.01, ***P ≤ 0.001, 1-way ANOVA. (D) Frequencies of light zone (LZ; CXCR4loCD86hi) and dark zone (DZ; CXCR4hiCD86lo) GCB cells and DZ/LZ ratio. Individual data points are plotted. Numbers below graphs and bars are median values for frequencies and geometric means for ratios. *P ≤ 0.05, **P ≤ 0.01, unpaired t test. (E) Cell numbers of CD138+B220lo plasma cells. Individual data points obtained in 6 or more independent experiments are plotted. Bars and numbers below graphs are median values. *P ≤ 0.05, **P ≤ 0.01, unpaired t test. (F and G) Representative flow cytometry plots (F) and pie charts (G) of intracellular Ig isotype staining in plasma cells. Displayed median percentages include data from 8–14 mice analyzed in 5 or more independent experiments. Significant differences with respect to the CD19CreI/+ control genotype are indicated by asterisks adjacent to the respective percentages in the RelTG CD19CreI/+ charts. *P ≤ 0.05, **P ≤ 0.01, ***P ≤ 0.001, ****P ≤ 0.0001, unpaired t test. BAC, bacterial artificial chromosome; HygroR, hygromycin B resistance; SPL, spleen; LN, lymph nodes; MLN, mesenteric lymph nodes; PP, Peyer’s patches; BM, bone marrow; ND, not determined. See Supplemental Figures 1–4.
Figure 2
Figure 2. c-Rel gain enhances immune responses upon immunization.
(A) CD95hiCD38lo GCB and CD138+B220lo plasma cell numbers 10–12 days after SRBC immunizations obtained from 4 independent experiments. Bars and numbers below graphs are medians. *P ≤ 0.05, ***P ≤ 0.001, paired t test. (B) Areas of splenic GCs quantified based on Bcl6 immunofluorescence in 5 CD19CreI/+ and 5 RelTG CD19CreI/+ mice 10 days after SRBC immunizations (CD19CreI/+, n = 61; RelTG CD19CreI/+, n = 53). Bars and numbers below graphs are means. **P ≤ 0.01, unpaired t test. (C) Percentages of Ig subtypes in splenic plasma cells obtained by intracellular flow cytometry 10–12 days after SRBC immunization. Displayed medians include data from 6 mice from 2 independent experiments. **P ≤ 0.01, paired t test. (D) Individual anti-SRBC IgG1 titers analyzed by flow cytometry 10 days after immunization of 2 independent experiments. Bars and numbers below graphs are medians. (E) NP-CG–immunized mice analyzed after 14 days: Individual percentages of CD95hiCD38lo GCB and IgG+NP+ GCB cells within all splenic B cells are plotted. Bars and numbers below graphs are medians. *P < 0.05, unpaired t test. (F and G) Specific IgG1 serum titers measured by ELISA and calculated by absorbance summation (61) following NP-CG immunizations. Titers for NP2 (high affinity) and NP23 (high and low affinity) (F) and the NP2/NP23 ratio (G) are displayed from 2 independent immunizations. *P ≤ 0.05, **P ≤ 0.01, ***P ≤ 0.001, multiple t tests. (H) Affinity maturation 14 days after NP-CG immunizations analyzed by sequencing of IgG1 VH186.2 rearrangements in GCB cells for 2 independently immunized cohorts with 2 mice per genotype: 4 CD19CreI/+ mice: immunization I, n = 126 sequences; immunization II, n = 148 sequences; 4 RelTG CD19CreI/+ mice: immunization I, n = 122 sequences; immunization II, n = 117 sequences. The percentage of sequences with the VH186.2 W33L mutation is shown. SPL, spleen; Imm, immunized; ND, not determined. See Supplemental Figures 5 and 6.
Figure 3
Figure 3. GFP–c-Rel transgene and c-Rel transgene overexpression limited to the GC stage and beyond phenocopy B cell–specific c-Rel overexpression.
(A) Representative flow cytometry plots of CD95hiCD38lo GCB cells and CD138+B220lo plasma cells in GFP-RelTG CD19CreI/+ and control mice. Displayed numbers are median percentages (n ≥ 6). (B) CD95hiCD38lo GCB cell numbers and CD138+B220lo plasma cell numbers. Individual data points obtained in 2 independent experiments are plotted. Bars and numbers below graphs are median values. *P ≤ 0.05, **P ≤ 0.01, unpaired t test. (CF) Representative flow cytometry plots and cell numbers of CD95hiCD38lo GCB cells (C and E) and CD138+B220lo plasma cells (D and F) in RelTG Cγ1CreI/+ and control mice. Displayed numbers in plots are median percentages (n ≥ 5). Individual data points obtained in 2 independent experiments are plotted in graphs. Bars and numbers below graphs are median values. *P ≤ 0.05, **P ≤ 0.01, ***P ≤ 0.001, unpaired t test. SPL, spleen; LN, lymph nodes; MLN, mesenteric lymph nodes; PP, Peyer’s patches. See Supplemental Figure 4F.
Figure 4
Figure 4. B cell–restricted c-Rel expression in c-Rel–knockout mice fully rescues GC reactions and class switching.
(A) Representative flow cytometry plots of GCB cells (B220+CD95hiCD38lo) and plasma cells (PC, B220loCD138+). Displayed numbers are median percentages (n = 5). (BD) GCB cell numbers (B); plasma cell numbers and percentages of IgG1-expressing plasma cells (C); and Tfh cell (TCRβ+CD4+CD8CXCR5hiPD-1hiICOShi) numbers (D). Individual data points obtained in 3 independent experiments are plotted. Bars and numbers below graphs are median values. *P ≤ 0.05, **P ≤ 0.01, Mann-Whitney test. SPL, spleen; PP, Peyer’s patches.
Figure 5
Figure 5. c-Rel protein level dynamics during terminal B cell differentiation.
(A and B) Intracellular flow cytometry data of c-Rel protein abundance. Representative flow cytometry histograms and relative median fluorescence intensities (MFIs) of intracellular c-Rel. Individual data points of 3 or more independent experiments are plotted. Bars and numbers below graphs are geometric means. The c-Rel protein fraction that is additionally present in c-Rel transgenic mice in comparison with respective control populations is highlighted in blue. (A) c-Rel levels in GCB cells (B220+/CD19+ CD95hiCD38lo) normalized to non-GCB (B, B220+/CD19+ CD38+CD95) of CD19CreI/+ controls. (B) c-Rel expression in plasma cells (PC, B220loCD138+) normalized to B cells (B, B220+CD138) of CD19CreI/+ controls. (C and D) Intracellular flow cytometry staining of FLAG. (C) Histograms with percentage of FLAG-positive cells of 2 representative RelTG CD19CreI/+ mice. Light blue, B cells (B220+CD38+CD95); dark blue, GCB cells (B220+CD95hiCD38lo); gray filled, B cells of CD19CreI/+ control. Gate for FLAG-positive B cell population is displayed. (D) Percentage of FLAG-positive subpopulations in B cells and GCB cells. Individual data points (n = 7) and bars representing median values are shown. SPL, spleen; LN, lymph nodes; MLN, mesenteric lymph nodes; PP, Peyer’s patches; BM, bone marrow. See Supplemental Figure 7A.
Figure 6
Figure 6. c-Rel protein nuclear translocation during terminal B cell differentiation.
(AD) Imaging flow cytometry analyses to assess c-Rel nuclear translocation in B cells (B220+CD38+CD95) and GCB cells (B220+CD95hiCD38lo) in LNs. Cells were stimulated with anti-CD40 for 60 minutes or left unstimulated in the presence of the pan-caspase inhibitor Q-VD-OPh to prolong survival of GCB cells. (A) Representative images of c-Rel nuclear translocation in unstimulated cells. Images were selected based on average nuclear localization score. Scale bars: 10 μm. (B) Quantified c-Rel nuclear translocation score in unstimulated or anti-CD40–stimulated B cells and GCB cells. Individual data points were pooled from 4 mice per genotype obtained in 3 independent experiments (pooled data points for CD19CreI/+: B unstimulated, n = 67,148; B stimulated, n = 75,884; GCB unstimulated, n = 1129; GCB stimulated, n = 1267; pooled data points for RelTG CD19CreI/+: B unstimulated, n = 80,494; B stimulated, n = 89,012; GCB unstimulated, n = 1861; GCB stimulated, n = 1951). Bars and numbers below graphs represent mean values calculated from the mean nuclear translocation scores for each mouse. (C) Histograms to visualize the frequency distribution of nuclear translocation scores for a representative mouse for each genotype. (D) Percentage of cells within the population of unstimulated B and GCB cells with a nuclear translocation score of 2.7 or more. Individual data points for 4 mice per genotype obtained in 3 independent experiments and bars representing mean values are shown. (E) c-Rel protein analyzed by capillary Western blot. Non-GCB (B) and GCB cells were FACS-sorted 7–9 days after SRBC immunization followed by nuclear fractionation. Each data point represents 1 sample of 1 × 10⁶ cells sorted from 2–3 mice. For quantification, c-Rel protein signals were normalized to PTEN (cytosol) or lamin B2 (nucleus). BF, bright field; Nuc, nucleus; Cyt, cytosol. See Supplemental Figure 7.
Figure 7
Figure 7. Immunofluorescence of c-Rel nuclear presence in B and GCB cells.
(A) Confocal immunofluorescence quantification of nuclear c-Rel intensities of B220+Bcl6 and B220+Bcl6+ cells for exemplary spleen sections from SRBC-immunized RelTG CD19CreI/+ and CD19CreI/+ mice is shown as scatter plots. Histograms depict median nuclear c-Rel intensities for all analyzed mice showing individual data points for each mouse. Green lines, bars, and numbers below graphs are median values (scale bars: 20 μm). *P ≤ 0.05, ****P ≤ 0.0001, unpaired t test. (B) 3D quantification of nuclear c-Rel in splenic B cell nuclei of an exemplary SRBC-immunized RelTG CD19CreI/+ mouse. Insert of a stained section (left; see Supplemental Figure 8C) shows cytoplasmic and nuclear c-Rel staining. Reconstructed surface objects (right) show abundant localization of c-Rel protein (green) in nuclei of Bcl6+ (red, n = 95) versus Bcl6 (white, n = 125) B cells. Graphs below show mean c-Rel 3D intensities in individual nuclei for the depicted insert (left) and for an entire spleen section (right) of B220+Bcl6 mantle zone cells (n = 5980) and B220+Bcl6+ cells (n = 1767); green lines and numbers below graphs depict median values (scale bars: 10 μm). ****P ≤ 0.0001, unpaired t test. (C) Nuclear c-Rel assessed by immunohistochemistry. Graphs display histogram of nuclear c-Rel intensities in B220+Bcl6 and B220+Bcl6+ cells in 3 RelTG CD19CreI/+ and 3 CD19CreI/+ mice (SRBC-immunized) and median nuclear c-Rel intensities for each mouse. Bars and numbers below bars are median values. Exemplary images are shown (scale bars: 50 μm). *P ≤ 0.05, ***P ≤ 0.001, unpaired t test. (D) Frequency distribution of nuclear c-Rel intensities and median nuclear c-Rel intensities in CD20+Bcl6 and CD20+Bcl6+ cells in tonsils of 3 human individuals assessed by immunohistochemistry. Exemplary images are shown (scale bar: 50 μm). **P ≤ 0.01, unpaired t test. See Supplemental Figures 8 and 9.
Figure 8
Figure 8. Strong enrichment of cell cycle and cell growth pathways in gene expression of c-Rel–overexpressing GCB cells.
(A) Common significantly differentially expressed genes (padj < 0.05) in GCB cells and plasma cells (PC) of RelTG CD19CreI/+ compared with control mice. Z-transformed expression values for each of 8 individual mice per genotype are shown in a heatmap representation. (B) Categories of significantly enriched gene sets in RelTG CD19CreI/+ GCB cell population evaluated by GSEA of C2: CP data set. (C) Enrichment plot of enriched gene sets in RelTG CD19CreI/+ GCB cell population with the highest normalized enrichment score among C2 gene sets containing the term MYC. (D) On the left x axis, log2 of transformed RNA expression values for Rel are plotted (gray bars). Individual data points are plotted. Bars and numbers below graphs are geometric means (n = 8). On the right x axis, geometric means of c-Rel protein levels are plotted (blue line) based on flow cytometry data presented in Figure 5A. FWER, family-wise error rate. See Supplemental Figure 10 and Supplemental Information.
Figure 9
Figure 9. c-Rel protein abundance dose-dependently increases GCB cell and plasma cell numbers.
(A) Individual data points for percentages of cells in G1 and the sum of cells in G2/M and S phase obtained in 3 independent experiments are plotted. Bars represent mean values. *P ≤ 0.05, ***P ≤ 0.001, unpaired t test. (B) Assessment of apoptosis in GCB cells of mice immunized with SRBCs 12 days before analysis. Individual data points of all viable and the sum of all nonviable splenic GCB cells obtained in 2 independent experiments are plotted. Bars represent median values. Viable: caspase (C), annexin V (AV), 7-AAD; early apoptotic: C+AV/CAV+/C+AV+, 7-AAD; late apoptotic: C+AV/CAV+/C+AV+, 7-AAD+; non-apoptotic dead: C, AV, 7-AAD+; GCB cells: CD19+B220+CD95hiCD38lo. (C) Correlation of c-Rel protein abundance with cellular expansion. Spearman’s correlation coefficient (rS) and P values are given. c-Rel protein levels are normalized to non-GC or non-PC B cells of CD19CreI/+ mice. GCB cells (CD19+/B220+ CD95hiCD38lo): spleen, n = 140; plasma cells (B220loCD138+): spleen, n = 100. SPL, spleen; LN, lymph nodes. See Supplemental Figure 11, A–C.
Figure 10
Figure 10. c-Rel gain induces autoimmunity in mice.
(A) ANA and anti-cardiolipin autoantibody serum titers of 8- to 13-week-old mice determined by ELISA. Individual data points are plotted (n = 7). Bars and numbers below graphs are median values. *P ≤ 0.05, Mann-Whitney test. (B and C) ELISA for Ig subtypes (B) and autoantibodies (C) in serum of 58- to 82-week-old mice. Individual data points are plotted. Bars and numbers below graphs are median values (CD19CreI/+: median age 522 days, n = 20; RelTG CD19CreI/+: median age 511 days, n = 11–12). *P ≤ 0.05, ***P ≤ 0.001, ****P ≤ 0.0001, Mann-Whitney test. (D) IgG kidney histology. Kidney sections from mice aged 58–81 weeks (CD19CreI/+: median age 522 days, n = 19; RelTG CD19CreI/+: median age 513 days, n = 10) were stained with anti-mouse IgG to detect IgG deposits. For each mouse, 30 images were scored from 0 to 3 according to strength of positive IgG staining. The mean score for each mouse is shown as individual data points. Bars and numbers below bars are median values (scale bars: 50 μm). **P ≤ 0.01, Mann-Whitney test. ANA, anti-nuclear antibodies; RF, rheumatoid factor. See Supplemental Figure 11, D–F.

References

    1. Gregersen PK, et al. REL, encoding a member of the NF-kappaB family of transcription factors, is a newly defined risk locus for rheumatoid arthritis. Nat Genet. 2009;41(7):820–823. doi: 10.1038/ng.395. - DOI - PMC - PubMed
    1. Eyre S, et al. Confirmation of association of the REL locus with rheumatoid arthritis susceptibility in the UK population. Ann Rheum Dis. 2010;69(8):1572–1573. doi: 10.1136/ard.2009.122887. - DOI - PMC - PubMed
    1. Genetic Analysis of Psoriasis Consortium the Wellcome Trust Case Control Consortium 2. et al. A genome-wide association study identifies new psoriasis susceptibility loci and an interaction between HLA-C and ERAP1. Nat Genet. 2010;42(11):985–990. doi: 10.1038/ng.694. - DOI - PMC - PubMed
    1. McGovern DP, et al. Genome-wide association identifies multiple ulcerative colitis susceptibility loci. Nat Genet. 2010;42(4):332–337. doi: 10.1038/ng.549. - DOI - PMC - PubMed
    1. Trynka G, et al. Coeliac disease-associated risk variants in TNFAIP3 and REL implicate altered NF-κB signalling. Gut. 2009;58(8):1078–1083. doi: 10.1136/gut.2008.169052. - DOI - PubMed

Publication types

Substances