. 2020 Mar 19;16(3):e1007732.
doi: 10.1371/journal.pcbi.1007732. eCollection 2020 Mar.

PPanGGOLiN: Depicting microbial diversity via a partitioned pangenome graph

Affiliations

PPanGGOLiN: Depicting microbial diversity via a partitioned pangenome graph

Guillaume Gautreau et al. PLoS Comput Biol. .

Erratum in

Abstract

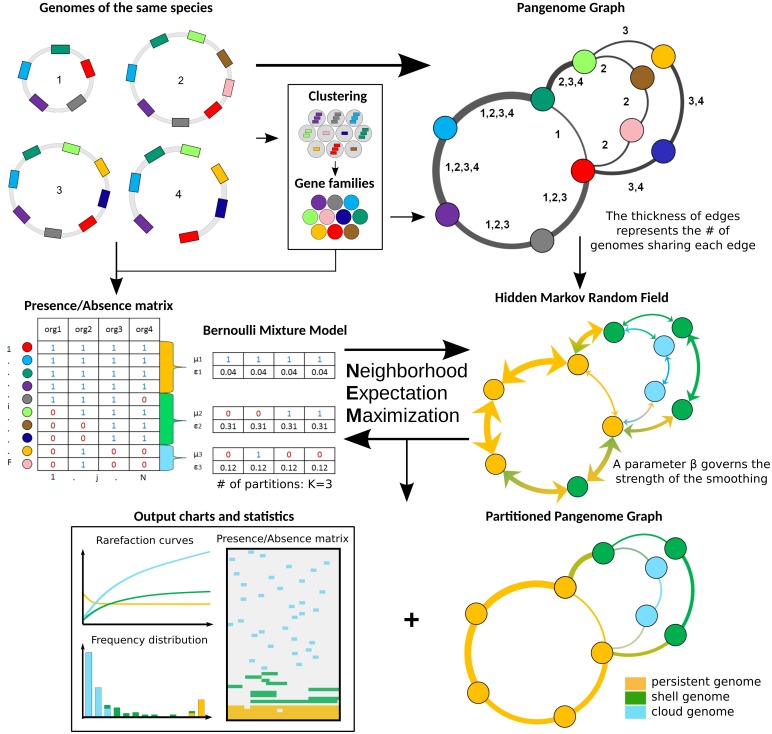
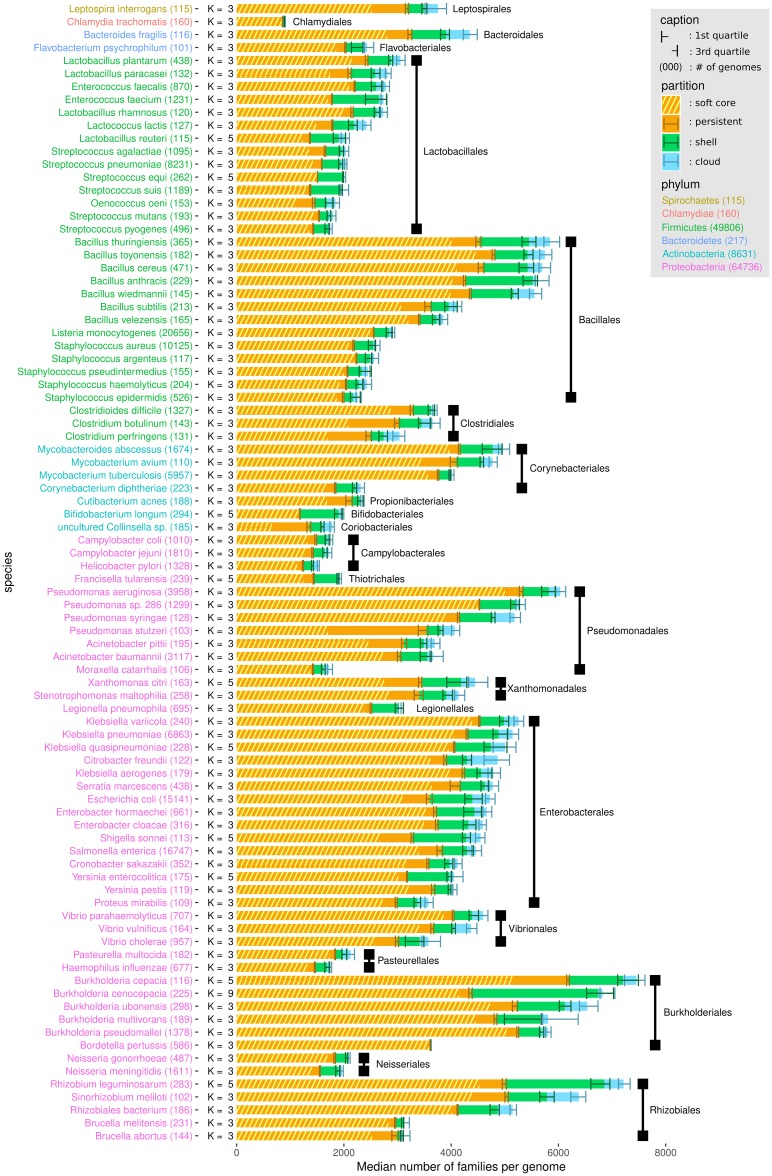
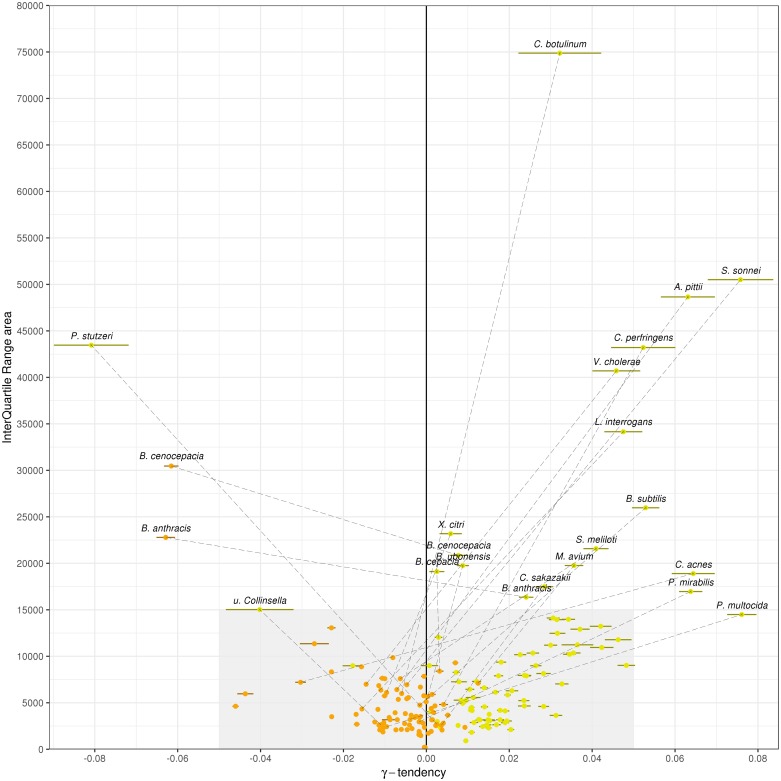
The use of comparative genomics for functional, evolutionary, and epidemiological studies requires methods to classify gene families in terms of occurrence in a given species. These methods usually lack multivariate statistical models to infer the partitions and the optimal number of classes and don't account for genome organization. We introduce a graph structure to model pangenomes in which nodes represent gene families and edges represent genomic neighborhood. Our method, named PPanGGOLiN, partitions nodes using an Expectation-Maximization algorithm based on multivariate Bernoulli Mixture Model coupled with a Markov Random Field. This approach takes into account the topology of the graph and the presence/absence of genes in pangenomes to classify gene families into persistent, cloud, and one or several shell partitions. By analyzing the partitioned pangenome graphs of isolate genomes from 439 species and metagenome-assembled genomes from 78 species, we demonstrate that our method is effective in estimating the persistent genome. Interestingly, it shows that the shell genome is a key element to understand genome dynamics, presumably because it reflects how genes present at intermediate frequencies drive adaptation of species, and its proportion in genomes is independent of genome size. The graph-based approach proposed by PPanGGOLiN is useful to depict the overall genomic diversity of thousands of strains in a compact structure and provides an effective basis for very large scale comparative genomics. The software is freely available at https://github.com/labgem/PPanGGOLiN.


Conflict of interest statement

The authors have declared that no competing interests exist.

Figures

Fig 1
Fig 1. Flowchart of PPanGGOLiN on a toy example of 4 genomes.
The method requires annotated genomes of the same species with their genes clustered into homologous gene families. Annotations and gene families can be predicted by PPanGGOLiN or directly provided by the user. Based on these inputs, a pangenome graph is built by merging homologous genes and their genomic links. Nodes represent gene families and edges represent genomic neighborhood. The edges are labeled by identifiers of genomes sharing the same gene neighborhood. In parallel, gene families are encoded as a presence/absence matrix that indicates for each family whether or not it is present in the genomes. The pangenome is then divided into K partitions (K = 3 in this example) by estimating the best partitioning parameters through an Expectation-Maximization algorithm. The method involves the maximization of the likelihood of a multivariate Bernoulli Mixture Model taking into account the constraint of a Markov Random Field (MRF). The MRF network is given by the pangenome graph and it favors two neighbors to be more likely classified in the same partition. At the end of this iterative process, PPanGGOLiN returns a partitioned pangenome graph where persistent, shell and cloud partitions are overlaid on the neighborhood graph. In addition, many tables, charts and statistics are provided by the software. The number of partitions (K) can either be provided by the user or determined by the algorithm.
Fig 2
Fig 2. Partitioned pangenome graph of 3 117 Acinetobacter baumannii genomes.
This partitioned pangenome graph of PPanGGOLiN displays the overall genomic diversity of 3 117 Acinetobacter baumannii strains from GenBank. Edges correspond to genomic colocalization and nodes correspond to gene families. The thickness of the edges is proportional to the number of genomes sharing that link. The size of the nodes is proportional to the total number of genes in each family. The edges between persistent, shell and cloud nodes are colored in orange, green and blue, respectively. Nodes are colored in the same way. The edges between gene families belonging to different partitions are shown in mixed colors. For visualization purposes, gene families with less than 20 genes are not shown on this figure although they comprise 84.68% of the nodes (families mostly composed of a single gene). The frame in the upper left corner shows a zoom on a branching region where multiple alternative shell and cloud paths are present in the species. This region is involved in the synthesis of the major polysaccharide antigen of A. baumannii. The two most frequent paths (Sv12/PSgc12 and Sv9/PSgc9) are highlighted in khaki and fluo green. The Gephi software (https://gephi.org) [32] with the ForceAtlas2 algorithm [33] was used to compute the graph layout with the following parameters: Scaling = 8000, Stronger Gravity = True, Gravity = 4.0, Edge Weight influence = 1.3.
Fig 3
Fig 3. Distribution of PPanGGOLiN partitions in the genomes of the most represented species in GenBank.
Each horizontal bar shows the median number of gene families per genome among the different PPanGGOLiN partitions (persistent, shell and cloud) in the 88 most represented species in GenBank (having at least 100 genomes). The error bars represent the interquartile ranges. Hatched areas on the persistent genome bars show the median number of gene families for the soft core (⩾95% of presence). The species names are colored according to their phylum and sorted by taxonomic order and then by decreasing cumulative bar size. Next to the species names, the number of genomes is indicated in brackets and the number of partitions (K) that was automatically determined by PPanGGOLiN is also shown.
Fig 4
Fig 4. γ-tendencies and IQR areas of the persistent and the soft core rarefaction curves.
Each of the 88 most abundant species in GenBank are represented by two points: orange points correspond to the PPanGGOLiN persistent values and yellow points to the ones of the soft core (⩾95% of presence). A dashed line connects the 2 points if either the soft core or the persistent values are not in the range of the grey area (−0.05 ⩽ γ ⩽ 0.05 and 0 ⩽ IQRarea ⩽ 15000). The colored horizontal bars show the standard errors of the fitting of rarefaction curves via the Heaps’ law.
Fig 5
Fig 5. Fraction of the variable (shell + cloud) families per genome compared to the number of gene families.
The results for the 88 most abundant species in GenBank are represented. The error bars show the interquartile ranges of the two variables. The points are colored by phylum and their size corresponds to the number of partitions (K) used.
Fig 6
Fig 6. Spearman’s ρ correlation coefficients between the shell genome presence/absence patterns and the MASH genomic distances compared with the shell fraction per genome.
The results for the 88 most abundant species in GenBank are represented. The error bars show the interquartile ranges of the shell fraction. The points are colored by phylum and their size corresponds to the number of partitions (K) used.
Fig 7
Fig 7. Illustration of the persistent genome overlaps between GenBank genomes and MAGs.
Results for 78 species are represented. The colors of the hemispheres provide the percentage of common persistent gene families among the total persistent of MAGs (left hemisphere) or GenBank genomes (right hemisphere). The solid, dashed and dotted lines indicate the identity, a fold change of 1.1 and a fold change of 1.2 between the persistent genome sizes.

References

    1. Tettelin H, Masignani V, Cieslewicz MJ, Donati C, Medini D, Ward NL, et al. Genome analysis of multiple pathogenic isolates of Streptococcus agalactiae: implications for the microbial “pan-genome”. Proc Natl Acad Sci USA. 2005;102(39):13950–13955. 10.1073/pnas.0506758102 - DOI - PMC - PubMed
    1. Medini D, Donati C, Tettelin H, Masignani V, Rappuoli R. The microbial pan-genome. Curr Opin Genet Dev. 2005;15(6):589–594. 10.1016/j.gde.2005.09.006 - DOI - PubMed
    1. Treangen TJ, Rocha EPC. Horizontal Transfer, Not Duplication, Drives the Expansion of Protein Families in Prokaryotes. PLOS Genetics. 2011;7(1):1–12. 10.1371/journal.pgen.1001284 - DOI - PMC - PubMed
    1. Lukjancenko O, Wassenaar TM, Ussery DW. Comparison of 61 sequenced Escherichia coli genomes. Microb Ecol. 2010;60(4):708–720. 10.1007/s00248-010-9717-3 - DOI - PMC - PubMed
    1. Acevedo-Rocha CG, Fang G, Schmidt M, Ussery DW, Danchin A. From essential to persistent genes: a functional approach to constructing synthetic life. Trends Genet. 2013;29(5):273–279. 10.1016/j.tig.2012.11.001 - DOI - PMC - PubMed

Publication types