. 2020 Mar 19;15(3):e0226584.
doi: 10.1371/journal.pone.0226584. eCollection 2020.

Prolonged inflammation leads to ongoing damage after spinal cord injury

Affiliations

Prolonged inflammation leads to ongoing damage after spinal cord injury

Jacek M Kwiecien et al. PLoS One. .

Abstract

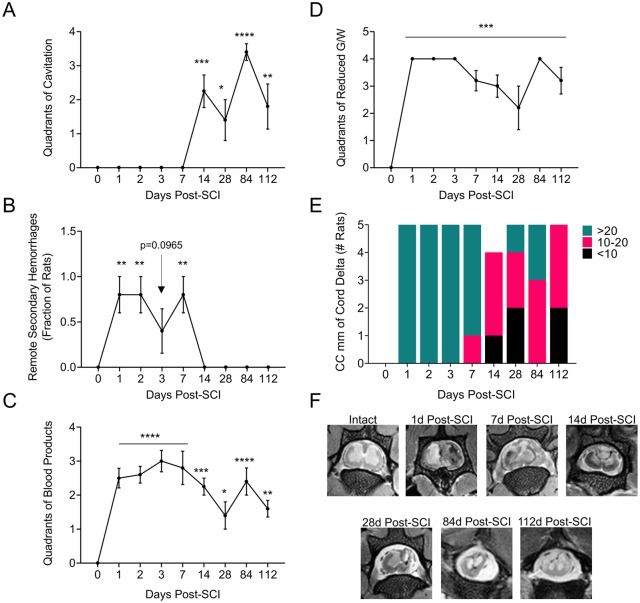
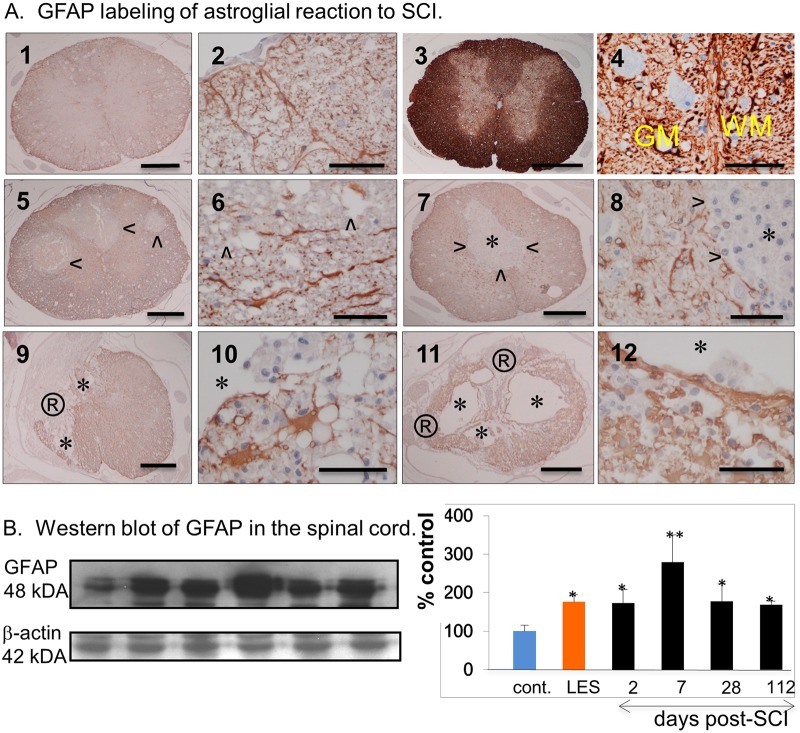
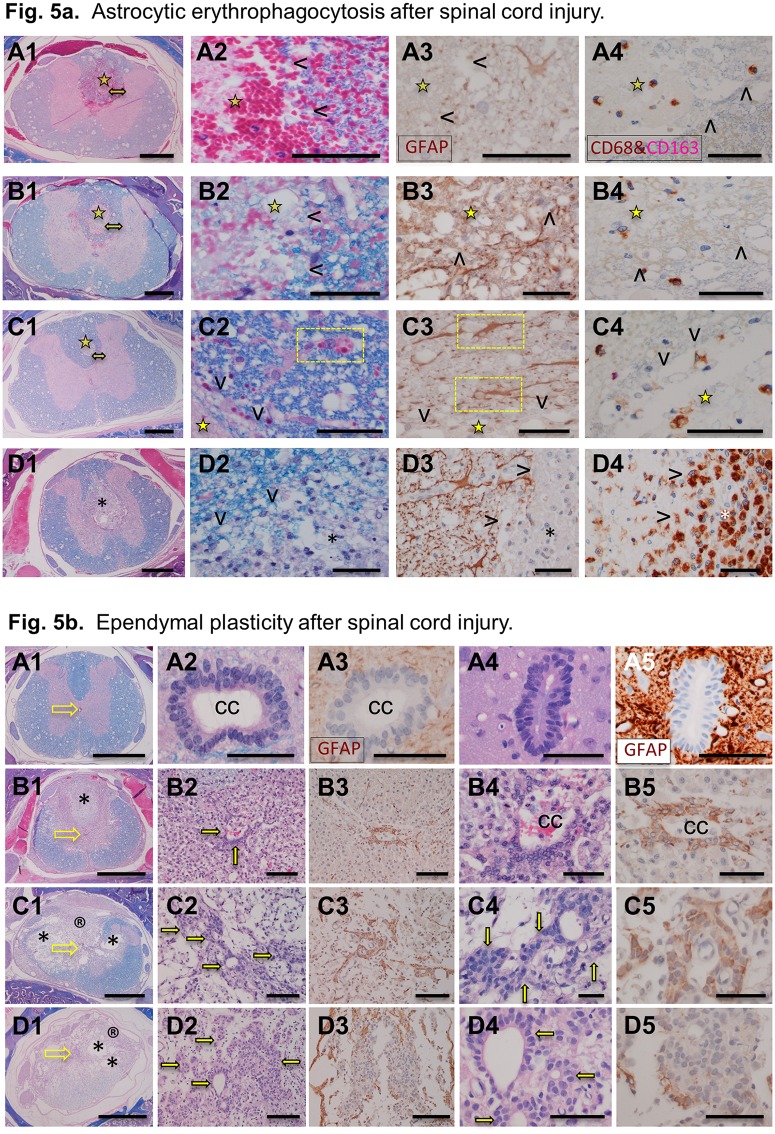
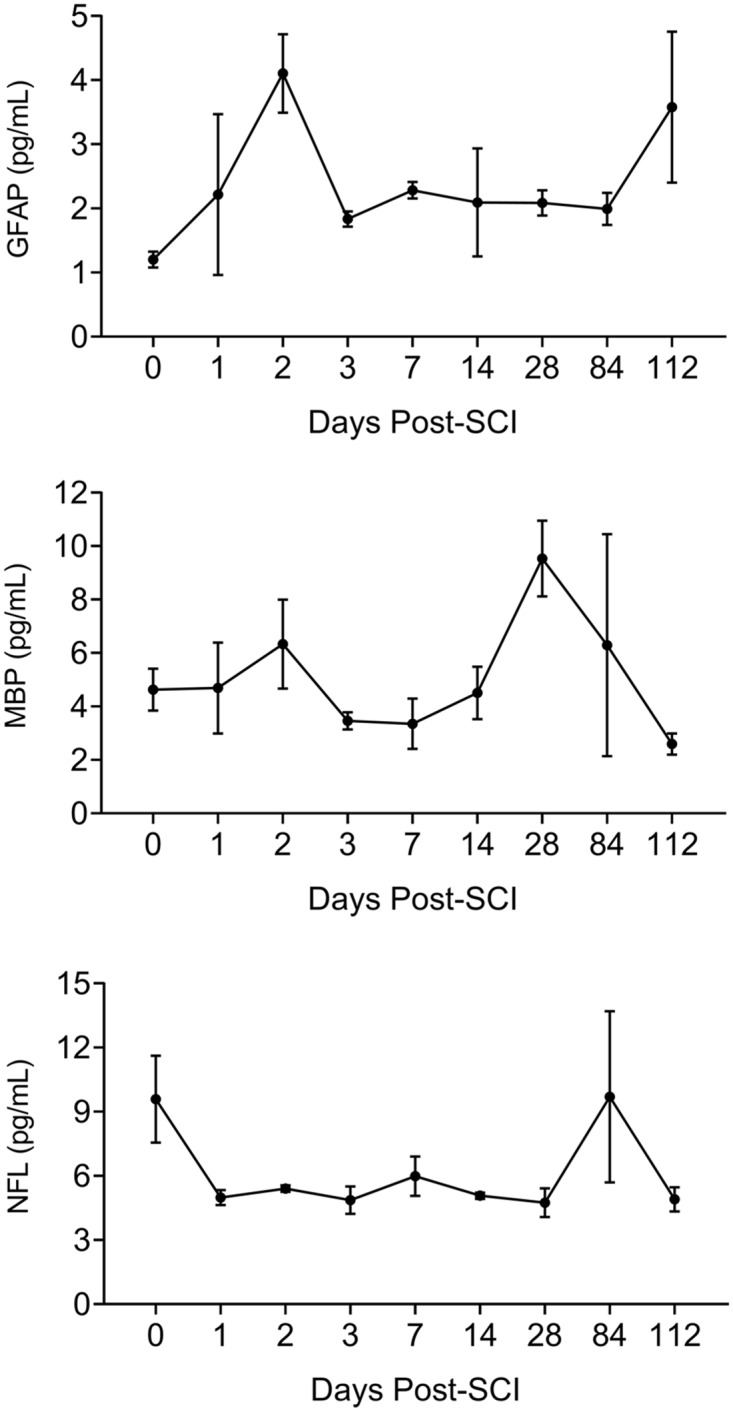
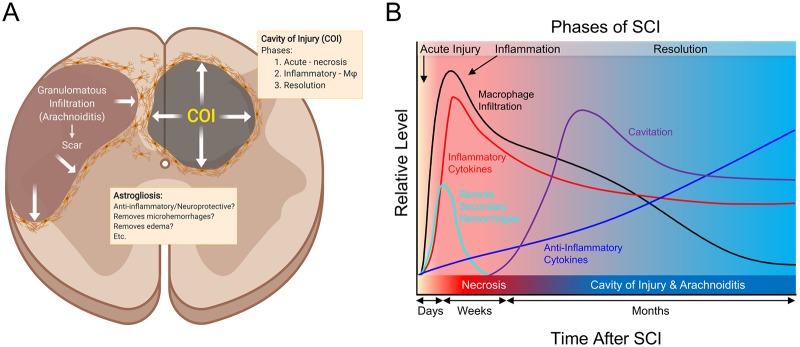
The pathogenesis of spinal cord injury (SCI) remains poorly understood and treatment remains limited. Emerging evidence indicates that post-SCI inflammation is severe but the role of reactive astrogliosis not well understood given its implication in ongoing inflammation as damaging or neuroprotective. We have completed an extensive systematic study with MRI, histopathology, proteomics and ELISA analyses designed to further define the severe protracted and damaging inflammation after SCI in a rat model. We have identified 3 distinct phases of SCI: acute (first 2 days), inflammatory (starting day 3) and resolution (>3 months) in 16 weeks follow up. Actively phagocytizing, CD68+/CD163- macrophages infiltrate myelin-rich necrotic areas converting them into cavities of injury (COI) when deep in the spinal cord. Alternatively, superficial SCI areas are infiltrated by granulomatous tissue, or arachnoiditis where glial cells are obliterated. In the COI, CD68+/CD163- macrophage numbers reach a maximum in the first 4 weeks and then decline. Myelin phagocytosis is present at 16 weeks indicating ongoing inflammatory damage. The COI and arachnoiditis are defined by a wall of progressively hypertrophied astrocytes. MR imaging indicates persistent spinal cord edema that is linked to the severity of inflammation. Microhemorrhages in the spinal cord around the lesion are eliminated, presumably by reactive astrocytes within the first week post-injury. Acutely increased levels of TNF-alpha, IL-1beta, IFN-gamma and other pro-inflammatory cytokines, chemokines and proteases decrease and anti-inflammatory cytokines increase in later phases. In this study we elucidated a number of fundamental mechanisms in pathogenesis of SCI and have demonstrated a close association between progressive astrogliosis and reduction in the severity of inflammation.


Conflict of interest statement

The authors have declared that no competing interests exist.

Figures

Fig 1
Fig 1. MRI analysis demonstrating disease progression.
Cross sectional images recorded from spines, perfusion fixed in situ after euthanasia at each follow up time and analyzed blinded. A. Number of quadrants of cord with evidence of cavitation. 0 = none vs. 1–4 quadrants. B. Presence or absence of abnormality in a remote portion of cord, numbers of rats with evidence of remote damage. C. Number of cord quadrants with evidence of blood product. 0 = none vs. 1–4 quadrants. D. Number of cord quadrants with loss of grey/white contrast. 0 = none vs. 1–4 quadrants. E. Longitudinal extent of cord involvement (measured across multiple cord cross sectional images described a s length. 0 = none, 1-10mm, 11-20mm, >20mm. F. MRI images–cross sections taken at days 0, -r90r to injury, and 1, 2, 7, 14, 28, 84 and 112 days post balloon crush SCI. Measured changes demonstrate statistically significant changes in cord damage. ANOVA analysis *P < .05, **P < 0.01, ***P < 0.001, ****P < 0.0001.
Fig 2
Fig 2
A. Spinal cord injury resolving in the cavity of injury. The T2-weighed MRI of the spinal cord injury (SCI, column 1) with histology of a low magnification (2x, column 2), and high magnification (60x, column 3), with dual anti-CD68 (brown color) and anti-CD163 (red magenta color) antibody staining immunohistochemistry (column 4) of the site of injury in rats at 1 day (A), 3 days (B), 7 days (C), 28 days (D), and 112 days (E, F) post-SCI. The arrowheads indicate the cavity of injury which is also indicated by an asterix in E2. MRI and histology demonstrate acute intermediate and chronic phases of damage after SCI. Figures A1-E1, column 1 compares MRI to low power histology images B2-E2 column 2 at each follow up time, 1, 3, 7, 28 and 112days post SCI. Column 3 A3 to E3 demonstrates inflammatory cell invasion defined by luxol fast blue staining, yellow arrows indicate macrophages with internalized myelin. Column 4 A4 to E4 illustrate M1 macrophage invasion at each follow up time. Size bars: A– 2 mm; B– 1 mm, C– 100 microns, D, E– 50 microns. B. Macrophage counts in the cavity of injury along 3 phases of initiated by the spinal cord injury. One Way ANOVA with Tukey’s post-hoc compared against Day 1 post-SCI.
Fig 3
Fig 3
A. Spinal cord injury resolving in arachnoiditis. The columns 1 and 2 show large areas of obliteration of the spinal cord by arachnoiditis (arrowheads). Yellow arrows in column 1 indicate an area magnified in column 2. The asterix in B1, C1 indicates the cavity of injury (COI). The arrowheads in columns 3 and 4 indicate the margin between arachnoiditis and the spinal cord pointing towards arachnoiditis. The yellow box in A4 indicates astrocytic processes protruding into the area of arachnoiditis likely to be obliterated by severe infiltration by CD68+/CD163- macrophages (see A3). Luxol fast blue counterstained with hematoxylin and eosin (LFB+H&E); A1, A2, B1, B2, C1, C2. Dual immunohistochemical stain with antibodies against CD68 (brown) and against CD163 (magenta); A3, B3, C3. Anti-GFAP antibody stain; A4, B4, C4. Size bars: A1, B1, C1–1,000 microns, A2-A4, B2-B4, C2-C4–50 microns. B. Bone marrow following the SCI. Dual anti-CD68 (brown color) and anti-CD163 (magenta color) labelling of cells of monocytic lineage in the vertebral bone marrow in the intact rat and in injured rats for up to 84 days post-SCI. At the day 7 post-SCI there is a remarkable hyperplasia of CD68+ cells. Size bars; 50 microns.
Fig 4
Fig 4. Astrogliosis in the SCI.
A. Anti-GFAP antibody labeling of intact LE rat (1,2), intact LES rat (3,4) and post-SCI rat spinal cord at 2 (5,6), 7 (7,8), 28 (9,10) and 112 days (11,12). Arrowheads indicate the areas of injury that are GFAP-, asterix indicates a COI, ®indicates an area of arachnoiditis. Yellow lettering in (4) indicates gray matter (GM) and white matter (WM). Size bars; 1,000 microns -1, 3, 5, 7, 9, 11; 50 microns– 2, 4, 6, 8, 10, 12. B. Western blot of GFAP in the spinal cord. The Western blots from the protein extracted from the spinal cord of intact LE-cont. rats, intact LES rats and of injured rats at 2, 7, 28 and 112 days post-SCI are shown on the left and the densimetry results expressed as the percent of the negative control or intact LE-control rat.
Fig 5
Fig 5
A. Astrocytic erythrophagocytosis following the SCI. Columns 1 and 2 present histology at 1, 2, 3 and 7 days post-SCI (A-D respectively). The column 3 have sections labelled with anti-GFAP antibody and column 4 labelled with anti-CD68 (brown) and anti-CD163 (red magenta) antibodies. The arrowheads (columns 2–4) indicate the area of necrosis and the asterix (row D) indicates the COI infiltrated by macrophages. The yellow star indicates the area of necrosis and double headed yellow arrow in column 1 indicates peri-lesional area magnified in column 2. The yellow boxes indicate internalization of red blood cells by astrocytes. Size bars; 1,000 microns in the column 1; 50 microns in the column 2–4. B. Ependymal cell plasticity after spinal cord injury. Histology of ependymal cells of the central canal (cc) in intact LE (A1-3), intact LES (A4,5) and in the spinal cord of LE rat at 7 (row B), 14, (row C) and 112 days (row D) post-SCI. Sections in the columns 1, 2, 4 are stained with luxol fast blue and counterstained with haematoxylin and eosin (LFB+H&E). Columns 3 and 5 are stained for GFAP. In the column 1, yellow empty arrows indicate the location of the central canal. The solid yellow arrows indicate clusters of epithelial cells interpreted as ependymal cells. Size bars: column 1–1,000 microns; columns 2, 3–100 microns; columns 4, 5–50 microns.
Fig 6
Fig 6. Dynamic changes in levels of 34 factors in the spinal cord following the SCI.
The levels of factors are expressed as the percent of intact negative control, LE-cont. rat = 100%. The values obtained from the intact LES rat serving as the positive control are shown in the vicinity of the results from the rats sampled at 112 days post-SCI in the box. Levels of each of 34 factors were compared between 2 and 7 days, 2 and 28 and 2 and 112 days post-SCI, analyzed by 2-way ANOVA and p values presented in the adjacent table.
Fig 7
Fig 7. Biomarkers of spinal cord damage in the serum post-SCI.
Serum levels of markers of damage of astrocytes (GFAP), of myelin (MBP and of neurons (NF-L) are not consistent with the progression of the severity of destructive inflammation in the SCI.
Fig 8
Fig 8. Mechanisms involved in spinal cord injury.
Spinal cord injury results in massive necrosis and hemorrhage where all cellular and vascular components of the tissue are destroyed. Areas of necrosis deep in the spinal cord and surrounded by the surviving spinal cord tissue become converted into the cavity of injury (COI) where inflammation is localized and fluid accumulates. The COI apparently expands during the long Inflammatory Phase and is surrounded and thus limited by gradually growing in the density wall of reactive astrogliosis while the severity of macrophage infiltration declines in the Resolution Phase. Areas of necrosis on the surface of the spinal cord are infiltrated by inflammatory granulomatous cells including macrophages, fibroblasts and capillary blood vessels from the subarachnoid space thus the name arachnoiditis. It appears to expand against the spinal cord tissue which recedes and forms a wall of gradually more intense astrogliosis. Over the time the area of arachnoiditis is fibrosed and becomes a typical scar devoid of glial cells therefore it is not a “glial scar” but rather a scar surrounded by astroglial reaction.

References

    1. Beck KD, Nguyen HX, Galvan MD, Salazar DL, Woodruff TM, Anderson AJ. Quantitative analysis of cellular inflammation after traumatic spinal cord injury: evidence for a multiphasic inflammatory response in the acute to chronic environment. Brain 2010; 133: 433–447. 10.1093/brain/awp322 - DOI - PMC - PubMed
    1. Evaniew N, Noonan VK, Fallah N, Kwon BK, Rivers CS, Ahn H, et al. Methylprednisolone for the treatment of patients with acute spinal cord injuries: A propensity score-matched cohort study from a Canadian multi-center spinal cord injury registry. J Neurotrauma 32; 2015: 1674–1683. 10.1089/neu.2015.3963 - DOI - PMC - PubMed
    1. Sofroniew MV. (2009). Molecular dissection of reactive astrogliosis and glial scar formation. Trends Neurosci. 2009; 32: 638–647. 10.1016/j.tins.2009.08.002 - DOI - PMC - PubMed
    1. Karimi-Abdolrezaee S, Billakanti R. (2012). Reactive astrogliosis after spinal cord injury-beneficial and detrimental effects. Mol Neurobiol. 2012; 46: 251–264. 10.1007/s12035-012-8287-4 - DOI - PubMed
    1. Oakden W, Kwiecien JM, O’Reilly MA, Lake E, Akens MK, Aubert I, et al. A non-invasive model of cervical spinal cord injury induced with focused ultrasound. J Neurosci Meth. 2014; 235: 92–100. - PubMed

Publication types

MeSH terms