. 2020 Apr 30;43(4):373-383.
doi: 10.14348/molcells.2020.2198.

FADD Phosphorylation Modulates Blood Glucose Levels by Decreasing the Expression of Insulin-Degrading Enzyme

Affiliations

FADD Phosphorylation Modulates Blood Glucose Levels by Decreasing the Expression of Insulin-Degrading Enzyme

Yan Lin et al. Mol Cells. .

Abstract

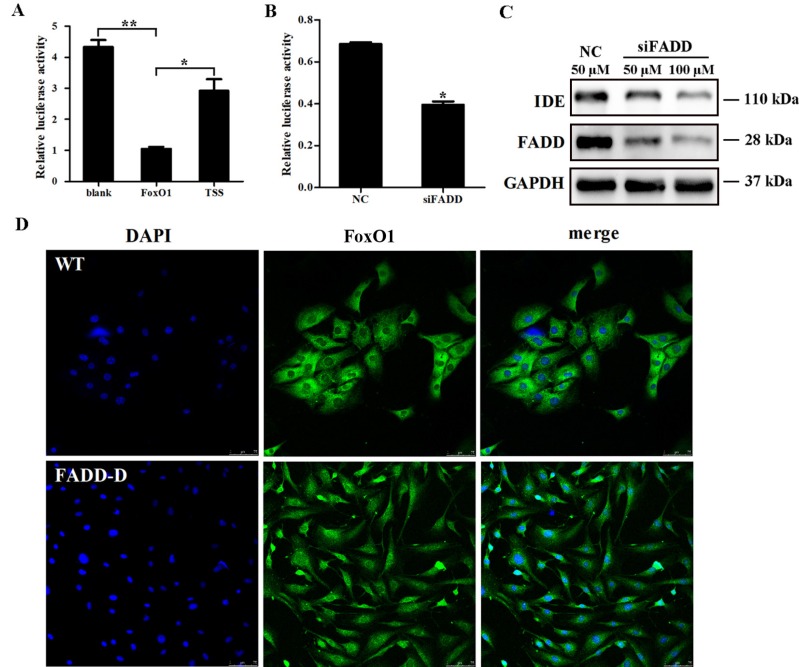
Our previous study revealed a novel role of Fas-associated death domain-containing protein (FADD) in islet development and insulin secretion. Insulin-degrading enzyme (IDE) is a zinc metalloprotease that selectively degrades biologically important substrates associated with type 2 diabetes (T2DM). The current study was designed to investigate the effect of FADD phosphorylation on IDE. We found that the mRNA and protein levels of IDE were significantly downregulated in FADD-D mouse livers compared with control mice. Quantitative real-time polymerase chain reaction analysis showed that FADD regulates the expression of IDE at the transcriptional level without affecting the stability of the mRNA in HepG2 cells. Following treatment with cycloheximide, the IDE protein degradation rate was found to be increased in both FADD-D primary hepatocytes and FADD-knockdown HepG2 cells. Additionally, IDE expression levels were reduced in insulin-stimulated primary hepatocytes from FADD-D mice compared to those from control mice. Moreover, FADD phosphorylation promotes nuclear translocation of FoxO1, thus inhibiting the transcriptional activity of the IDE promoter. Together, these findings imply a novel role of FADD in the reduction of protein stability and expression levels of IDE.

Keywords: FADD phosphorylation; FoxO1; insulin; insulin-degrading enzyme; protein stability.


Conflict of interest statement

CONFLICT OF INTEREST

The authors have no potential conflicts of interest to disclose.

Figures

Fig. 1
Fig. 1. Genotyping results for FADD-D and WT mice.
Lanes 1-3: FADD-D mice. The FADD-TgD gene and FADD-Neo gene were amplified, and the FADD-Endo gene was not amplified. Lanes 4-6: WT mice. Only the FADD-Endo gene was amplified. M: marker 2000 bp.
Fig. 2
Fig. 2. Identification of the primary hepatocytes.
(A) The morphology of the control and FADD-D primary hepatocytes. Scale bars = 75 µm. (B) PAS staining of primary hepatocytes extracted from the control and FADD-D mice. Scale bars = 50 µm. (C) CK-18 immunofluorescence assay for primary hepatocytes extracted from control and FADD-D mice. Scale bars = 75 µm.
Fig. 3
Fig. 3. Reduced mRNA and protein expression levels of IDE in FADD-D liver and primary hepatocytes.
(A) The mRNA expression level of IDE in livers. (B) The protein expression level of IDE in livers. (C) The expression level of IDE in livers detected by immunohistochemistry analysis. Scale bars = 75 µm. (D) The mRNA expression level of IDE in primary hepatocytes. (E) The protein expression level of IDE in primary hepatocytes. (F) The expression level of IDE in primary hepatocytes detected by immunohistochemistry analysis. Scale bars = 50 µm. Data are represented as mean ± SD, *P < 0.05 compared with the respective control.
Fig. 4
Fig. 4. Reduced IDE expression level in FADD-knockdown HepG2 cells.
The mRNA levels of (A) FADD and (B) IDE and (C) the protein expression level of IDE in HepG2 cells transfected with FADD interference fragments. (D) HepG2 cells were transfected with the NC/siFADD fragment and then treated with 5 μg/ml Act D for 0, 2, 4, and 8 h to detect the degradation rate of IDE mRNA. Data are represented as mean ± SD, *P < 0.05 compared with the respective control.
Fig. 5
Fig. 5. The effect of FADD phosphorylation or knockdown on IDE protein stability.
(A) Western blotting analysis of IDE in primary hepatocytes from control and FADD-D mice upon CHX (20 µg/ml) treatment for 0, 2, 4, and 8 h. (B) The rate of IDE degradation. (C) Western blotting analysis of IDE in HEK293T cells transfected with siFADD or NC in response to CHX treatment at the indicated concentrations for 24 h. (D) The rate of IDE degradation. (E) Primary hepatocytes extracted from control and FADD-D mice were treated with insulin at different concentrations (0, 100, 200, and 400 nM) for 12 h, and then the protein level of IDE was examined by WB analysis.
Fig. 6
Fig. 6. FoxO1 inhibited the luciferase activity of the IDE promoter.
(A) Plasmids (pEGFP-N1, pEGFP-N1-FoxO1, and pEGFP-N1-TSS) were transfected into HEK293T cells, and the luciferase activity of the IDE promoter was detected 24 h after transfection. Data are represented as the fold change of luciferase activity of the pGL3 basic vector. (B) HEK293T cells were transfected with siFADD or NC fragment, and then the luciferase activity of the IDE promoter was detected. (C) HEK293T cells were transfected with siFADD or NC fragment, and then the protein level of IDE was detected. (D) The immunofluorescence results of FoxO1 in primary hepatocytes extracted from control and FADD-D mice. FoxO1 (green), DAPI (blue) staining (3 mice per group); scale bars = 75 µm. Data are represented as mean ± SD. *P < 0.05, **P < 0.01 compared with the respective control.
Fig. 7
Fig. 7. Sirt1 regulates the expre­ssion level of IDE.
(A) Western blotting analysis of IDE in HepG2 cells treated with PBS, Sirt1 inhibitor EX527 (1:1,000, 1:500) or activator Sirt1720 (1:1,000, 1:500). (B) The expression level of Sirt1 in HepG2 cells transfected with siFADD. (C) Schematic illustration of the potential mecha­nisms by which FADD affects the expression level of IDE.

References

    1. Abdul-Hay S.O., Kang D., McBride M., Li L., Zhao J., Leissring M.A. Deletion of insulin-degrading enzyme elicits antipodal, age-dependent effects on glucose and insulin tolerance. PLoS One. 2011;6:e20818. doi: 10.1371/journal.pone.0020818. - DOI - PMC - PubMed
    1. Bojsen-Moller K.N., Lundsgaard A.M., Madsbad S., Kiens B., Holst J.J. Hepatic insulin clearance in regulation of systemic insulin concentrations-role of carbohydrate and energy availability. Diabetes. 2018;67:2129–2136. doi: 10.2337/db18-0539. - DOI - PubMed
    1. Bonnefond A., Froguel P., Vaxillaire M. The emerging genetics of type 2 diabetes. Trends Mol. Med. 2010;16:407–416. doi: 10.1016/j.molmed.2010.06.004. - DOI - PubMed
    1. Bonnet M.C., Preukschat D., Welz P.S., van Loo G., Ermolaeva M.A., Bloch W., Haase I., Pasparakis M. The adaptor protein FADD protects epidermal keratinocytes from necroptosis in vivo and prevents skin inflammation. Immunity. 2011;35:572–582. doi: 10.1016/j.immuni.2011.08.014. - DOI - PubMed
    1. Cao Y., Jiang X., Ma H., Wang Y., Xue P., Liu Y. SIRT1 and insulin resistance. J. Diabetes Complications. 2016;30:178–183. doi: 10.1016/j.jdiacomp.2015.08.022. - DOI - PubMed

MeSH terms