. 2020 May;10(5):702-723.
doi: 10.1158/2159-8290.CD-19-0945. Epub 2020 Mar 19.

Tuning the Antigen Density Requirement for CAR T-cell Activity

Affiliations

Tuning the Antigen Density Requirement for CAR T-cell Activity

Robbie G Majzner et al. Cancer Discov. 2020 May.

Abstract

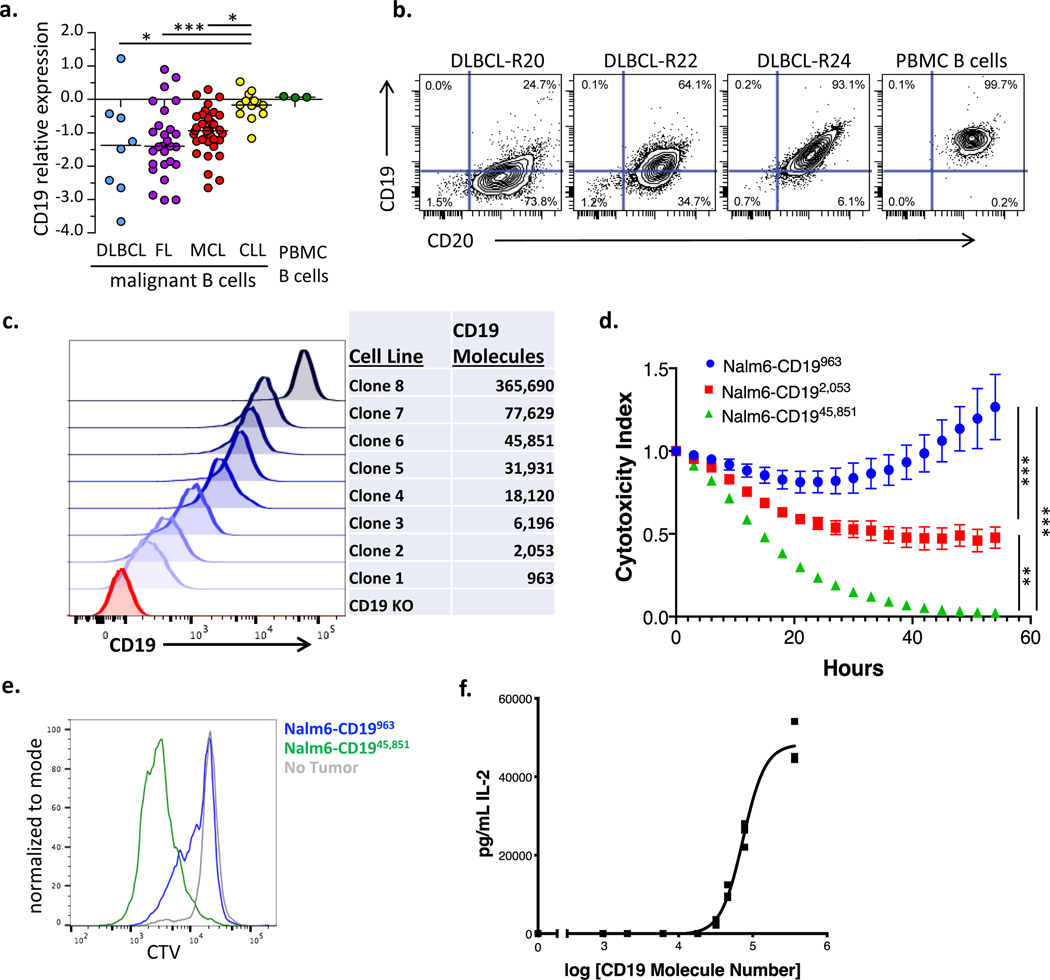
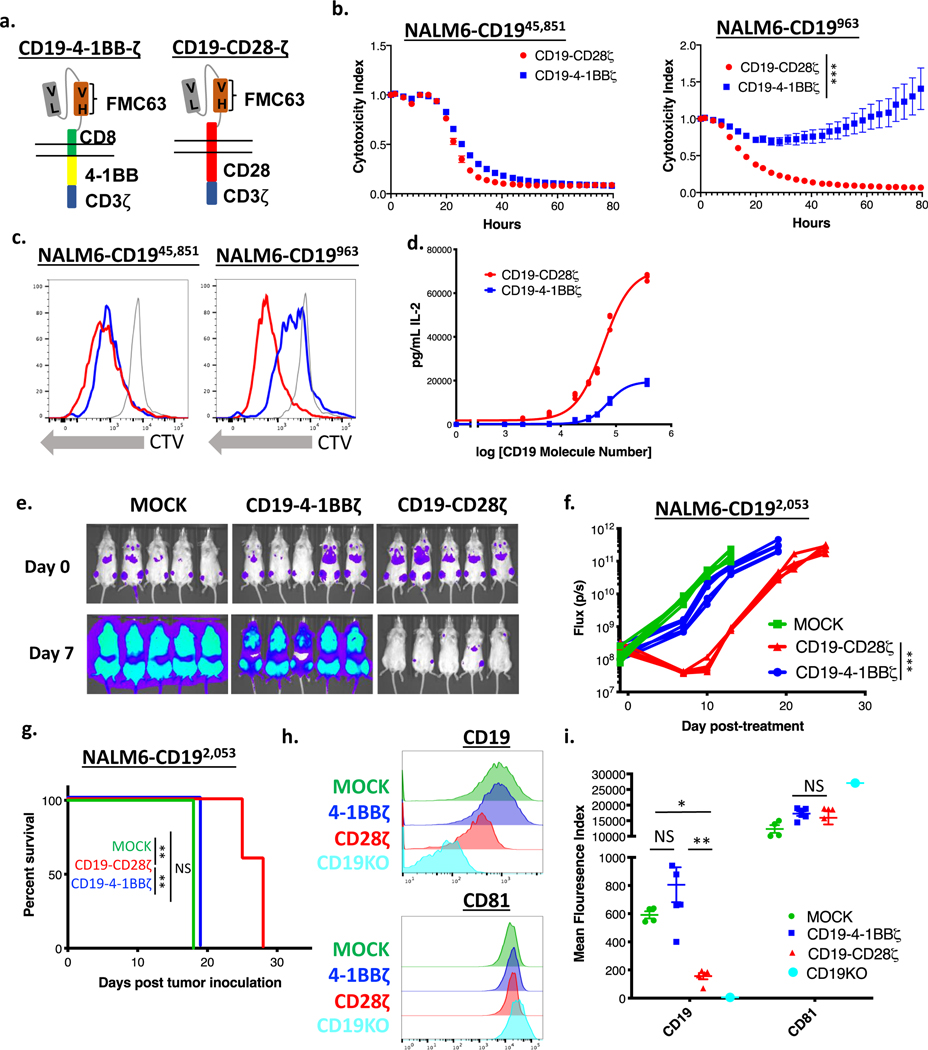
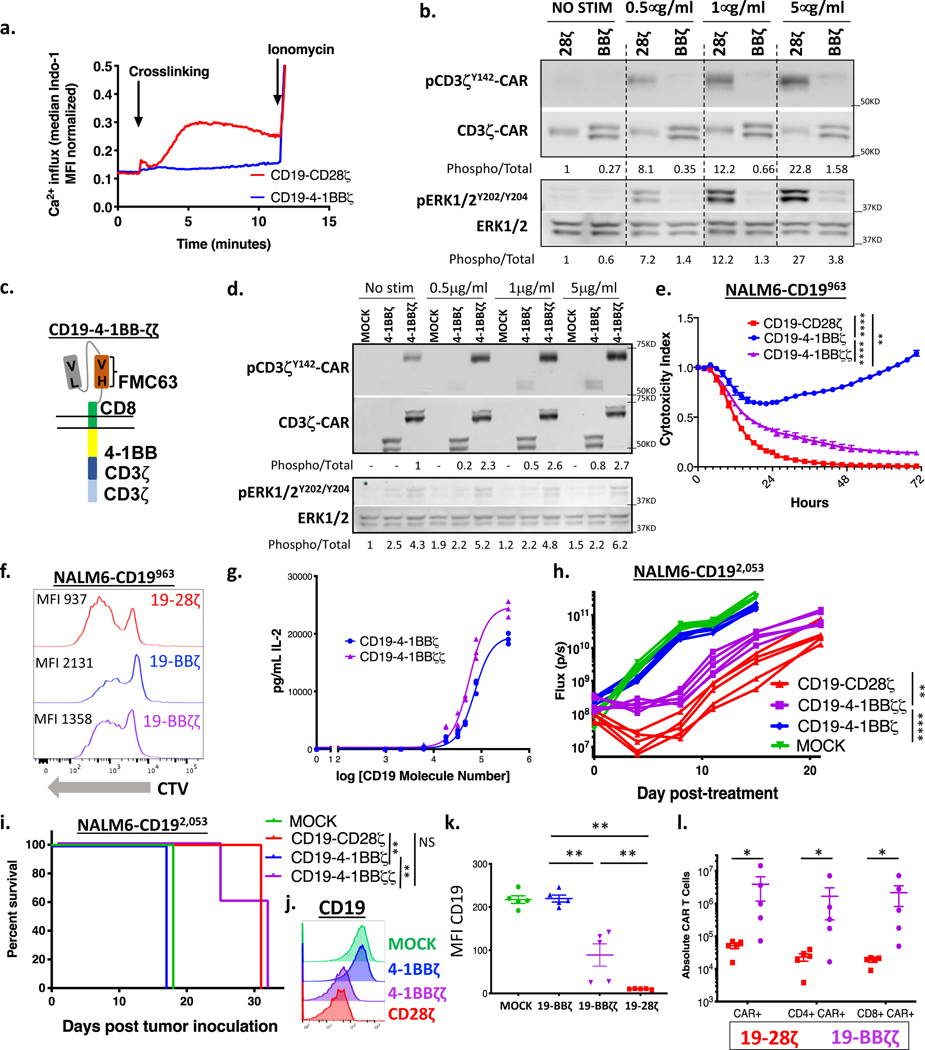
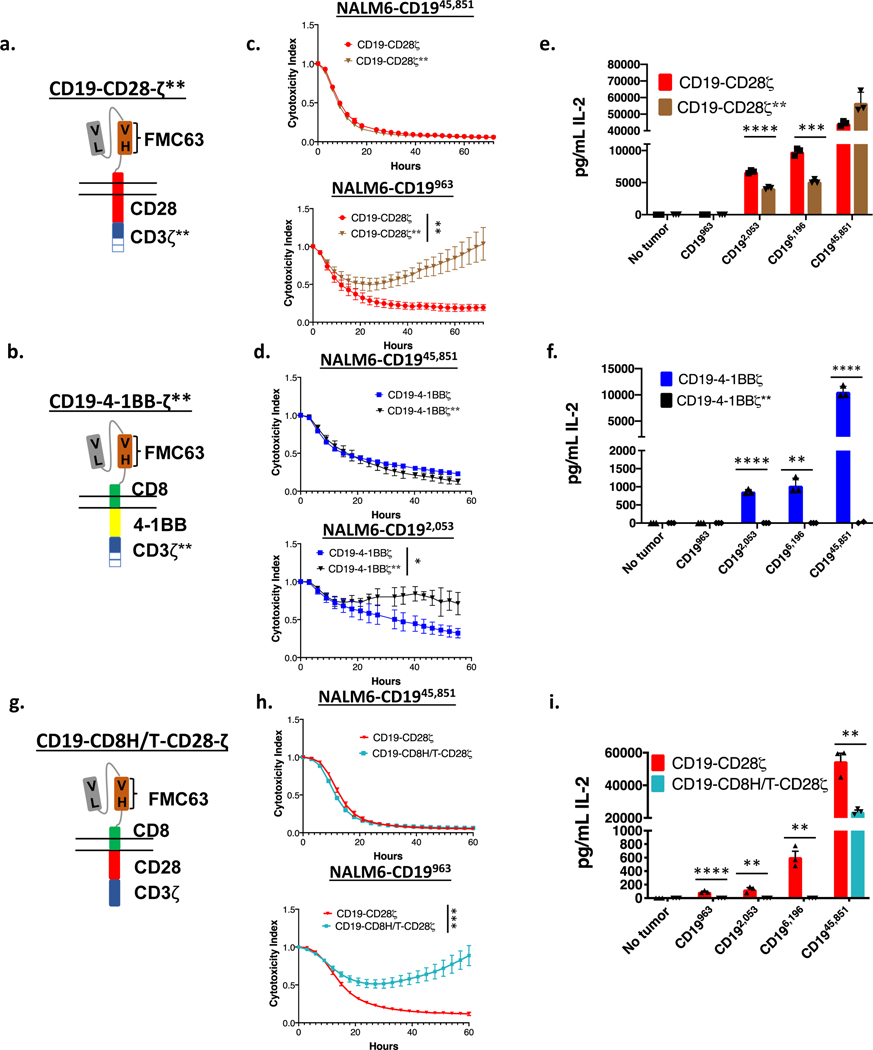
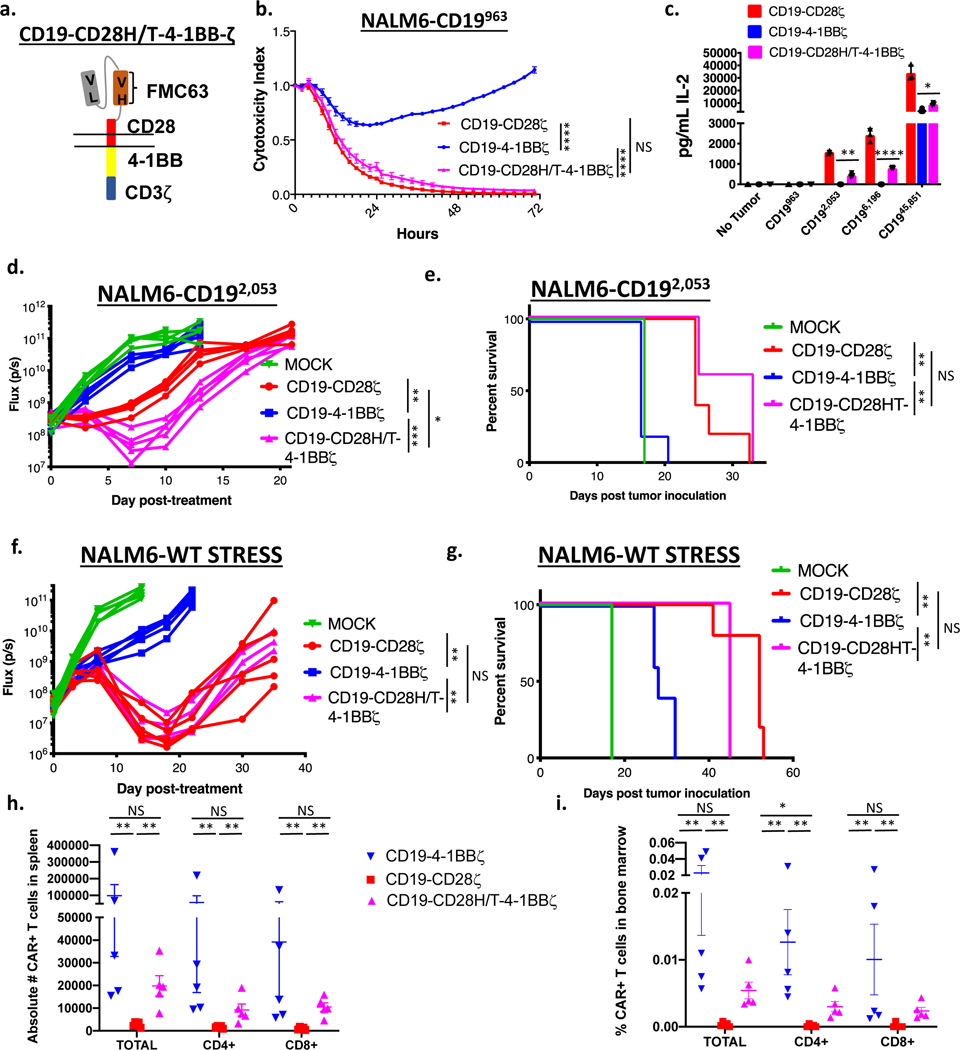
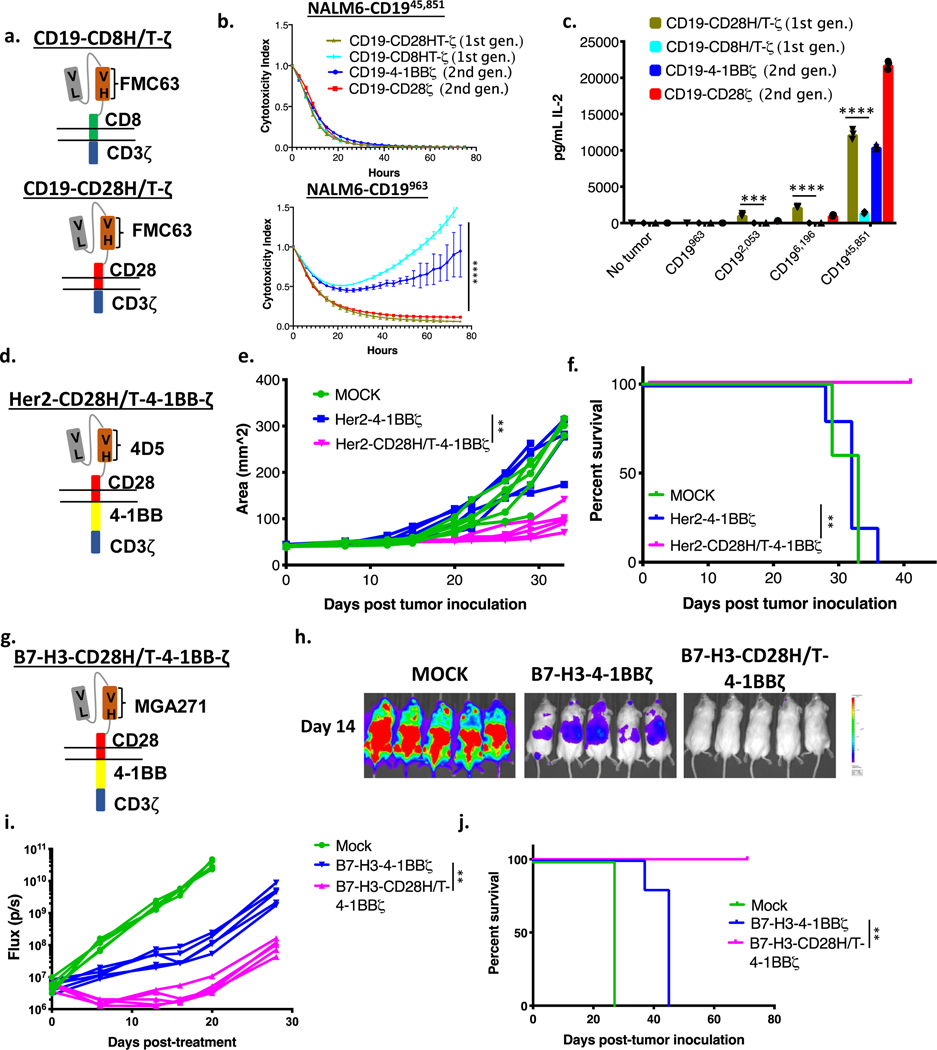
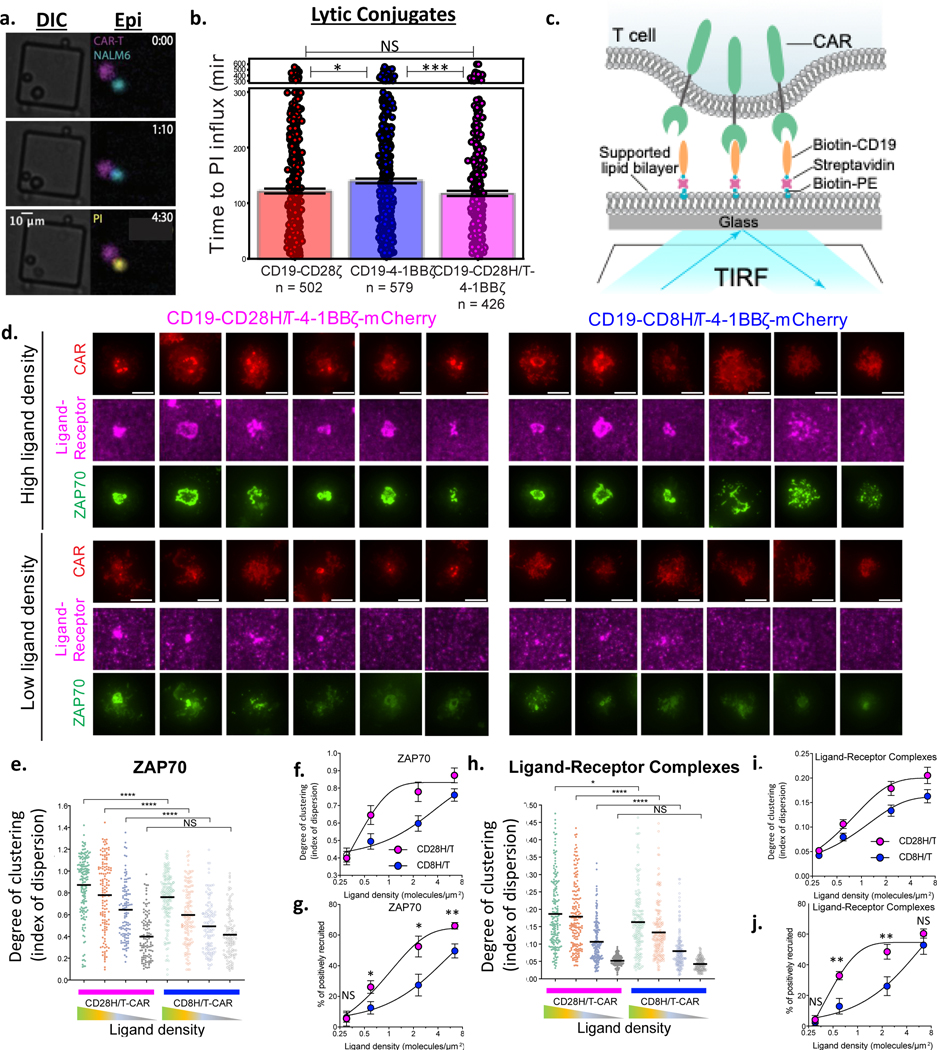
Insufficient reactivity against cells with low antigen density has emerged as an important cause of chimeric antigen receptor (CAR) T-cell resistance. Little is known about factors that modulate the threshold for antigen recognition. We demonstrate that CD19 CAR activity is dependent upon antigen density and that the CAR construct in axicabtagene ciloleucel (CD19-CD28ζ) outperforms that in tisagenlecleucel (CD19-4-1BBζ) against antigen-low tumors. Enhancing signal strength by including additional immunoreceptor tyrosine-based activation motifs (ITAM) in the CAR enables recognition of low-antigen-density cells, whereas ITAM deletions blunt signal and increase the antigen density threshold. Furthermore, replacement of the CD8 hinge-transmembrane (H/T) region of a 4-1BBζ CAR with a CD28-H/T lowers the threshold for CAR reactivity despite identical signaling molecules. CARs incorporating a CD28-H/T demonstrate a more stable and efficient immunologic synapse. Precise design of CARs can tune the threshold for antigen recognition and endow 4-1BBζ-CARs with enhanced capacity to recognize antigen-low targets while retaining a superior capacity for persistence. SIGNIFICANCE: Optimal CAR T-cell activity is dependent on antigen density, which is variable in many cancers, including lymphoma and solid tumors. CD28ζ-CARs outperform 4-1BBζ-CARs when antigen density is low. However, 4-1BBζ-CARs can be reengineered to enhance activity against low-antigen-density tumors while maintaining their unique capacity for persistence.This article is highlighted in the In This Issue feature, p. 627.


Conflict of interest statement

Conflicts of Interests: RGM, CLM, SPR, LL, ES, RCL, EWW, and SH hold several relevant pending patent applications in the area CAR T cell immunotherapy. CLM is a founder of, holds equity in, and receives consulting fees from Lyell Immunopharma. SPR and RCL are employees of Lyell Immunopharma. RGM, ES, LL, and EWW are consultants for Lyell Immunopharma. RGM is a consultant for Xyphos, Inc and GammaDelta Therapeutics. CLM is a consultant for NeoImmuneTech, Nektar, Apricity and Roche.

Figures

Figure 1:
Figure 1:. CD19 antigen density influences CD19 CAR activity.
(a) Primary diagnostic samples of diffuse large B cell lymphoma (DLBCL), mantle cell lymphoma (MCL), follicular lymphoma (FL), and chronic lymphocytic leukemia (CLL) were analyzed by flow cytometry for expression of CD19 compared to normal B cells from healthy donors. Shown is CD19 protein expression, relative to healthy donor PBMC B cells on a Log2 scale. DLBCL: n=8, FL: n=27, CLL: n=13, MCL: n=35. Statistical differences between groups were analyzed by one-way ANOVA non-parametric test with Dunns post-test correction. (b) Representative contour plots illustrating expression levels of CD19 and CD20 in three DLBCL cases as compared to PBMC B cells from healthy donors. (c) Flow cytometric analysis of the expression levels of truncated CD19 on the surface of a library of NALM6 clones. Number of molecules of CD19 for each clone were semiquantitatively determined by the BD Quantibrite kit. (d) NALM6 clones expressing indicated densities of surface CD19 molecules were cocultured at a 1:1 ratio with CD19–4-1BBζ CAR T cells and tumor cell killing was measured in an Incucyte assay. Representative of six experiments with different T cell donors. Statistical analysis performed with repeated measures ANOVA. (e) CD19–4-1BBζ CAR T cells were labeled with cell trace violet (CTV) and then cocultured at a 1:2 ratio with NALM6 clones expressing either 963 or 45,851 molecules of surface CD19. T cell proliferation was measured by flow cytometry four days later. Representative of three experiments with different T cell donors. (f) CD19–4-1BBζ CAR T cells were cocultured with NALM6 clones expressing various amounts of CD19 for 24 hours and secreted IL-2 was measured by ELISA. Shown is the concentration of cytokine measured as compared to log of the CD19 molecule number for that specific clone and curve fitting was done using a four-parameter variable slope dose-response curve. Representative of six experiments with different T cell donors. For all experiments, error bars represent SD. p < 0.05 was considered statistically significant, and p values are denoted with asterisks as follows: p > 0.05, not significant, NS; * p < 0.05, ** p < 0.01, *** p < 0.001, and **** p < 0.0001.
Figure 2:
Figure 2:. CD19-CD28ζ CAR T cells display superior activity compared to CD19–4-1BBζ CAR T cells against low antigen density target cells.
(a) Schema of CARs employed in these experiments. The CD19–4-1BBζ CAR molecule is identical to the CAR construct contained in tisagenlecleucel while the CD19-CD28ζ CAR molecule is identical to the CAR construct contained in axicabtagene ciloleucel. (b) NALM6 clones expressing either 963 or 45,851 molecules of surface CD19 were cocultured at a 1:1 ratio with either CD19-CD28ζ or CD19–4-1BBζ CAR T cells and tumor cell killing was measured in an Incucyte assay. Representative of six experiments with different T cell donors. Statistical analysis performed with repeated measures ANOVA. (c) CD19-CD28ζ and CD19–4-1BBζ CAR T cells were labeled with cell trace violet (CTV) and then cocultured with NALM6 clones expressing either 963 or 45,851 molecules of surface CD19. T cell proliferation was measured by flow cytometry four days later. Representative of three experiments with different T cell donors. (d) CD19-CD28ζ and CD19–4-1BBζ CAR T cells were cocultured with NALM6 clones expressing various amounts of CD19 for 24 hours and secreted IL-2 was measured in the supernatant by ELISA. Shown is the concentration of cytokine measured as compared to log of the CD19 molecule number for that specific clone and curve fitting was done using a four-parameter variable slope dose-response curve. Representative of six experiments with different T cell donors. (e) One million NALM6-CD192,053 cells were engrafted into NSG mice by tail vein injection. Four days later, mice were injected with 3 million CD19-CD28ζ CAR T cells, CD19–4-1BBζ CAR T cells, or untransduced control T cells (MOCK). Tumor progression was measured by bioluminescence photometry and flux values (photons per second) were calculated using Living Image software. Representative images are shown. (f) Quantified tumor flux values for individual mice treated as in (e). The MOCK group on day +15 were either found dead prior to imaging or sick with limited perfusion such that imaging results were unreliable and were thus excluded. Statistical analysis performed with repeated measures ANOVA. (g) Survival curves shown for mice treated as in (e). Statistical analysis performed with the log-rank test. (e-g) are representative of six experiments with different T cell donors (n=5 mice per group). (h, i) Leukemia cells from the bone marrow of treated mice (n=5) were phenotyped by flow cytometry for expression of CD19 and CD81. The CD19 knockout cell line from cell culture was used as reference control. Shown are representative flow plots (h) and quantified mean flouresence intensity (MFI) data (i). Representative of three different experiments with different T cell donors. Statistical comparisons performed by Mann Whitney between the indicated groups. For in vitro experiments, error bars represent SD and for in vivo experiments, error bars represent SEM. p < 0.05 was considered statistically significant, and p values are denoted with asterisks as follows: p > 0.05, not significant, NS; * p < 0.05, ** p < 0.01, *** p < 0.001, and **** p < 0.0001.
Figure 3:
Figure 3:. Enhancing CAR signal strength lowers the antigen density threshold for CAR T cells.
(a) CD19-CD28ζ and CD19–4-1BBζ CAR T cells were loaded with Indo-1 ratiometric dye and then stimulated with 5 μg/mL of anti-idiotype antibody and 5 μg/mL goat anti-mouse crosslinking antibody. Calcium flux was measured in real time for the two cell populations by flow cytometry. Representative of three experiments with different T cell donors. (b) CD19-CD28ζ and CD19–4-1BBζ CAR T cells were stimulated for five minutes with increasing concentrations of idiotype and crosslinking antibodies. pERK, total ERK, pCD3ζ-CAR, and total CD3ζ-CAR were measured by western blot. Numbers under the gels represent the ratio of the intensity of the signal obtained with phospho-specific antibodies relative to the total. Relative values were normalized to one of the untreated controls. Representative of three experiments with different T cell donors. (c) Schema of a CD19–4-1BBζζ-CAR, with a 4–1BB costimulatory domain and a duplicated CD3ζ domain. (d) CD19–4-1BBζ and CD19–4-1BBζζ CAR T cells were stimulated for five minutes with increasing concentrations of idiotype and crosslinking antibodies. pERK, total ERK, pCD3ζ-CAR, and total CD3ζ-CAR were measured by western blot. Representative of two experiments with different T cell donors. (e) NALM6 clones expressing 963 molecules of surface CD19 were cocultured at a 1:1 ratio with CD19-CD28ζ, CD19–4-1BBζ, or CD19–4-1BBζζ CAR T cells and tumor cell killing was measured in an Incucyte assay. Representative of six experiments with different T cell donors. Statistical analysis performed with repeated measures ANOVA. (f) CD19-CD28ζ, CD19–4-1BBζ, and CD19–4-1BBζζ CAR T cells were stained with cell trace violet (CTV) and then cocultured with NALM6 clones expressing 963 molecules of surface CD19. T cell proliferation was measured by flow cytometry four days later. Representative of three experiments with different T cell donors. (g) CD19–4-1BBζ and CD19–4-1BBζζ CAR T cells were cocultured with NALM6 clones expressing various amounts of CD19 for 24 hours and IL-2 was measured in the supernatant by ELISA. Shown is the amount of cytokine measured as compared to log of the CD19 molecule number for that specific clone and curve fitting was done using a four-parameter variable slope dose-response curve. Representative of three experiments with different T cell donors. (h) One million NALM6-CD192,053 cells were engrafted into NSG mice by tail vein injection. Four days later, mice were injected with 3 million CD19-CD28ζ, CD19–4-1BBζ, CD19–4-1BBζζ CAR T or untransduced control T cells (MOCK). Tumor progression was measured by bioluminescence photometry and flux values (photons per second) were calculated using Living Image software. Quantified tumor flux values for individual mice are shown. Statistical analysis performed with repeated measures ANOVA. (i) Mouse survival curves for mice treated as in (h). Statistical analysis performed with the log-rank test. (h-i) are representative of three experiments with different T cell donors (n=5 mice per group). (j, k) Leukemia cells from the bone marrow of treated mice (n=5 per group) were phenotyped by flow cytometry for expression of CD19. Shown are representative flow plots (j) and quantified mean fluorescence intensity (MFI) (k). Representative of two different experiments with different T cell donors. Statistical comparisons performed by Mann Whitney between the indicated groups. (l) The spleens of treated mice (n=5 per group) were obtained at experimental endpoint. CAR T cell numbers were assessed by flow cytometry. Statistical comparisons performed by Mann Whitney between the indicated groups. For in vitro experiments, error bars represent SD and for in vivo experiments, error bars represent SEM. p < 0.05 was considered statistically significant, and p values are denoted with asterisks as follows: p > 0.05, not significant, NS; * p < 0.05, ** p < 0.01, *** p < 0.001, and **** p < 0.0001.
Figure 4:
Figure 4:. Engineering CARs to reduce downstream signaling strength sacrifices CAR efficacy against low antigen density tumors.
(a) Schema of a CD19-CD28ζ CAR with only a single ITAM (CD19-CD28ζ**). (b) Schema of a CD19–4-1BBζ CAR with only a single ITAM (CD19–4-1BBζ**). (c) NALM6 clones expressing either 963 or 45,851 molecules of surface CD19 were cocultured at a 1:1 ratio with either CD19-CD28ζ or CD19-CD28ζ** CAR T cells and tumor cell killing was measured in an Incucyte assay. Representative of three experiments with different T cell donors. Statistical analysis performed with repeated measures ANOVA. (d) NALM6 clones expressing either 2,053 or 45,851 molecules of surface CD19 were cocultured at a 1:1 ratio with either CD19–4-1BBζ or CD19–4-1BBζ** CAR T cells and tumor cell killing was measured in an Incucyte assay. Representative of three experiments with different T cell donors. Statistical analysis performed with repeated measures ANOVA. (e) CD19-CD28ζ and CD19-CD28ζ** CAR T cells were cocultured with NALM6 clones expressing various amounts of CD19 for 24 hours and secreted IL-2 was measured in the supernatant by ELISA. Representative of three experiments with different T cell donors. Statistical comparisons performed by the student’s t-test (two sided). (f) CD19–4-1BBζ and CD19–4-1BBζ** CAR T cells were cocultured with NALM6 clones expressing various amounts of CD19 for 24 hours and secreted IL-2 was measured in the supernatant by ELISA. Representative of three experiments with different T cell donors. Statistical comparisons performed by the student’s t-test (two sided). (g) Schema of a CD19 CAR containing the CD8 hinge-transmembrane region and the CD28 and CD3ζ endodomains (CD19-CD8H/T-CD28ζ). (h) NALM6 clones expressing either 963 or 45,851 molecules of surface CD19 were cocultured at a 1:1 ratio with either CD19-CD28ζ or CD19-CD8H/T-CD28ζ CAR T cells and tumor cell killing was measured in an Incucyte assay. Representative of three experiments with different T cell donors. Statistical analysis performed with repeated measures ANOVA. (i) CD19-CD28ζ and CD19-CD8H/T-CD28ζ CAR T cells were cocultured with NALM6 clones expressing various amounts of CD19 for 24 hours and secreted IL-2 was measured in the supernatant by ELISA. Representative of three experiments with different T cell donors. Statistical comparisons performed by the student’s t-test (two sided). For all experiments, error bars represent SD. p < 0.05 was considered statistically significant, and p values are denoted with asterisks as follows: p > 0.05, not significant, NS; * p < 0.05, ** p < 0.01, *** p < 0.001, and **** p < 0.0001.
Figure 5:
Figure 5:. Altering the hinge-transmembrane region dramatically affects CD19 CAR activity against low antigen density tumors.
(a) Schema of a CD19 CAR containing the CD28 hinge-transmembrane region and the 4–1BB and CD3ζ endodomains (CD19-CD28H/T-4–1BBζ). (b) NALM6 clones expressing 963 molecules of surface CD19 were cocultured at a 1:1 ratio with either CD19-CD28ζ, CD19–4-1BBζ, or CD19-CD28H/T-4–1BBζ CAR T cells and tumor cell killing was measured in an Incucyte assay. Representative of three experiments with different T cell donors. Statistical analysis performed with repeated measures ANOVA. (c) CD19-CD28ζ, CD19–4-1BBζ, and CD19-CD28H/T-4–1BBζ CAR T cells were cocultured with NALM6 clones expressing various amounts of CD19 for 24 hours and IL-2 was measured in the supernatant by ELISA. Representative of three experiments with different T cell donors. Statistical comparisons performed by the student’s t-test (two sided) between CD19–4-1BBζ and CD19-CD28H/T-4–1BBζ CAR T cells. (d) One million NALM6-CD192,053 cells were engrafted into NSG mice by tail vein injection. Four days later, mice were injected with 3 million CD19-CD28ζ, CD19–4-1BBζ, or CD19-CD28H/T-4–1BBζ CAR T cells. Tumor progression was measured by bioluminescence photometry and flux values (photons per second) were calculated using Living Image software. Quantified tumor flux values for individual mice are shown. Statistical analysis performed with repeated measures ANOVA. (e) Mouse survival curves for mice as treated in (d). Statistical analysis performed with the log-rank test. (d-e) are representative of three experiments with different T cell donors (n=5 mice per group). (f) One million NALM6-wildtype cells were engrafted into NSG mice by tail vein injection. Three days later, mice were injected with 2.5e5 CD19-CD28ζ, CD19–4-1BBζ, or CD19-CD28H/T-4–1BBζ CAR T cells. Tumor progression was measured by bioluminescence photometry and flux values (photons per second) were calculated using Living Image software. Quantified tumor flux values for individual mice are shown. Statistical analysis performed with repeated measures ANOVA. (g) Mouse survival curves for mice as treated in (f). Statistical analysis performed with the log-rank test. (f-g) are representative of two experiments with different T cell donors (n=5 mice per group). (h,i) One million NALM6-wildtype cells were engrafted into NSG mice by tail vein injection. Three days later, mice were injected with 5 million CD19-CD28ζ, CD19–4-1BBζ, or CD19-CD28H/T-4–1BBζ CAR T cells. The spleens (h) and bone marrow (i) of treated mice were obtained at Day +16 (n=5 per group) as well as Day +9 and Day +29 (Supplementary Figure 7) post CAR T cell treatment. Presence of CAR positive T cells was assessed by flow cytometry. Performed one time (n=5 per CAR construct per timepoint). Statistical comparisons performed by Mann Whitney between the indicated groups. For in vitro experiments, error bars represent SD and for in vivo experiments, error bars represent SEM. p < 0.05 was considered statistically significant, and p values are denoted with asterisks as follows: p > 0.05, not significant, NS; * p < 0.05, ** p < 0.01, *** p < 0.001, and **** p < 0.0001.
Figure 6:
Figure 6:. The CD28 hinge-transmembrane region enhances activity in a variety of tumor models and CAR architectures.
(a) Schema of first generation CD19 CARs with either a CD8 or CD28 hinge-transmembrane region (CD19-CD8H/T-ζ and CD19-CD28H/T-ζ). (b) NALM6 clones expressing either 963 or 45,851 molecules of surface CD19 were cocultured at a 1:1 ratio with either CD19-CD28ζ, CD19–4-1BBζ, CD19-CD28H/T-ζ or CD19-CD8H/T-ζ CAR T cells and tumor cell killing was measured in an Incucyte assay. Representative of three experiments with different T cell donors. Statistical analysis performed with repeated measures ANOVA between CD19-CD28H/T-ζ and CD19-CD8H/T-ζ. (c) CD19-CD28ζ, CD19–4-1BBζ, CD19-CD28H/T-ζ, and CD19-CD8H/T-ζ CAR T cells were cocultured with NALM6 clones expressing various amounts of CD19 for 24 hours and secreted IL-2 was measured in the supernatant by ELISA. Representative of three experiments with different T cell donors. Statistical comparisons performed with the student’s t-test (two sided) between CD19-CD28H/T-ζ and CD19-CD8H/T-ζ. (d) Schema of a Her2 CAR containing a CD28 hinge-transmembrane region and 4–1BB costimulatory domain (Her2-CD28H/T-4–1BBζ). (e) One million 143b osteosarcoma cells were orthotopically implanted in the hind leg of NSG mice. After seven days, mice were treated with 10 million Her2–4-1BBζ CAR T cells, Her2-CD28H/T-4–1BBζ CAR T cells, or untransduced control T cells (MOCK). Leg measurements were obtained twice weekly with digital calibers. Measurements for individual mice are shown. Statistical analysis performed with repeated measures ANOVA. (f) Survival curves for mice treated as in (e). Statistical analysis performed with the log-rank test. (e-f) are representative of two experiments with different T cell donors (n=5 mice per group). (g) Schema of a B7-H3 CAR containing a CD28 hinge-transmembrane region and 4–1BB costimulatory domain (B7-H3-CD28H/T-4–1BBζ). (h) One million CHLA255 neuroblastoma cells were engrafted into NSG mice by tail vein injection in a metastatic neuroblastoma model. Six days later, mice were injected with 10 million B7-H3–4-1BBζ CAR T cells, B7-H3-CD28H/T-4–1BBζ CAR T cells, or untransduced control T cells (MOCK). Tumor progression was measured by bioluminescence photometry and flux values (photons per second) were calculated using Living Image software. Representative bioluminescent images are shown. (i) Quantified tumor flux values for individual mice treated as in (h). Statistical analysis performed with repeated measures ANOVA. (j) Survival curves for mice treated as in (h). Statistical analysis performed with the log-rank test. (h-j) are representative of two experiments with different T cell donors. For in vitro experiments, error bars represent SD and for in vivo experiments, error bars represent SEM. p < 0.05 was considered statistically significant, and p values are denoted with asterisks as follows: p > 0.05, not significant, NS; * p < 0.05, ** p < 0.01, *** p < 0.001, and **** p < 0.0001.
Figure 7:
Figure 7:. The CD28 Hinge-Transmembrane domain results in more efficient receptor clustering, T cell activation, and tumor cell killing.
(a,b) CAR T cells and NALM6 cells were seeded at low density on a microwell plate and scanned for wells containing one tumor cell and one CAR T cell. Experiment was performed 6 times across two different T cell donors. (a) A representative well from the single-cell microwell killing experiment is shown. CAR T cells and NALM6 leukemia cells were distinguished by CellTrace Far Red (false-colored magenta) and GFP (false-colored cyan) labels, respectively. Cell death was determined by influx of cell-impermeable propidium iodide dye (PI, false-colored yellow). Lytic conjugates were defined as events where one T cell and one NALM6 cell remained within a threshold distance, and the NALM6 cell died (took up PI). Nonlytic conjugates represent conjugates where the T cell and tumor cell interact but the NALM6 cell did not die (did not take up PI). DIC: Differential interference contrast and Epi: epifluorescence. (b) Time from T cell/tumor cell interaction to PI influx was measured in wells containing one tumor cell and one T cell per CAR construct. Pooled data from all 6 experiments (400–600 wells) is shown. Error bars represent SD. Statistical analysis performed with the student’s t-test (two sided). (c) Diagram of the imaging-based CAR T cell activation assay. To stimulate CD19-CD28H/T-4–1BBζ and CD19–4-1BBζ CAR T cells, CAR T cells were exposed to a planar supported lipid bilayer (SLB) functionalized with a freely diffusing CD19 proteins coupled by a biotin-streptavidin-biotin bridge. Ligand-receptor engagement leads to the reorganization of ligand-bound receptors into microclusters that recruit the tyrosine kinase ZAP70 (fused to GFP, not shown in this diagram) from the cytosol to the plasma membrane, and drive the centripetal translocation of the microclusters from the periphery to the cell center. These events are visualized by TIRF microscopy (fluorescence: CAR-mCherry, ZAP70-GFP, Streptavidin-Alexa647). Ligand density in the planar supported lipid bilayer is controlled through the concentration of Biotin-PE containing small unilamellar vesicles (SUVs). To assess the level of recruitment/degree of clustering across cells that display a range of expression levels, index of dispersion (i.e. normalized variance, which equals the standard deviation divided by the mean of the fluorescence intensity of each cell, see methods for details) was used. (d) Representative images of single CD19-CD28H/T-4–1BBζ-mCherry (left) and CD19-CD8H/T-4–1BBζ-mCherry (right) CAR T cells transduced with ZAP70-GFP activated on planar supported lipid bilayer containing high (~6.0 molecule/μm2; top panel) and low (~0.6 molecule/μm2; bottom panel) concentrations of CD19. (e) Degree of clustering (index of dispersion) for ZAP70-GFP recruited to the immune synapse for each CAR construct at four different CD19 densities. (f) Pooled ZAP70 degree of clustering (index of dispersion) data from (e) plotted as a dose response curve for ligand density. (g) Percentage of cells activated (ZAP70 recruitment above a threshold) plotted as a dose response curve for ligand density. (h) Degree of clustering (index of dispersion) for ligand-receptor complexes recruited to the immune synapse for each CAR construct at four different CD19 densities. (i) Pooled ligand-receptor complex degree of clustering (index of dispersion) data from (h) plotted as a dose response curve for ligand density. (j) Percentage of cells recruiting ligand-receptor complexes (above a threshold) plotted as a dose response curve for ligand density. (d-j) Data (shown as mean ± SD) are representative from one experiment of two performed with different T cell donors. n > 100 per condition. Statistical analysis performed with the two-tailed t-test. p < 0.05 was considered statistically significant, and p values are denoted with asterisks as follows: p > 0.05, not significant, NS; * p < 0.05, ** p < 0.01, *** p < 0.001, and **** p < 0.0001.

References

    1. Majzner RG, Mackall CL. Clinical lessons learned from the first leg of the CAR T cell journey. Nat Med 2019;25(9):1341–55 doi 10.1038/s41591-019-0564-6. - DOI - PubMed
    1. June CH, Sadelain M. Chimeric Antigen Receptor Therapy. N Engl J Med 2018;379(1):64–73 doi 10.1056/NEJMra1706169. - DOI - PMC - PubMed
    1. Lee DW, Kochenderfer JN, Stetler-Stevenson M, Cui YK, Delbrook C, Feldman SA, et al. T cells expressing CD19 chimeric antigen receptors for acute lymphoblastic leukaemia in children and young adults: a phase 1 dose-escalation trial. Lancet 2015;385(9967):517–28 doi 10.1016/S0140-6736(14)61403-3. - DOI - PMC - PubMed
    1. Maude SL, Frey N, Shaw PA, Aplenc R, Barrett DM, Bunin NJ, et al. Chimeric antigen receptor T cells for sustained remissions in leukemia. N Engl J Med 2014;371(16):1507–17 doi 10.1056/NEJMoa1407222. - DOI - PMC - PubMed
    1. Maude SL, Laetsch TW, Buechner J, Rives S, Boyer M, Bittencourt H, et al. Tisagenlecleucel in Children and Young Adults with B-Cell Lymphoblastic Leukemia. N Engl J Med 2018;378(5):439–48 doi 10.1056/NEJMoa1709866. - DOI - PMC - PubMed

Publication types

Substances