. 2021 Feb 1;106(2):391-403.
doi: 10.3324/haematol.2019.237040.

C-FGF23 peptide alleviates hypoferremia during acute inflammation

Affiliations

C-FGF23 peptide alleviates hypoferremia during acute inflammation

Rafiou Agoro et al. Haematologica. .

Abstract

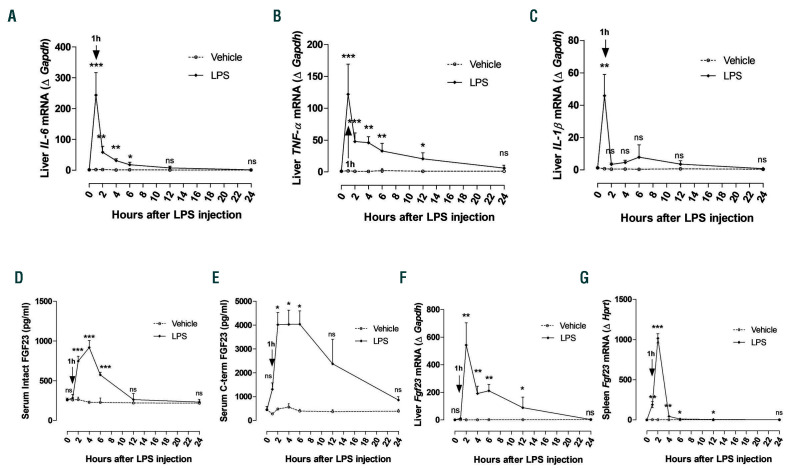
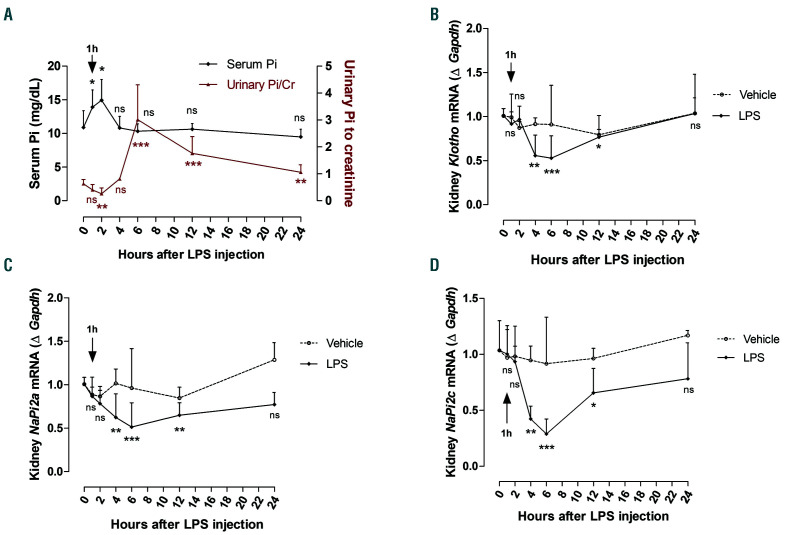
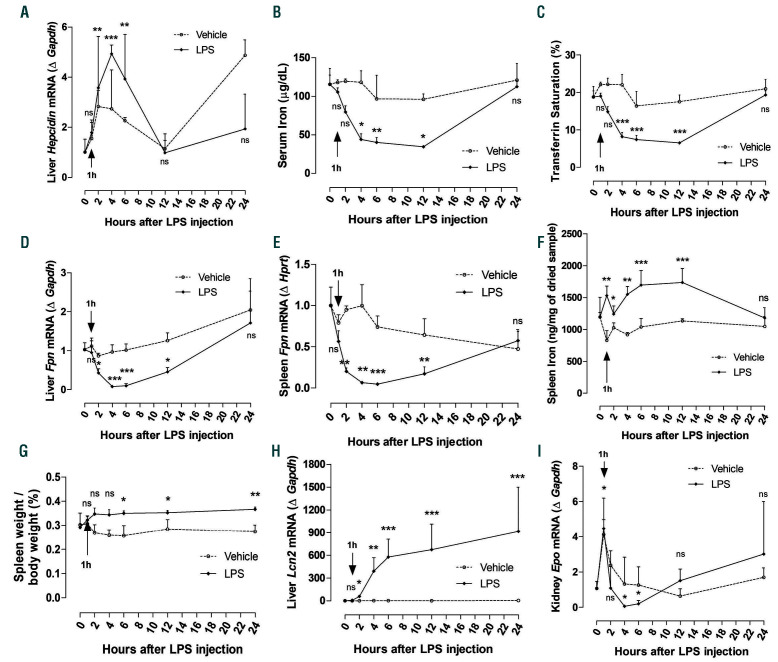
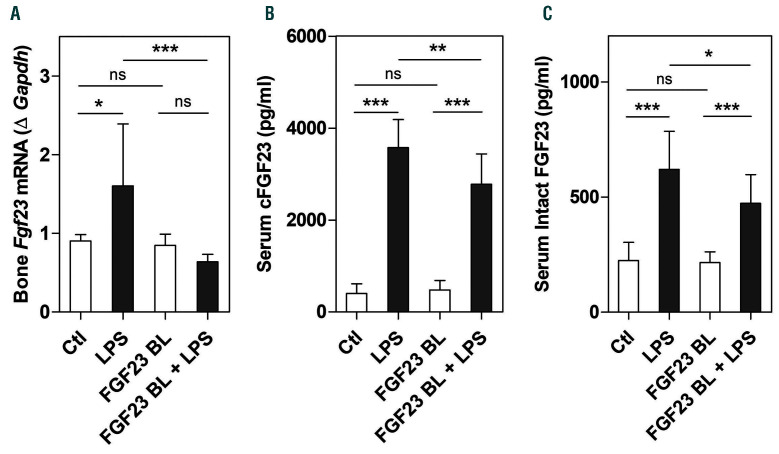
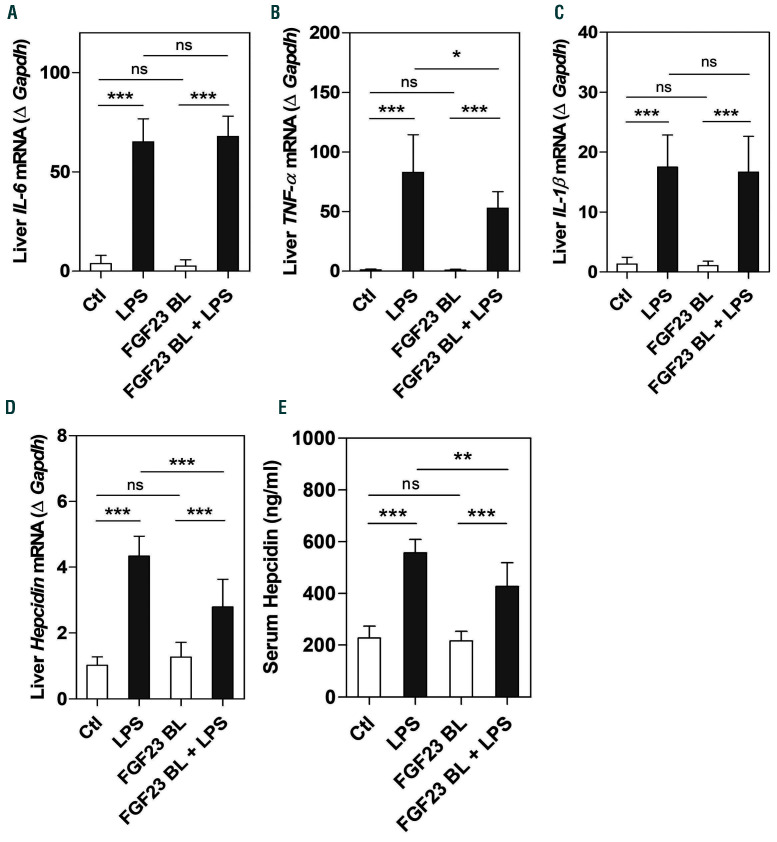
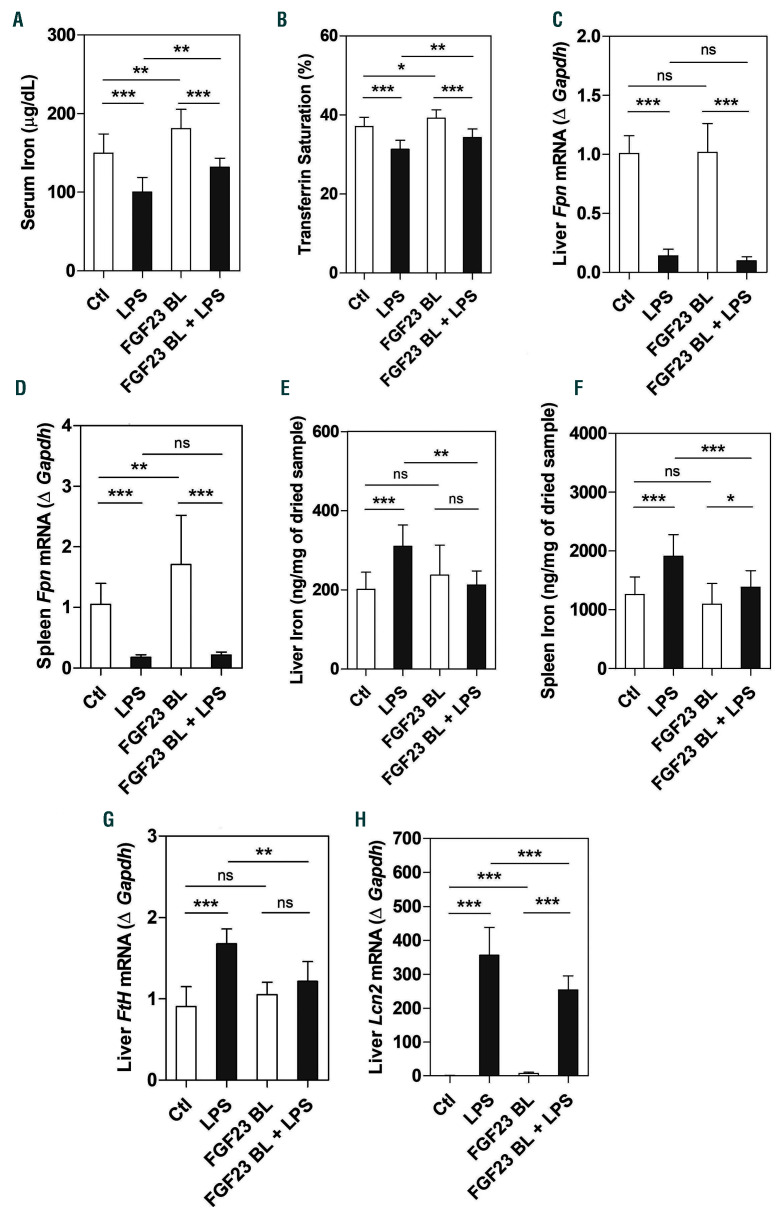
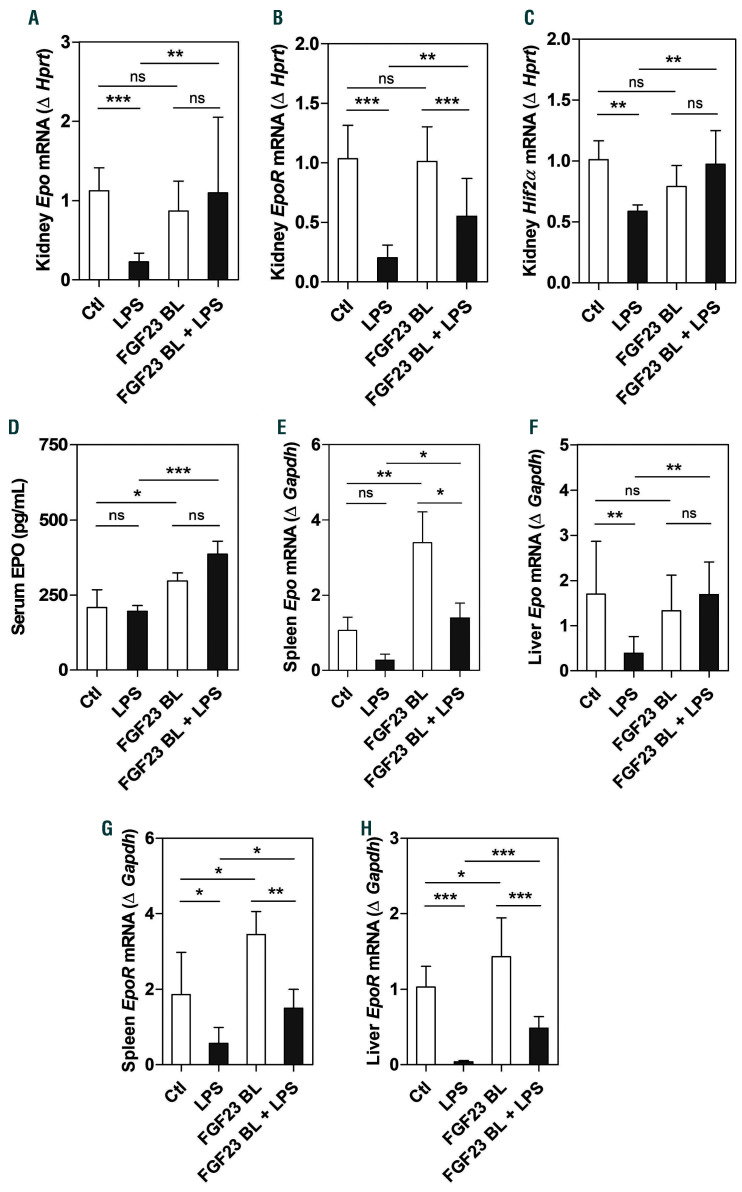
Hypoferremia results as an acute phase response to infection and inflammation aiming to reduce iron availability to pathogens. Activation of toll-like receptors (TLRs), the key sensors of the innate immune system, induces hypoferremia mainly through the rise of the iron hormone hepcidin. Conversely, stimulation of erythropoiesis suppresses hepcidin expression via induction of the erythropoietin-responsive hormone erythroferrone. Iron deficiency stimulates transcription of the osteocyte-secreted protein FGF23. Here we hypothesized that induction of FGF23 in response to TLR4 activation is a potent contributor to hypoferremia and, thus, impairment of its activity may alleviate hypoferremia induced by lipopolysaccharide (LPS), a TLR 4 agonist. We used the C-terminal tail of FGF23 to impair endogenous full-length FGF23 signaling in wild-type mice, and investigated its impact on hypoferremia. Our data show that FGF23 is induced as early as pro-inflammatory cytokines in response to LPS, followed by upregulation of hepcidin and downregulation of erythropoietin (Epo) expression in addition to decreased serum iron and transferrin saturation. Further, LPS-induced hepatic and circulating hepcidin were significantly reduced by FGF23 signaling disruption. Accordingly, iron sequestration in liver and spleen caused by TLR4 activation was completely abrogated by FGF23 signaling inhibition, resulting in alleviation of serum iron and transferrin saturation deficit. Taken together, our studies highlight for the first time that inhibition of FGF23 signaling alleviates LPS-induced acute hypoferremia.


Figures

Figure 1.
Figure 1.
Early induction of Fgr23 in response to lipopolysaccharide (LPS). C57BL/6J mice were injected intraperitoneally (i.p.) with a single dose of saline (0.9% NaCl, indicated as Vehicle) or LPS (50 mg/kg). Samples were collected at 0 (saline injection only), 1, 2, 4, 6, 12, and 24 hours (h) after treatment and total mRNA was isolated. (A-C) Quantitative real-time polymerase chain reaction (qRT-PCR) of (A) IL-6, (B) TNF-α, and (C) IL-1β expression in liver. (D and E) Serum concentration of (D) intact and (E) C-terminal FGF23 measured by ELISA. (F and G) qRT-PCR for Fgf23 expression in (F) liver and (G) spleen. Data are expressed as fold change (2-DDCt) relative to housekeeping genes Gapdh or Hprt. Samples were measured in duplicates (vehicle, n=3-4; LPS, n=5-8), and data are represented as mean+standard deviation. All data were analyzed for normality with Shapiro-Wilk test and equivalence of variance using Levene’s test. For samples with normal distribution, two-way ANOVA was performed in each vehicle- or LPS-treated group compared to 0 h with Bonferroni’s multiple comparison test (D). When the samples were not in normal distribution and equivalence of variance, data were analyzed with non-parametric Kruskal-Wallis test (A-C, E-G). ns: not significant, *P<0.05, **P<0.01, ***P<0.001 compared to 0 h.
Figure 2.
Figure 2.
Regulation of phosphate homeostasis following lipopolysaccharide (LPS) administration. (A) Phosphate levels measured in serum and urine at 0, 1, 2, 4, 6, 12, and 24 hours (h) after i.p. injection of LPS (50 mg/kg). (B-D) Quantitative real-time polymerase chain reaction (qRT-PCR) for renal (B) Klotho, (C) NaPi2a, and (D) NaPi2c expression. Data are expressed as fold change (2-DDCt) relative to housekeeping gene Gapdh. Samples were measured in duplicates (vehicle, n=3-4; LPS, n=5-8). Data are represented as mean+standard deviation. All data were analyzed for normality with Shapiro-Wilk test and equivalence of variance using Levene’s test. For serum Pi, data were analyzed by non-parametric Kruskal-Wallis test; for the ratio of urinary Pi to creatinine, data were aligned in RANK transformation and analyzed with one-way ANOVA followed by Bonferroni’s multiple comparison test (A). With the samples showing normal distribution, two-way ANOVA was performed in each vehicle- or LPS-treated group compared to 0 h with Bonferroni’s multiple comparison test (C). The samples not in normal distribution were analyzed with nonparametric Kruskal-Wallis test (B and D). ns: not significant, *P<0.05, **P<0.01, ***P<0.001 compared to 0 h.
Figure 3.
Figure 3.
Effect of lipopolysaccharide (LPS) on iron homeostasis and renal Epo mRNA expression. C57BL/6J mice were injected intraperitoneally (i.p.) with saline (0.9% NaCl, indicated as Vehicle) or LPS (50 mg/kg). Samples were collected at 0, 1, 2, 4, 6, 12, and 24 hours (h) after treatment. (A) Quantitative real-time polymerase chain reaction (qRT-PCR) for hepcidin expression in liver. (B) Serum iron and (C) serum transferrin saturation. (D and E) qRT-PCR for ferroportin (Fpn) expression in (D) liver and (E) spleen. (F) Iron content in spleen. (G) Spleen weight normalized to the body weight of the animals. (H) qRT-PCR for lipocalin (Lcn2) in liver. (I) qRT-PCR for renal Epo mRNA expression. Data are expressed as fold change (2-DDCt) relative to housekeeping genes Gapdh or Hprt. Samples were measured in duplicates (vehicle, n=3-4; LPS, n=5-8). Data are represented as mean±standard deviation. All data were analyzed for normality with Shapiro-Wilk test and equivalence of variance using Levene’s test. The samples not in normal distribution were analyzed with non-parametric Kruskal-Wallis test (A and B, D-I). When the samples showed normal distribution, two-way ANOVA was performed with Bonferroni’s multiple comparison test in each vehicle- or LPS-treated group compared to 0 h (C). ns: not significant, *P<0.05, **P<0.01, ***P<0.001 compared to 0 h.
Figure 4.
Figure 4.
Inhibition of fibroblast growth factor 23 (FGF23) signaling decreases Fgf23 expression and circulating levels induced by lipopolysaccharide (LPS). C57BL/6J wild-type mice were injected intraperitoneally (i.p.) with C-tail FGF23 (1 mg/kg, indicated as FGF23 BL) or vehicle (HEPES buffer) for 8 hours (h). Mice were then challenged with LPS (i.p. 50 mg/kg) or vehicle (0.9% NaCl) for 4 h. (A) Quantitative real-time polymerase chain reaction (qRT-PCR) for Fgf23 expression in bone. Data are expressed as fold change (2-DDCt) relative to housekeeping gene Gapdh. (B and C) Serum concentration of (B) C-terminal FGF23 (cFGF23) and (C) intact FGF23 measured by ELISA. Samples were measured in duplicates (n=5-7 per group). Data are represented as mean+standard deviation. All data were analyzed for normality with Shapiro-Wilk test and equivalence of variance using Levene’s test. Because the samples did not show normal distribution, data were aligned in RANK transformation, and confirmed for normality. As the samples showed normal distribution, two-way ANOVA was performed with Bonferroni’s multiple comparison test. Ctl: control (vehicle), ns: not significant, *P<0.05, **P<0.01, ***P<0.001.
Figure 5.
Figure 5.
Effect of fibroblast growth factor 23 (FGF23) signaling disruption on inflammation and hepcidin secretion. C57BL/6J wild-type mice were treated with C-tail FGF23 (1 mg/kg, indicated as FGF23 BL) or vehicle (HEPES buffer) for 8 hours (h). Mice were then challenged with LPS (intraperitoneal 50 mg/kg) or vehicle (0.9% NaCl) for 4 h. (A-D) Quantitative real-time RT-PCR for hepatic expression of (A) IL-6, (B) TNF-α, (C) IL-1β, and (D) hepcidin. Data are expressed as fold change (2-DDCt) relative to housekeeping gene Gapdh. (E) Serum concentration of hepcidin measured by ELISA. Samples were measured in duplicates (n=5-7 per group). Data are represented as mean+standard deviation. All data were analyzed for normality with Shapiro-Wilk test and equivalence of variance using Levene’s test. Because the samples did not show normal distribution, data were aligned in RANK transformation, and confirmed for normality. As the samples showed normal distribution, two-way ANOVA was performed followed by Bonferroni’s multiple comparison test (A-E). Ctl: control (vehicle), ns: not significant, *P<0.05, **P<0.01, ***P<0.001.
Figure 6.
Figure 6.
Inhibition of fibroblast growth factor 23 (FGF23) signaling alleviates lipopolysaccharide (LPS)-induced hypoferremia. C57BL/6J wild-type mice were treated with C-tail FGF23 (1 mg/kg, indicated as FGF23 BL) or vehicle (HEPES buffer) for 8 hours (h). Mice were then challenged with LPS (intraperitoneal 50 mg/kg) or vehicle (0.9% NaCl) for 4 h. (A) Serum iron and (B) serum transferrin saturation. (C and D) Quantitative real-time polymerase chain reaction (qRT-PCR) for ferroportin (Fpn) expression in (C) liver and (D) spleen. (E and F) Iron content in (E) liver and (F) spleen. (G and H) qRT-PCR for hepatic expression of (G) ferritin H and (H) lipocalin (Lcn2). Data are expressed as fold change (2-DDCt) relative to housekeeping gene Gapdh. Samples were measured in duplicates (n=5-7 per group). Data are represented as mean+standard deviation. All data were analyzed for normality with Shapiro-Wilk test and equivalence of variance using Levene’s test. For samples with normal distribution, two-way ANOVA with Bonferroni’s multiple comparison test was performed (B, E, F, and G). When the samples did not show normal distribution, they were aligned in RANK transformation, and confirmed for normality. As the samples showed normal distribution, two-way ANOVA was performed with Bonferroni’s multiple comparison test (A, C, D, and H). Ctl: control (vehicle), ns: not significant, *P<0.05, **P<0.01, ***P<0.001.
Figure 7.
Figure 7.
Inhibition of fibroblast growth factor 23 (FGF23) signaling increases renal and extra-renal EPO and EpoR mRNA expression under lipopolysaccharide (LPS)-induced hypoferremia. C57BL/6J wild-type mice were treated with C-tail FGF23 (1 mg/kg, indicated as FGF23 BL) or vehicle (HEPES buffer) for 8 hours (h). Mice were then challenged with LPS (intraperitoneal 50 mg/kg) or vehicle (0.9% NaCl) for 4 h. (A-C) Quantitative real-time polymerase chain reaction (qRT-PCR) for renal expression of (A) Epo, (B) EpoR, and (C) Hif2α. (D) Serum concentration of Epo measured by ELISA. (E-H) qRT-PCR for Epo expression in (E) spleen and (F) liver, and EpoR expression in (G) spleen and (H) liver. Data are expressed as fold change (2-DDCt) relative to housekeeping genes Gapdh or Hprt. Samples were measured in duplicates (n=5-7 per group). Data are represented as mean+standard deviation. All data were analyzed for normality by Shapiro-Wilk test and equivalence of variance using Levene’s test. When the samples did not show normal distribution, they were aligned in RANK transformation, and confirmed for normality. As the samples showed normal distribution, two-way ANOVA was performed with Bonferroni’s multiple comparison test (B, F, and H). The samples not in normal distribution were analyzed with non-parametric Kruskal-Wallis test (A, C-E, and G). Ctl: control (vehicle), ns: not significant, *P<0.05, **P<0.01, ***P<0.001.

Comment in

References

    1. Gozzelino R, Arosio P. Iron homeostasis in health and disease. Int J Mol Sci. 2016;17(1). - PMC - PubMed
    1. Layoun A, Huang H, Calve A, Santos MM. Toll-like receptor signal adaptor protein MyD88 is required for sustained endotoxin- induced acute hypoferremic response in mice. Am J Pathol. 2012;180(6):2340-2350. - PubMed
    1. Schmidt PJ. Regulation of iron metabolism by hepcidin under conditions of inflammation. J Biol Chem. 2015;290(31):18975-18983. - PMC - PubMed
    1. Ganz T. Hepcidin, a key regulator of iron metabolism and mediator of anemia of inflammation. Blood. 2003;102(3):783-788. - PubMed
    1. Kemna E, Pickkers P, Nemeth E, van der Hoeven H, Swinkels D. Time-course analysis of hepcidin, serum iron, and plasma cytokine levels in humans injected with LPS. Blood. 2005;106(5):1864-1866. - PubMed

Publication types