. 2020 Mar 20;367(6484):eaay5012.
doi: 10.1126/science.aay5012.

Insights into human genetic variation and population history from 929 diverse genomes

Affiliations

Insights into human genetic variation and population history from 929 diverse genomes

Anders Bergström et al. Science. .

Abstract

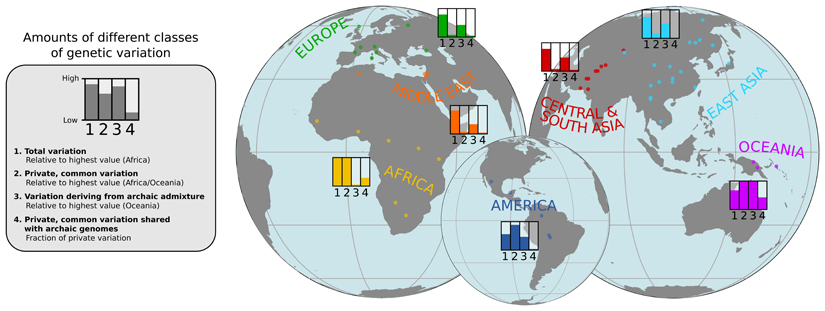
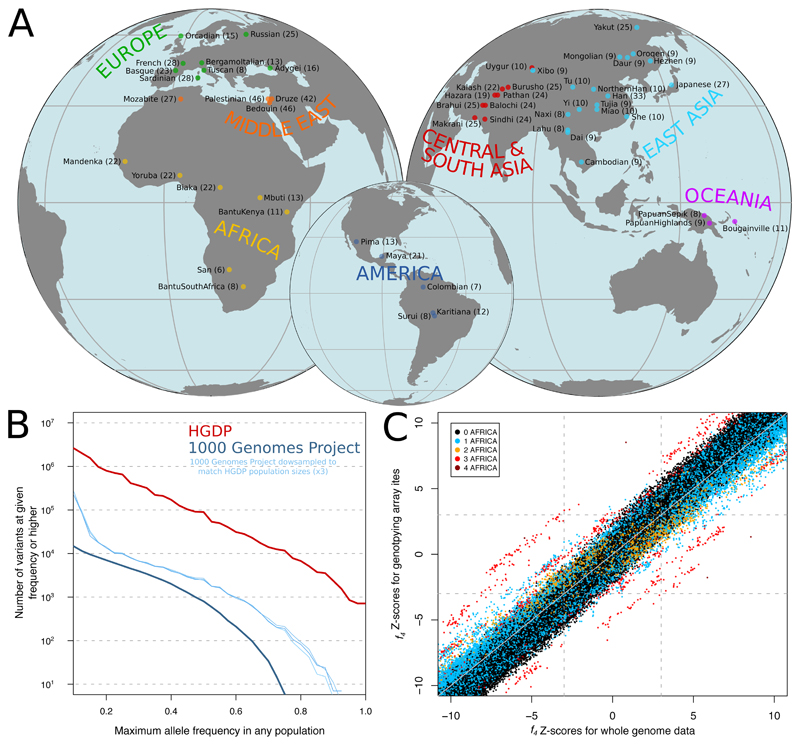
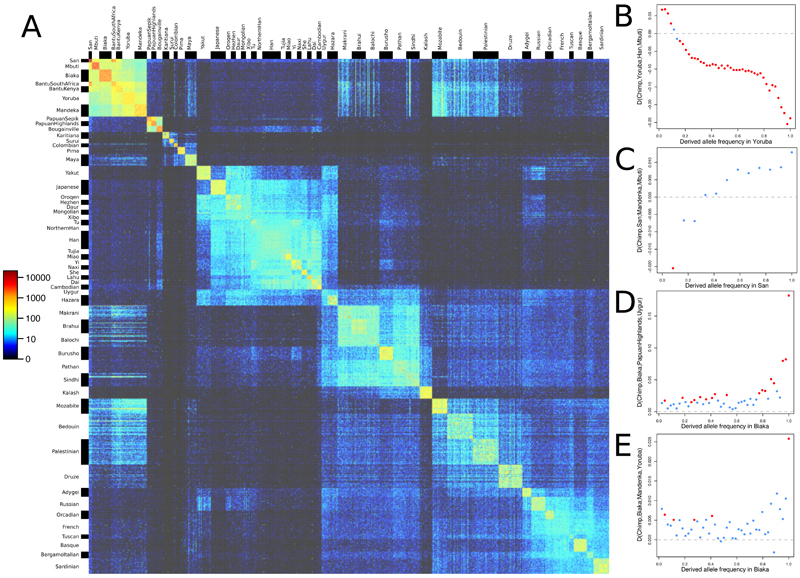
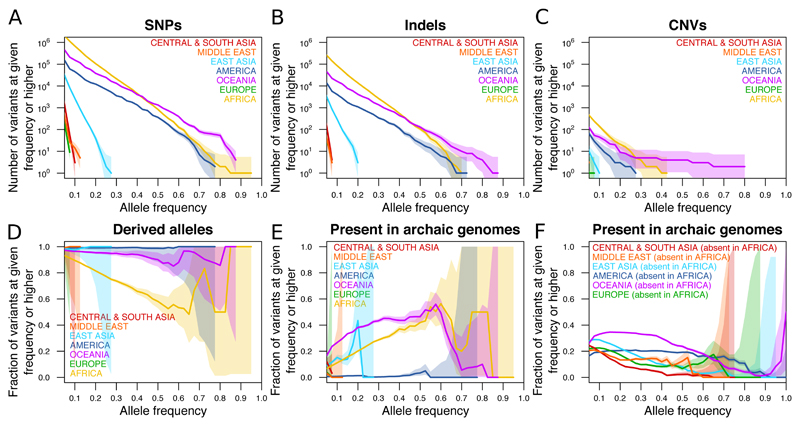
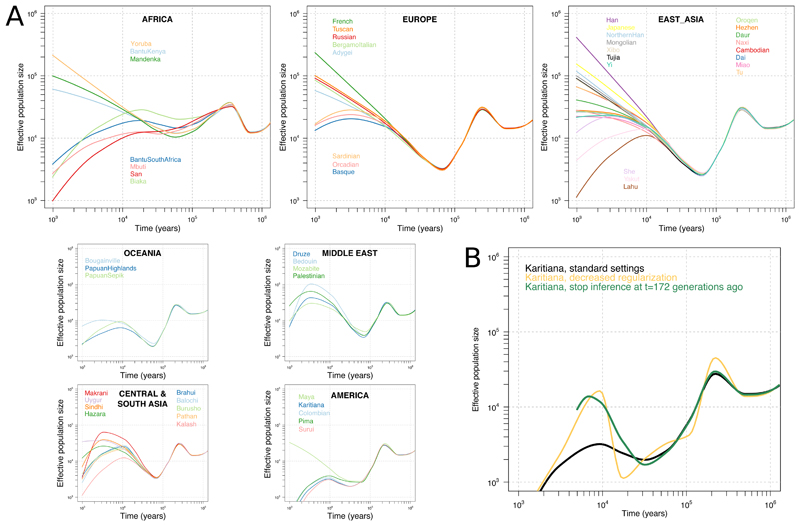
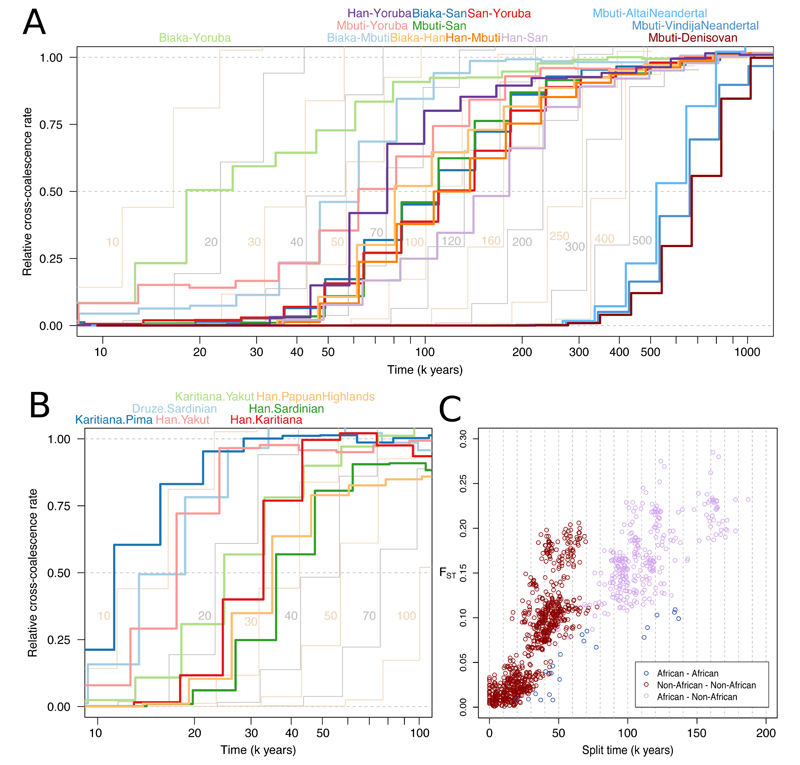
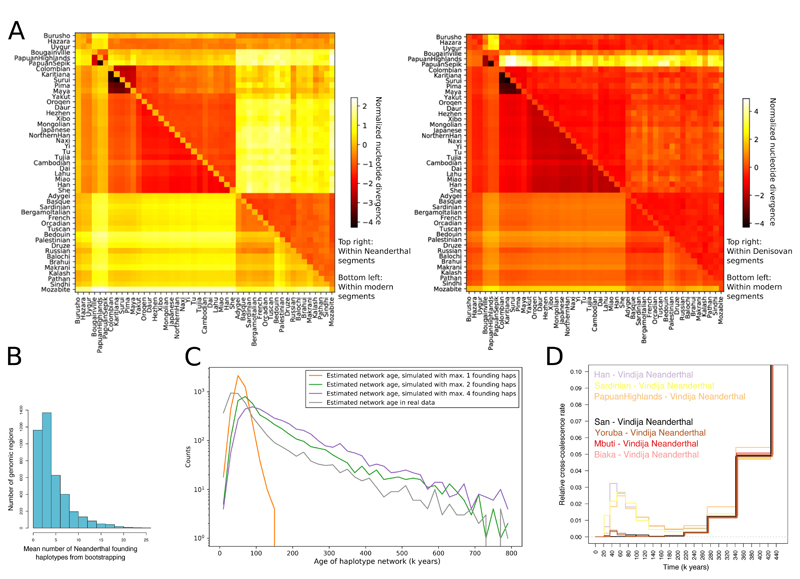
Genome sequences from diverse human groups are needed to understand the structure of genetic variation in our species and the history of, and relationships between, different populations. We present 929 high-coverage genome sequences from 54 diverse human populations, 26 of which are physically phased using linked-read sequencing. Analyses of these genomes reveal an excess of previously undocumented common genetic variation private to southern Africa, central Africa, Oceania, and the Americas, but an absence of such variants fixed between major geographical regions. We also find deep and gradual population separations within Africa, contrasting population size histories between hunter-gatherer and agriculturalist groups in the past 10,000 years, and a contrast between single Neanderthal but multiple Denisovan source populations contributing to present-day human populations.


Figures

None
The structure of genetic variation across worldwide human populations.
A schematic illustration of the approximate amounts of four different classes of genetic variation found in different geographical regions. The origins of the populations included in the study are indicated by dots.
Figure 1
Figure 1. Genome sequencing and variant discovery in 54 diverse human populations.
(A) Geographical origins of the 54 populations from the HGDP-CEPH panel, with the number of sequenced individuals from each in parentheses. (B) Maximum allele frequencies of variants discovered in the HGDP dataset but not in the 1000 Genomes phase 3 dataset, and vice versa. The vertical axis displays the number of variants that have a maximum allele frequency in any single population equal to or higher than the corresponding value on the horizontal axis. To account for higher sampling noise due to smaller population sample sizes in the HGDP dataset, results obtained on versions of the 1000 Genomes dataset down-sampled to match the HGDP sizes are also shown. To conservatively avoid counting variants that are actually present in both datasets but not called in one of them for technical reasons, any variant with a global frequency of >30% in a dataset is excluded. (C) Comparison of Z-scores from all possible f4-statistics involving the 54 populations using whole genome sequences and commonly used, ascertained genotyping array sites (8). Points are coloured according to the number of African populations included in the statistic.
Figure 2
Figure 2. Insights into population relationships from low-frequency variants.
(A) A heatmap of pairwise counts of doubleton alleles (alleles observed exactly twice across the dataset) between all 929 individuals, grouped by population. (B-D) D-statistics of the form D(Chimp,X;A,B), stratified by the derived allele frequency in X. Red points correspond to |Z| > 3.
Figure 3
Figure 3. Counts and properties of geographically private variants.
(A-C) Counts of region-specific variants. The vertical axis displays the number of variants private to a given geographical region that have an allele frequency in that region equal to or higher than the corresponding value on the horizontal axis. Shaded areas denote 95% Poisson confidence intervals. (A) SNPs. (B) Indels. (C) CNVs. (D) The fraction of SNPs private to a given region and at a frequency equal to or higher than the corresponding value on the horizontal axis for which the private allele is the derived as opposed to ancestral state. (E) The fraction of SNPs private to a given region and at a frequency equal to or higher than the corresponding value on the horizontal axis for which the private allele is observed in any of three high-coverage archaic genomes. (F) As E, but now counting variants that are present in the given region and absent in Africa, regardless of their frequency elsewhere.
Figure 4
Figure 4. Effective population size histories of 54 diverse populations.
(A) Effective population sizes for all populations inferred using SMC++, computed using composite likelihoods across six different distinguished individuals per population. Our ability to infer recent size histories in some South Asian and Middle Eastern populations might be confounded by the effects of recent endogamy. (B) Results for the Native American Karitiana population with varying SMC++ parameter settings. Decreasing the regularization or excluding the last few thousand years from the time period of inference leads to curves displaying massive growth approximately in the period 10 to 20 kya.
Figure 5
Figure 5. The time depth and mode of population separations.
(A) MSMC2 cross-population results for pairs of African populations, including Han Chinese as a representative of non-Africans, as well as between archaic populations and Mbuti as a representative of modern humans. Curves between modern human groups were computed using four physically phased haplotypes per population, while curves between modern and archaic groups were computed using two haplotypes per population and unphased archaic genomes. The results of simulated histories with instantaneous separations at different time points are displayed in the background in alternating yellow and grey curves. (B) MSMC2 cross-population results, as in A, for pairs of non-African populations. (C) Split times estimated under simple, sudden pairwise split models using momi2 for all possible pairs among the 54 populations against FST, a measure of allele frequency differentiation. The plot does not include Native American populations, as we could not obtain reliable momi2 fits for these.
Figure 6
Figure 6. Archaic haplotypes in modern human populations.
(A) Nucleotide divergence DXY within segments deriving from archaic admixture and within other segments in non-African populations. (B) The mean number of archaic founding haplotypes estimated by constructing maximum likelihood trees for each archaic segment identified in present-day non-Africans, and then determining the number of ancestral branches in the tree at the approximate time of admixture (2000 generations ago). (C) The distribution of estimated ages of archaic haplotype networks in the present-day human population. The distribution is compared to results obtained in simulations performed with different numbers of archaic founding haplotypes. (D) MSMC2 cross-population results for African (two individual curves per population) and selected non-African (one individual curve per population) against the Vindija Neanderthal, zooming in on the signal of Neanderthal genome flow in modern human genomes (note the highly reduced range of the vertical axis).

Comment in

  • Diverse human genomes.
    Clyde D. Clyde D. Nat Rev Genet. 2020 Jun;21(6):338. doi: 10.1038/s41576-020-0235-y. Nat Rev Genet. 2020. PMID: 32269330 No abstract available.

Similar articles

Cited by

References

    1. Nielsen R, et al. Tracing the peopling of the world through genomics. Nature. 2017;541:302–310. - PMC - PubMed
    1. 1000 Genomes Project Consortium. A global reference for human genetic variation. Nature. 2015;526:68–74. - PMC - PubMed
    1. Mallick S, et al. The Simons Genome Diversity Project: 300 genomes from 142 diverse populations. Nature. 2016;538:201–206. - PMC - PubMed
    1. Pagani L, et al. Genomic analyses inform on migration events during the peopling of Eurasia. Nature. 2016;538:238–242. - PMC - PubMed
    1. Cann HM, et al. A human genome diversity cell line panel. Science. 2002;296:261–262. - PubMed

Publication types