. 2020 Apr 3;368(6486):54-60.
doi: 10.1126/science.aay2494. Epub 2020 Mar 19.

Endoplasmic reticulum-associated degradation regulates mitochondrial dynamics in brown adipocytes

Affiliations

Endoplasmic reticulum-associated degradation regulates mitochondrial dynamics in brown adipocytes

Zhangsen Zhou et al. Science. .

Abstract

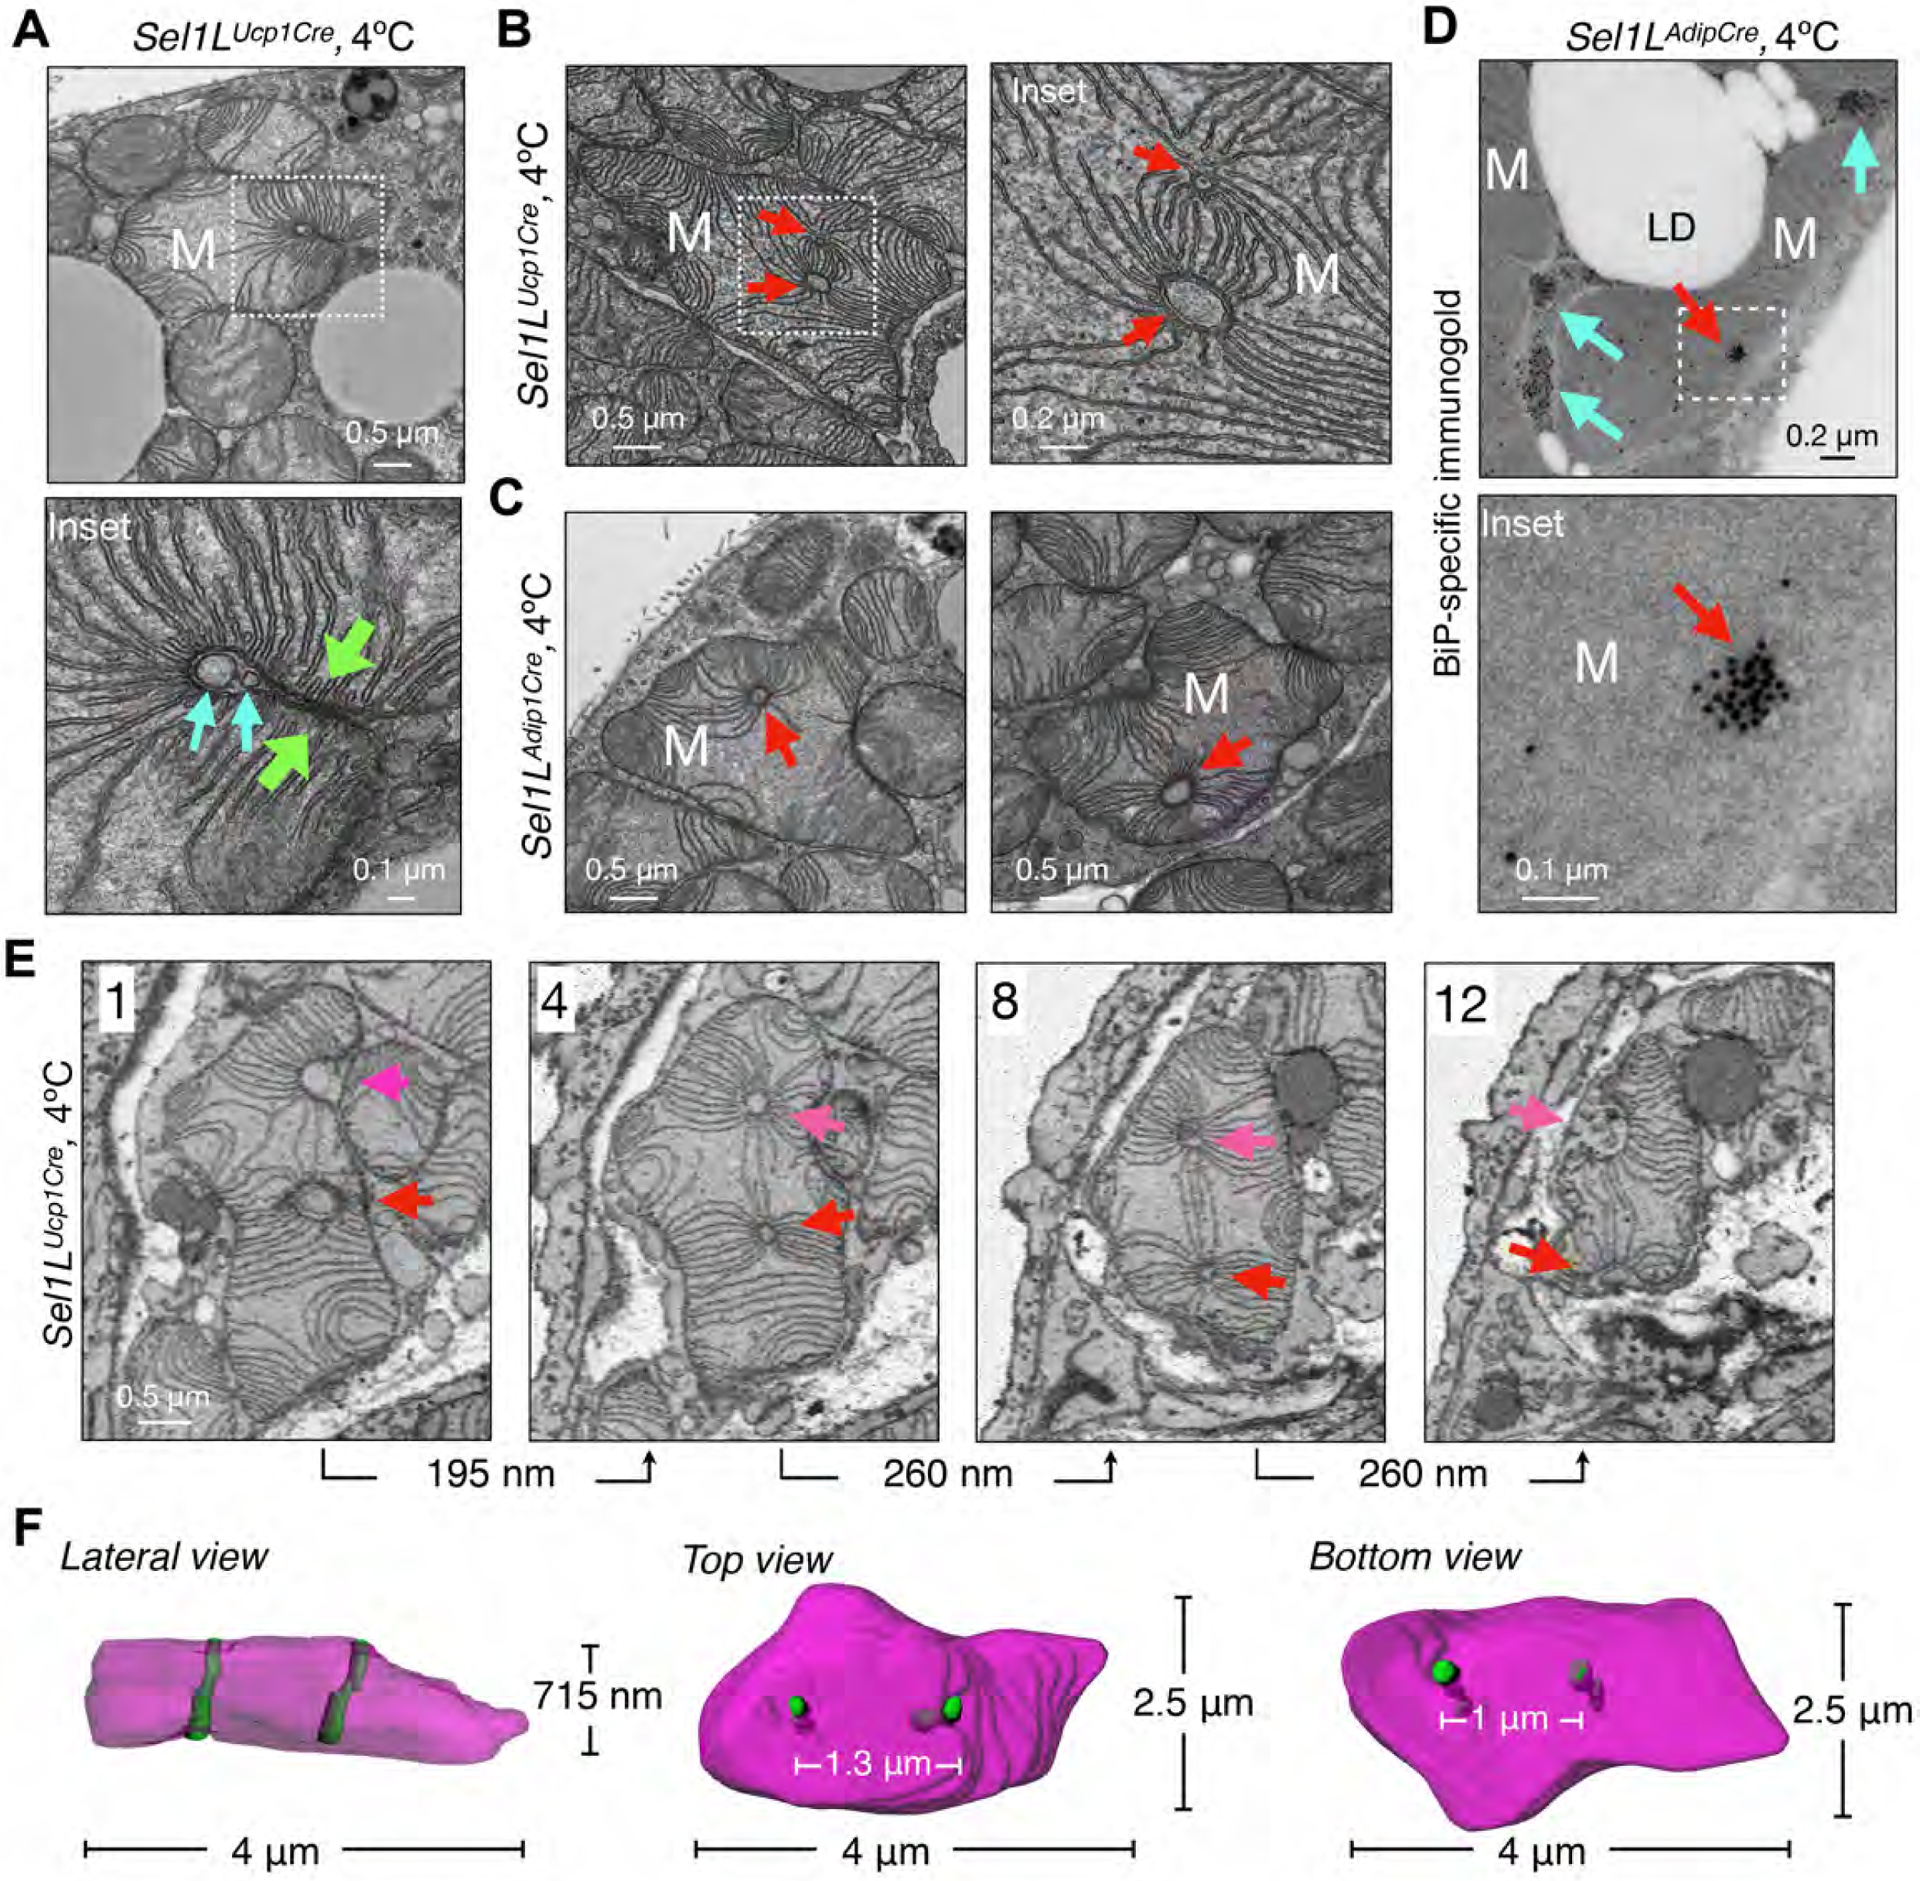
The endoplasmic reticulum (ER) engages mitochondria at specialized ER domains known as mitochondria-associated membranes (MAMs). Here, we used three-dimensional high-resolution imaging to investigate the formation of pleomorphic "megamitochondria" with altered MAMs in brown adipocytes lacking the Sel1L-Hrd1 protein complex of ER-associated protein degradation (ERAD). Mice with ERAD deficiency in brown adipocytes were cold sensitive and exhibited mitochondrial dysfunction. ERAD deficiency affected ER-mitochondria contacts and mitochondrial dynamics, at least in part, by regulating the turnover of the MAM protein, sigma receptor 1 (SigmaR1). Thus, our study provides molecular insights into ER-mitochondrial cross-talk and expands our understanding of the physiological importance of Sel1L-Hrd1 ERAD.


Conflict of interest statement

Competing interests:

The authors declare no conflict of interest.

Figures

Figure 1.
Figure 1.. Sel1L regulates mitochondrial morphology in BAT during cold exposure.
(A-C) Representative TEM images of BAT from Sel1Lf/f (A) and Sel1LAdipCre mice (B) at 22°C (left) or 4°C (right) for 6 hr, with quantitation of mitochondrial size shown in C (n=870, 601 mitochondria from 3 Sel1Lf/f mice each at 22°C and 4°C; 624, 821 from 3 Sel1LAdipCre mice each at 22°C and 4°C, one-way ANOVA). Yellow arrows, megamitochondria. M, mitochondrion; LD, lipid droplet. (D-E) Representative TEM images of BAT from Sel1LUcp1Cre mice at 4°C for 6 hr, with quantitation of mitochondrial size shown in E (n=676, 618 mitochondria for 3 Sel1Lf/f mice each at 22°C and 4°C; 582, 674 for 3 Sel1LUcp1Cre mice each at 22°C and 4°C, one-way ANOVA). (F-H) Representative SBF-SEM images (F) and 3D reconstruction (G) of mitochondria from BAT of Sel1Lf/f and Sel1LUcp1Cre mice at 4°C for 6 hr. Mitochondria in pseudo colors were reconstructed from a set of 150 SBF-SEM image stacks (65 nm/slice). (H) Quantitation of 3D volume of mitochondria (n=61 and 63, Sel1Lf/f and Sel1LUcp1Cre mice, Student’s t-test). All experiments have been repeated three times. Data are mean ± SEM. *, p< 0.05; **, p< 0.01; ***, p< 0.001; n.s., not significant.
Figure 2.
Figure 2.. Sel1L controls ER-mitochondria contacts in cold-stimulated brown adipocytes.
(A-B) Representative TEM images of BAT from Sel1Lf/f (A) and Sel1LUcp1Cre (B) mice at 4°C for 6 hr. M, mitochondrion; Cyan arrows, MAMs; red lines, mitochondrial membranes; the ER, green. (C-E) Representative TEM images of the MAMs in BAT from Sel1Lf/f and Sel1LUcp1Cre mice at 4°C for 6 hr, with quantitation of ER-mitochondrion distance (D) and abundance of MAM per mitochondrion (E). n=35 and 40 MAMs (D) and n=450 and 572 mitochondria (E) for Sel1Lf/f and Sel1LUcp1Cre. (F) Representative TEM images of BiP-specific immunogold labeling in BAT from Sel1LAdipCre mice at 4°C for 6 hr. Red dotted line outlines one megamitochondrion; cyan arrows, BiP-positive ER tubule(s). (G) Representative FIB-SEM (left) and the 3D tomography images (300 and 170 slices, 5 nm/slice) of mitochondria in BAT from Sel1Lf/f and Sel1LUcp1Cre mice at 4°C for 6 hr. Magenta, mitochondria; green, ER. Cyan arrows, MAMs; orange arrows, MAMs going through the concave surface of a mitochondrion. All experiments have been repeated two to three times. Data are mean ± SEM. ***, p< 0.001 by Student’s t-test.
Figure 3.
Figure 3.. Sel1L deficiency leads to the formation of megamitochondria with perforating ER tubules.
(A) Representative TEM images of BAT in Sel1LUcp1Cre mice housed at 4°C for 6 hr, showing a megamitochondrion wrapping around the tubular structures (cyan arrows). Green arrows, two opposite sides of a mitochondrion. (B-C) Representative TEM images of BAT from Sel1LUcp1Cre (B) and Sel1LAdipCre (C) mice at 4°C for 6 hr, showing megamitochondria with tubular structures (red arrows). (D) Representative BiP-immunogold TEM images of BAT in Sel1LAdipCre mice at 4°C for 6 hr. Red and cyan arrows, mitochondria-perforating ER tubules and peri-mitochondria ER tubules. (E-F) Representative SBF-SEM images (E) and 3D reconstruction (F) in BAT of Sel1LUcp1Cre mice at 4°C for 6 hr, showing four different slices of a megamitochondrion with two parallel perforating ER tubules (red and magenta arrows). All 12 slices (65 nm/slice) are shown in Fig. S8. All experiments have been repeated two to three times.
Figure 4.
Figure 4.. Sel1L in brown adipocytes regulates mitochondrial function and cold-induced thermogenesis.
(A-B) Oxygen consumption rate (OCR) of purified mitochondria from BAT of cold-exposed mice (A) and differentiated brown adipocytes (B) with the addition of various stimuli as indicated. NE, norepinephrine; Oligo, oligomycin; Pyr/Mal, pyruvate/malate; FCCP, carbonyl cyanide p-trifluoromethoxyphenylhydrazone; Anti, antimycin; Rot, Rotenone. (C) Metaboanalyst pathway enrichment analysis for the metabolites in Sel1Lf/f and Sel1L−/− brown adipocytes treated with 1 μM NE for 1 hr (n=3/group). (D) Rectal temperature of 8- to 10- week-old mice housed at 22°C or 4°C for 6 hr (n=7–10 mice each, one-way ANOVA). (E-F) Representative H&E (E) and Perilipin1 (F) staining of BAT from Sel1Lf/f and Sel1LAdipCre mice housed at 22°C or 4°C for 6 hr. All experiments have been repeated three times except panel C (3 samples per group). Data are mean ± SEM. ***, p< 0.001.
Figure 5.
Figure 5.. Hrd1, but not Ire1α of UPR, controls mitochondrial morphology and thermogenesis in brown adipocytes.
(A) Rectal temperature of 8- to 10- week-old Hrd1f/f and Hrd1Ucp1Cre mice housed at 22°C or 4°C for 6 hr, n=4/group (one-way ANOVA). (B-D) Representative TEM images of BAT from Hrd1f/f and Hrd1Ucp1Cre mice housed at 22°C or 4°C for 6 hr with quantitation shown in C. n= 543, 581 mitochondria for 22°C and 4°C, Student’s t-test. Yellow arrows, megamitochondria; red arrows, ER tubules within mitochondrial profiles. (E) RT-PCR analysis of Xbp1 mRNA splicing in BAT at 22°C or 4°C for 6 hr with quantitation of the ratio of spliced Xbp1 (s) to total Xbp1 (spliced + unspliced (u)) shown below the gel (n = 6 mice per group). BAT from wildtype mice injected with vehicle or tunicamycin (Tuni, 1 mg/kg) included as controls. (F-G) Representative TEM pictures of BAT from Ire1aAdipCre mice at 4°C for 6 hr with quantitation shown in G (n=500, 665 from 2 mice each, Student’s t-test). All experiments have been repeated two to three times. Data are mean ± SEM. **, p< 0.01; ***, p< 0.001.
Figure 6.
Figure 6.. Sel1L-Hrd1 ERAD regulates MAM and mitochondrial dynamics via SigmaR1.
(A) Immunoblot analysis of mitochondrial dynamic proteins in BAT from Sel1Lf/f and Sel1LAdipCre mice at 22°C or 4°C for 6 hr with quantitation of phos-/total Drp1 and large (L)-/small (S)-Opa1 shown below the gel (n = 7 per group). (B) Immunoblot analysis of MAM proteins in BAT of Sel1Lf/f and Sel1LAdipCre mice with quantitation of SigmaR1/Hsp90 shown below the gel (n = 7 per group). (C) Immunoblot analysis of endogenous SigmaR1 in WT and Hrd1-deficient (Hrd1−/−) HEK293T cells with or without CHX and MG132 treatment. (D) Immunoblot analysis of GFP or endogenous SigmaR1 immunoprecipitates in HEK293T (with or without MG132 treatment), showing Hrd1-mediated SigmaR1 ubiquitination. (E) Immunoblot analysis of Flag immunoprecipitates in HEK293T cells transfected with a combination of plasmids, showing a dose-dependent interaction between SigmaR1-Flag and Mfn2-EGFP. (F) Immunoblot analysis of Mfn2 oligomers or -containing high molecular weight (HMW) complexes in brown adipocytes treated with or without NE (1 μM, 1 hr) in blue native (BN)-PAGE and regular SDS-PAGE. (G-H) Representative images of mito-DsRed- and mEmerald-Sec61b- expressing pre-adipocytes. DAPI (blue) with quantitation of ER-mitochondrial colocalization using Manders’ overlap coefficient (50 cells each) shown in H, one-way ANOVA. (I-J) Confocal images showing the spread and decay of mitochondria-targeted photoactivated GFP (mito-PAGFP) in brown adipocytes 60 min following NE stimulation and photoactivation. Active mitochondrial were stained with TMRE (red). Quantitation of changes of GFP signal intensity over time shown in J. (n=13, 15, and 10 for Sel1Lf/f, Sel1L−/− and Sel1L−/−;SigmaR1−/−, one-way ANOVA). All were repeated two to three times. Data are mean ± SEM. **, p< 0.01; ***, p< 0.001.

References

    1. Wu H, Carvalho P, Voeltz GK, Here, there, and everywhere: The importance of ER membrane contact sites. Science 361, (2018). - PMC - PubMed
    1. Rowland AA, Voeltz GK, Endoplasmic reticulum-mitochondria contacts: function of the junction. Nat Rev Mol Cell Biol 13, 607–625 (2012). - PMC - PubMed
    1. Kornmann B et al., An ER-mitochondria tethering complex revealed by a synthetic biology screen. Science 325, 477–481 (2009). - PMC - PubMed
    1. Csordas G et al., Structural and functional features and significance of the physical linkage between ER and mitochondria. J Cell Biol 174, 915–921 (2006). - PMC - PubMed
    1. Friedman JR et al., ER tubules mark sites of mitochondrial division. Science 334, 358–362 (2011). - PMC - PubMed

Publication types

MeSH terms

Substances