. 2020 Mar 19;11(1):1465.
doi: 10.1038/s41467-020-15291-z.

FAM13A affects body fat distribution and adipocyte function

Affiliations

FAM13A affects body fat distribution and adipocyte function

Mohsen Fathzadeh et al. Nat Commun. .

Abstract

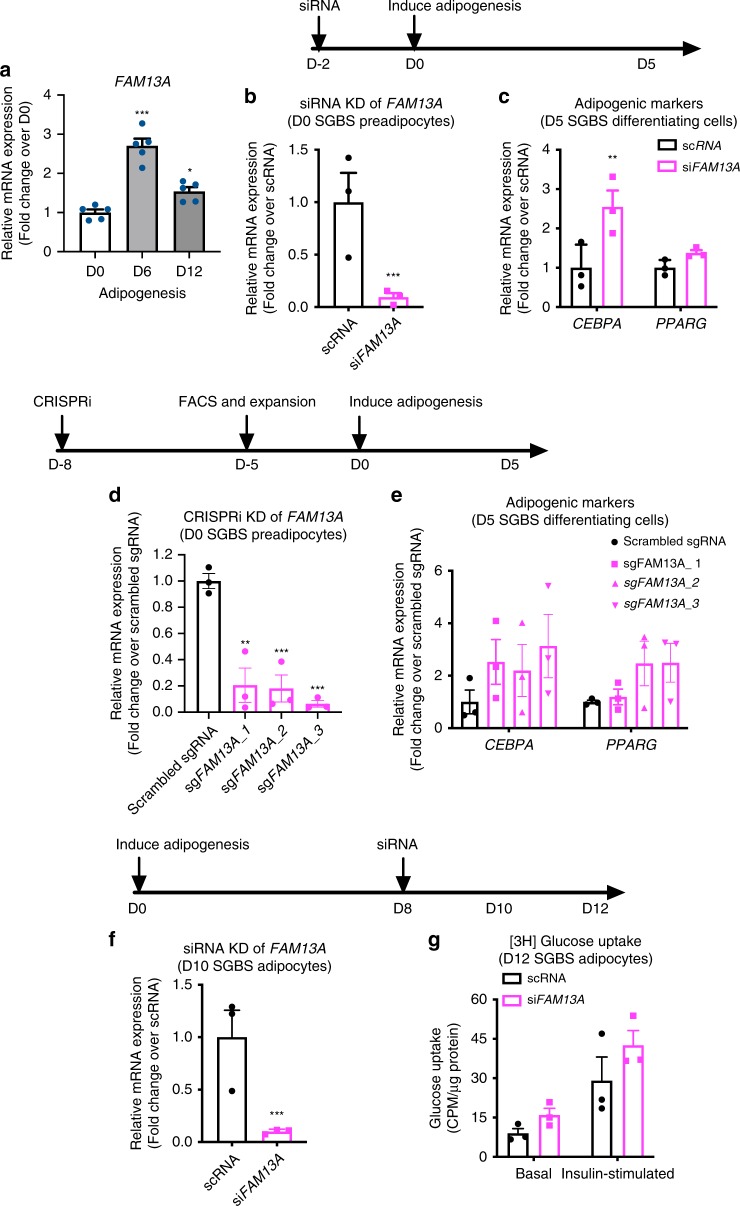
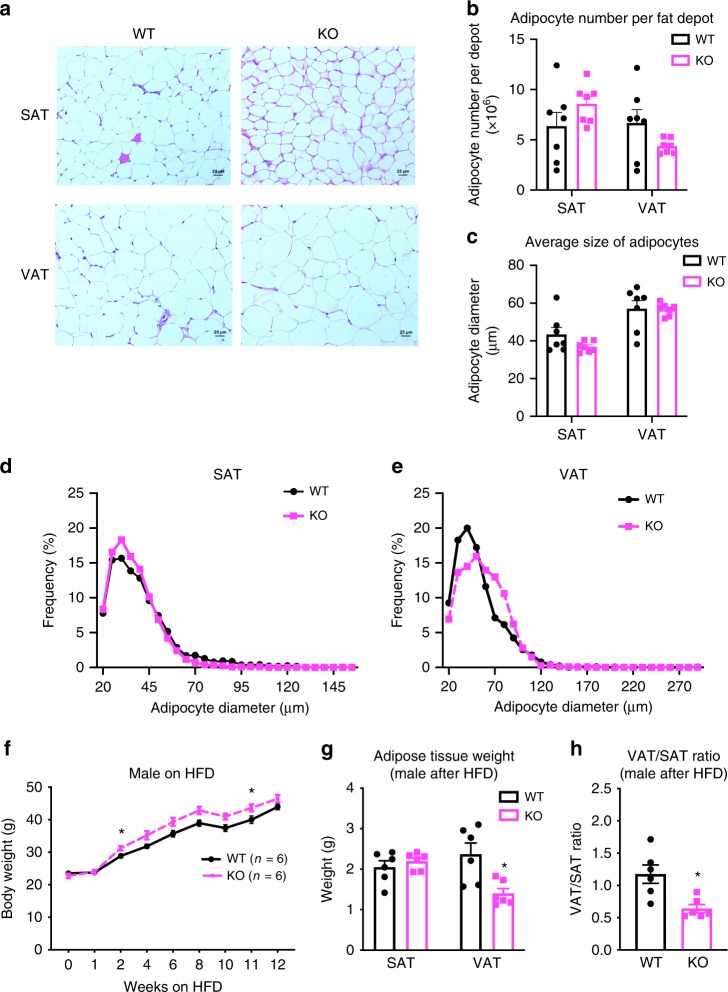
Genetic variation in the FAM13A (Family with Sequence Similarity 13 Member A) locus has been associated with several glycemic and metabolic traits in genome-wide association studies (GWAS). Here, we demonstrate that in humans, FAM13A alleles are associated with increased FAM13A expression in subcutaneous adipose tissue (SAT) and an insulin resistance-related phenotype (e.g. higher waist-to-hip ratio and fasting insulin levels, but lower body fat). In human adipocyte models, knockdown of FAM13A in preadipocytes accelerates adipocyte differentiation. In mice, Fam13a knockout (KO) have a lower visceral to subcutaneous fat (VAT/SAT) ratio after high-fat diet challenge, in comparison to their wild-type counterparts. Subcutaneous adipocytes in KO mice show a size distribution shift toward an increased number of smaller adipocytes, along with an improved adipogenic potential. Our results indicate that GWAS-associated variants within the FAM13A locus alter adipose FAM13A expression, which in turn, regulates adipocyte differentiation and contribute to changes in body fat distribution.


Conflict of interest statement

At the time the work was performed, Myung Kyun Shin, Cliona M Molony and Dermot Reilly were Merck employees.

Figures

Fig. 1
Fig. 1. Regulatory variants within the FAM13A locus are associated with several IR traits.
Intronic non-coding variants in the FAM13A locus show associations with several IR-related and metabolic traits, including body fat percentage (a), and fasting insulin (b) and waist-hip ratio (c) (adjusted for BMI) across cohorts and studies. These GWAS association signals colocalize with FAM13A eQTL association signal in subcutaneous adipose tissue (from GTEx v7, d). However, this association is not robust in visceral adipose tissue (e). f The variants show evidence of enrichment in a regulatory active H3K27ac region in adipose nuclei. Annotations from pancreas and lung are shown as negative comparators.
Fig. 2
Fig. 2. PheWAS analysis of FAM13A variants.
a Phenome-wide association analysis of the variant rs1377290 (used as a proxy for finemapping lead variant rs9991328, LD R2 1.0) performed in ~337 K individuals in the U.K. Biobank shows associations with metabolically related phenotypes, including body fat and trunk fat percentage. Associations significant at 10% FDR are labeled. b In male subjects in the METSIM cohort, normalized FAM13A expression in subcutaneous adipose tissue (adjusted for BMI) shows a positive correlation with fasting insulin and waist-hip-ratio, but a negative correlation with bioimpedance measured fat percentage. Two-sided t-tests were used in cis-eQTL mapping.
Fig. 3
Fig. 3. Effects of FAM13A knockdown in human adipocyte differentiation.
a FAM13A mRNA expression during adipogenesis of human SGBS preadipocytes. b mRNA expression of FAM13A, measured 2 days after siRNA transfection and before initiation of adipogenesis. c mRNA expression of adipogenic markers (CEBPA, PPARG), measured 5 days after adipogenic induction in cells transfected with scrambled siRNA or siFAM13A. d mRNA expression of FAM13A, measured 8 days after lentiviral infection and before initiation of adipogenesis. e mRNA expression of adipogenic markers (CEBPA, PPARG), measured 5 days after adipogenic induction in cells transduced with scrambled sgRNA or three independent sgRNAs against FAM13A. f mRNA expression of FAM13A, measured on D10 of adipogenesis and 2 days after siRNA transfection. g Basal and insulin-stimulated [3H] glucose uptake, measured on D12 differentiated adipocytes and 4 days after siRNA transfection. Data are presented as mean ± SEM. n = 3 independent experiments. *p < 0.05, **p < 0.01, ***p < 0.001, unpaired t test (for b and f), one-way ANOVA followed by Turkey’s multiple comparison test (for a and d), 2-way ANOVA followed by Sidak’s multiple comparison test (for c). Source Data are provided as a Source Data file.
Fig. 4
Fig. 4. Metabolic profiling of male Fam13a KO mice.
a Representative H&E images (×20 magnification) of VAT and SAT in 14 weeks old of male WT and Fam13a KO mice fed on chow. (n = 7 per group, ×20 magnification, scale bar = 25 μm). b, c Adipocyte number per SAT or VAT depot (b) and the average diameter of adipocytes in SAT or VAT (c), in 14-week-old male WT and Fam13a KO mice fed on chow. (n = 7 per group). d, e Adipocytes size distribution in SAT (d) or VAT (e) of 14 weeks old of male WT and Fam13a KO mice fed on chow. (n = 7 per group; 2000–2200 cells per animal were used for adipocyte diameter determination; statistical differences between WT and KO mice in adipocyte diameter distribution curve were estimated by Kolmogorov-Smirnov test, ns for both SAT and VAT). f Body weight of male WT and Fam13a KO mice fed on HFD from 8 weeks to 20 weeks old. (n = 6 per group). g Tissue mass of male WT and Fam13a KO mice after 14 weeks HFD. (n = 6 per group). h Ratio of VAT/SAT, based on tissue mass, in male WT and Fam13a KO mice after 14 weeks HFD. (n = 6 per group). All values are presented as mean ± SEM. *p < 0.05, unpaired t-test. Source Data are provided as a Source Data file.
Fig. 5
Fig. 5. Effect of Fam13a on adipocyte differentiation of mouse SVFs isolated from SAT.
a, b Fam13a (a) and Adipoq (b) mRNA expression, quantified by qRT-PCR, in freshly isolated SVF, primary mature adipocytes (floater), or during in vitro adipogenesis of cultured SVFs (D0, D4, and D10). (8-week-old male WT mice, n = 3 per group, n = 3 culture wells per animal) c mRNA expression of adipogenic markers (Pparg, Cebpa, Fabp4), measured by qRT-PCR during in vitro adipogenesis of cultured SVFs (D0, D4, D10). (8-week-old male WT or Fam13a KO mice when isolating SVFs, n = 6 per group, n = 3 culture wells per animal). d, e Oil-Red O staining of lipid droplets (d) and semi-quantification (e) in D10 differentiated adipocytes from SVFs. (n = 6 per group, pictures represent n = 6 independent experiments, n = 3 cultures/animal, ×10 magnification, scale bar=100 μm). f Intracellular triglyceride content in D10 differentiated adipocytes from SVFs. (n = 6 per group, n = 3 culture wells per animal). g Basal and insulin-stimulated [3H] glucose uptake in D10 differentiated adipocytes from SVFs. (n = 3 per group, n = 3 culture wells per animal). h Basal and insulin-stimulated [3H] glucose uptake in SAT explants. (8-week-old male mice, n = 3 per group, n = 3 ex vivo cultures per animal). Data are presented as mean ± SEM. *p < 0.05, **p < 0.01, ***p < 0.001, one-way ANOVA followed by Turkey’s multiple comparison test. Source Data are provided as a Source Data file.
Fig. 6
Fig. 6. Transcriptome profiling of VAT and SAT in Fam13a KO and WT mice.
a Fam13a transcript per million (TPM) in VAT, SAT, and liver of male WT mice on chow and HFD. b The volcano plot showing the differentially expressed (DE) genes in VAT and SAT male Fam13a KO on chow and HFD. n = 4 per group. Data are presented as mean ± SEM. *p < 0.05, **p < 0.01, ***p < 0.001, unpaired t test. Source Data are provided as a Source Data file.

References

    1. Shungin D, et al. New genetic loci link adipose and insulin biology to body fat distribution. Nature. 2015;518:187–196. - PMC - PubMed
    1. Loos RJF, Kilpelainen TO. Genes that make you fat, but keep you healthy. J. Intern. Med. 2018;284:450–463. - PMC - PubMed
    1. Scott RA, et al. Large-scale association analyses identify new loci influencing glycemic traits and provide insight into the underlying biological pathways. Nat. Genet. 2012;44:991–1005. - PMC - PubMed
    1. Lotta LA, et al. Integrative genomic analysis implicates limited peripheral adipose storage capacity in the pathogenesis of human insulin resistance. Nat. Genet. 2017;49:17–26. - PMC - PubMed
    1. Yaghootkar H, et al. Genetic evidence for a normal-weight “metabolically obese” phenotype linking insulin resistance, hypertension, coronary artery disease, and type 2 diabetes. Diabetes. 2014;63:4369–4377. - PMC - PubMed

Publication types

MeSH terms