. 2020 Mar 19;11(1):1467.
doi: 10.1038/s41467-020-15193-0.

Comprehensive genomic analysis of dietary habits in UK Biobank identifies hundreds of genetic associations

Affiliations

Comprehensive genomic analysis of dietary habits in UK Biobank identifies hundreds of genetic associations

Joanne B Cole et al. Nat Commun. .

Abstract

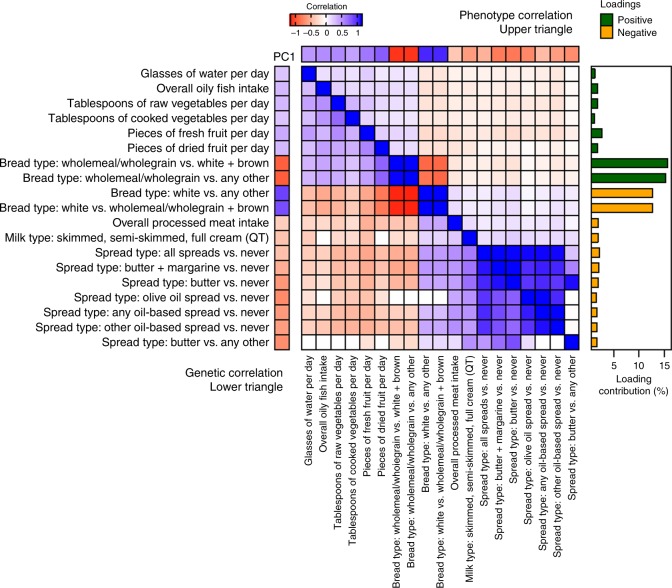
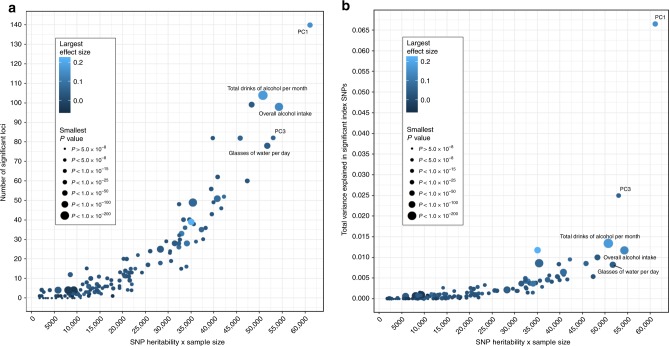
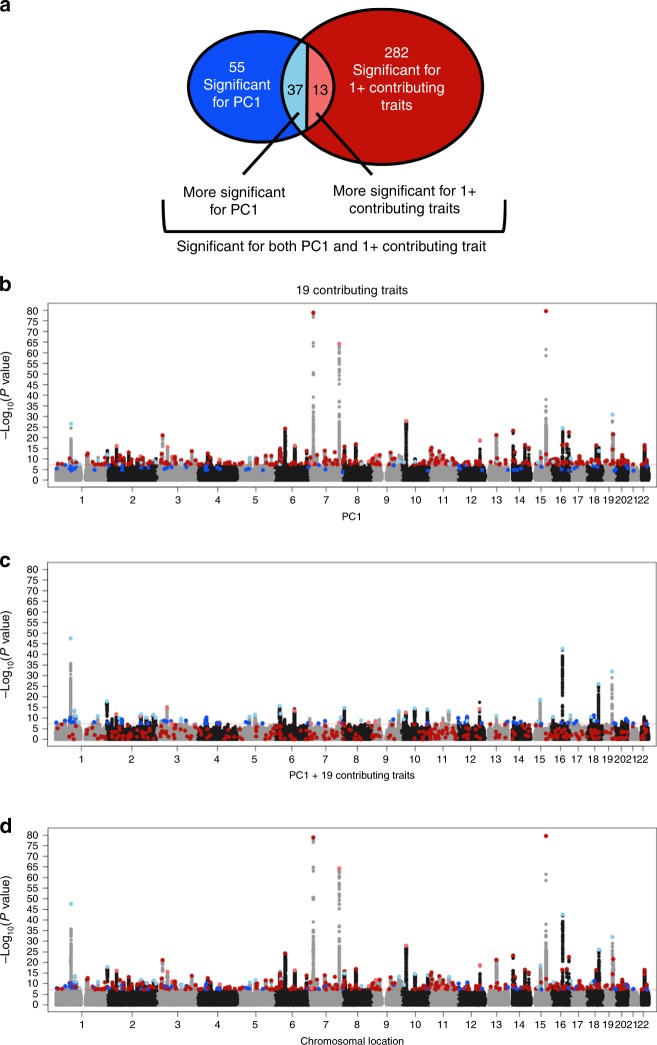
Unhealthful dietary habits are leading risk factors for life-altering diseases and mortality. Large-scale biobanks now enable genetic analysis of traits with modest heritability, such as diet. We perform a genomewide association on 85 single food intake and 85 principal component-derived dietary patterns from food frequency questionnaires in UK Biobank. We identify 814 associated loci, including olfactory receptor associations with fruit and tea intake; 136 associations are only identified using dietary patterns. Mendelian randomization suggests our top healthful dietary pattern driven by wholemeal vs. white bread consumption is causally influenced by factors correlated with education but is not strongly causal for coronary artery disease or type 2 diabetes. Overall, we demonstrate the value in complementary phenotyping approaches to complex dietary datasets, and the utility of genomic analysis to understand the relationships between diet and human health.


Conflict of interest statement

The authors declare no competing interests.

Figures

Fig. 1
Fig. 1. Relationships between PC1 and its 19 significantly contributing single food intake QT.
The heat map depicts the phenotypic (upper triangle) and genetic (lower triangle) correlation between the 19 significantly contributing single FI-QTs with each other and PC1. All correlations with nonsignificant P values (P > 0.05/85) were set to 0. Percent contribution of each of the 19 traits to PC1 is depicted in the correlation matrix bar plot annotation on the right, colored by loading direction.
Fig. 2
Fig. 2. Relationship between SNP heritability and GWAS success.
a Scatter plots of the number of genome-wide significant loci or b variance explained by genome-wide significant SNPs vs. SNP heritability × sample size for all 143 significantly heritable traits. Points are colored by the largest effect size and sized by the smallest P value of their significant index SNPs.
Fig. 3
Fig. 3. Manhattan plot of PC1 and its 19 significantly contributing single food intake QT.
a Schematic depiction of four groups of significant loci (and corresponding b, c Manhattan plot colors) for various combinations of PC1 and its 19 contributing traits. Fifty-five loci significant for PC1 only (dark blue), 282 loci significant for one or more of the 19 contributing FI-QTs only (dark red), 37 loci more significant for PC1 (light blue), and 13 loci more significant for one or more of the 19 FI-QTs (light red). b Combined Manhattan plot of the minimum P value across the 19 FI-QTs that significantly contribute to PC1. c Manhattan plot of PC1 only. d Combined Manhattan plot of the minimum P value across PC1 and the 19 FI-QTs.

References

    1. Lim SS, et al. A comparative risk assessment of burden of disease and injury attributable to 67 risk factors and risk factor clusters in 21 regions, 1990–2010: A systematic analysis for the Global Burden of Disease Study 2010. Lancet. 2012;380:2224–2260. doi: 10.1016/S0140-6736(12)61766-8. - DOI - PMC - PubMed
    1. US Burden of Disease Collaborators. The state of US health, 1990–2010: burden of diseases, injuries, and risk factors. JAMA. 2013;310:591–606. doi: 10.1001/jama.2013.13805. - DOI - PMC - PubMed
    1. Kelly T, Yang W, Chen CS, Reynolds K, He J. Global burden of obesity in 2005 and projections to 2030. Int. J. Obes. 2008;32:1431. doi: 10.1038/ijo.2008.102. - DOI - PubMed
    1. Boyle JP, Thompson TJ, Gregg EW, Barker LE, Williamson DF. Projection of the year 2050 burden of diabetes in the US adult population: dynamic modeling of incidence, mortality, and prediabetes prevalence. Popul. Health Metr. 2010;8:29. doi: 10.1186/1478-7954-8-29. - DOI - PMC - PubMed
    1. Reed DR, Bachmanov AA, Beauchamp GK, Tordoff MG, Price RA. Heritable variation in food preferences and their contribution to obesity. Behav. Genet. 1997;27:373–387. doi: 10.1023/A:1025692031673. - DOI - PMC - PubMed

Publication types

Substances