. 2020 Mar 19;10(1):5060.
doi: 10.1038/s41598-020-61911-5.

Theory of relaxor-ferroelectricity

Affiliations

Theory of relaxor-ferroelectricity

Li-Li Zhang et al. Sci Rep. .

Abstract

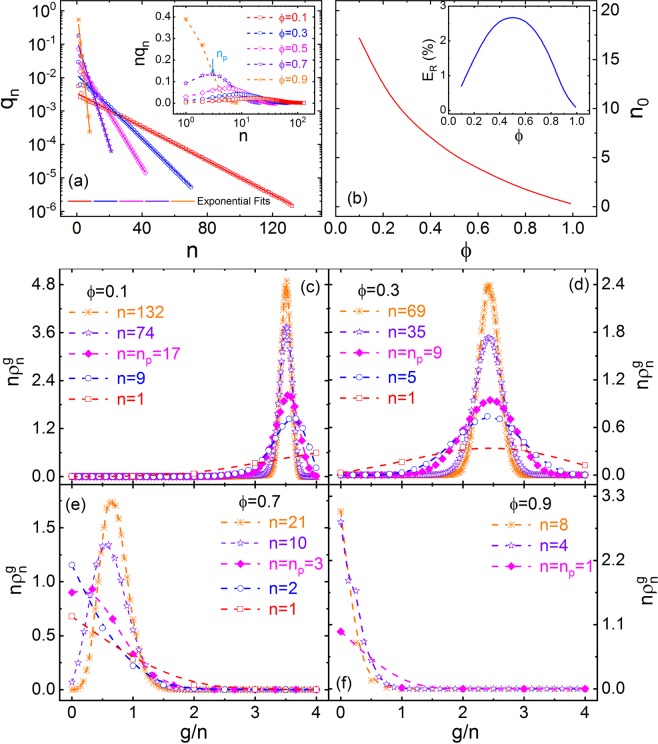
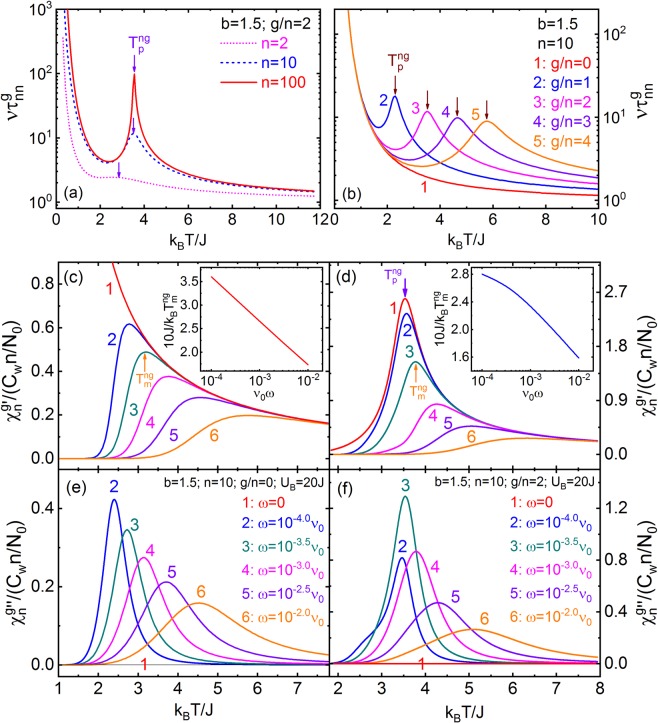
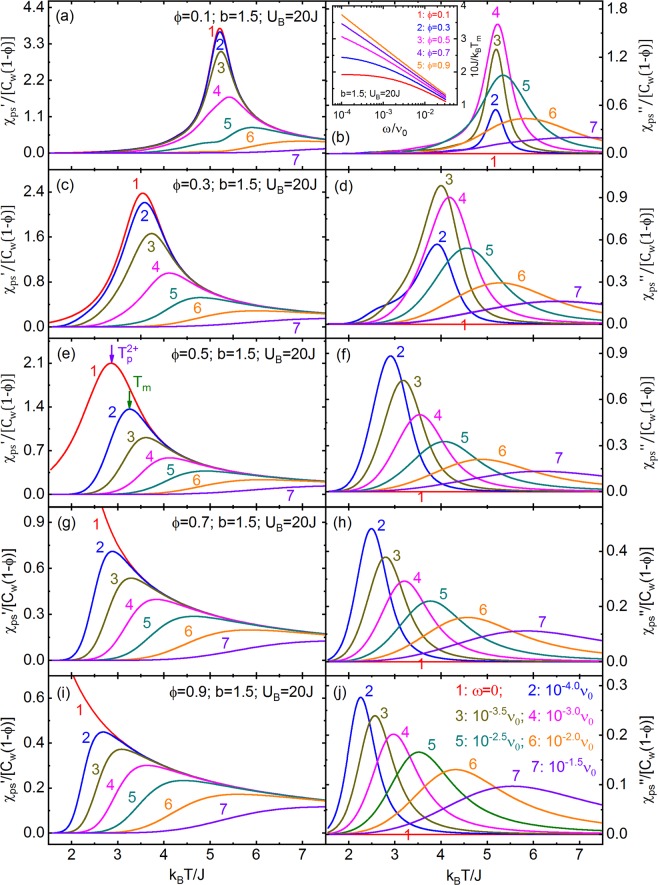
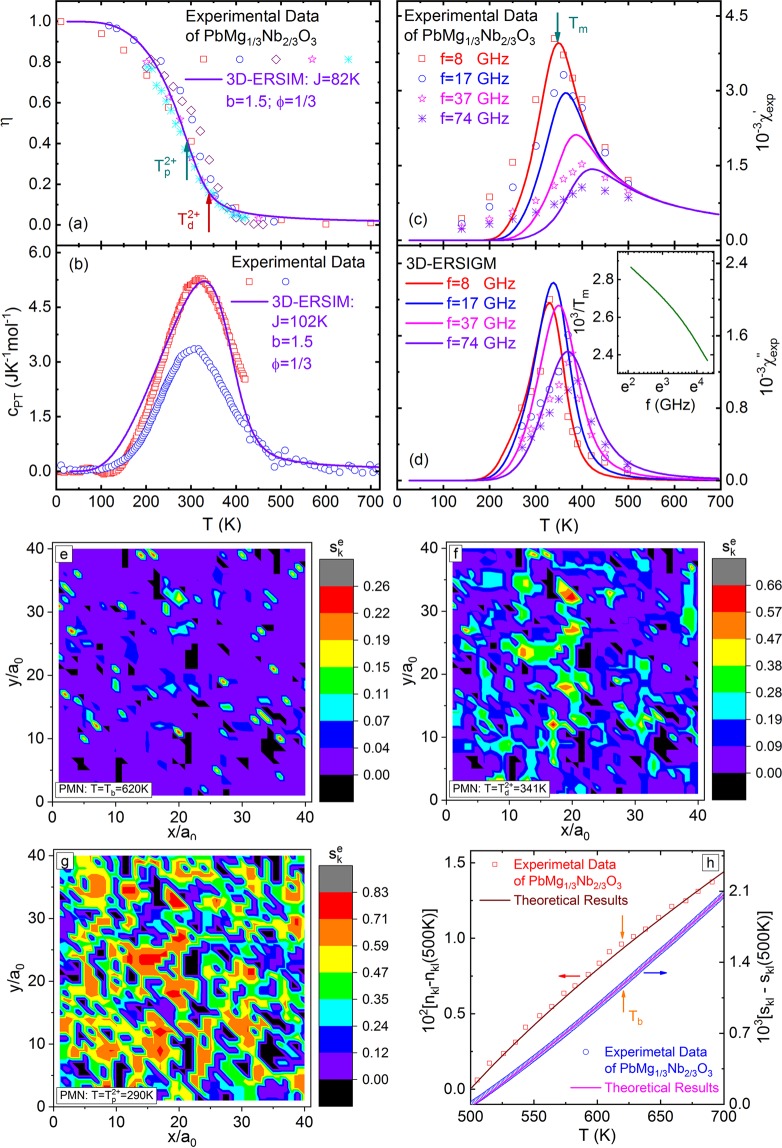
Relaxor-ferroelectrics are fascinating and useful materials, but the mechanism of relaxor-ferroelectricity has been puzzling the scientific community for more than 65 years. Here, a theory of relaxor-ferroelectricity is presented based on 3-dimensional-extended-random-site-Ising-model along with Glauber-dynamics of pseudospins. We propose a new mean-field of pseudospin-strings to solve this kinetic model. The theoretical results show that, with decreasing pseudospin concentration, there are evolutions from normal-ferroelectrics to relaxor-ferroelectrics to paraelectrics, especially indicating by the crossovers from, (a) the sharp to diffuse change at the phase-transition temperature to disappearance in the whole temperature range of order-parameter, and (b) the power-law to Vogel-Fulcher-law to Arrhenius-relation of the average relaxation time. Particularly, the calculated local-order-parameter of the relaxor-ferroelectrics gives the polar-nano-regions appearing far above the diffuse-phase-transition and shows the quasi-fractal characteristic near and below the transition temperature. We also provide a new mechanism of Burns-transformation which stems from not only the polar-nano-regions but also the correlation-function between pseudospins, and put forward a definition of the canonical relaxor-ferroelectrics. The theory accounts for the main facts of relaxor-ferroelectricity, and in addition gives a good quantitative agreement with the experimental results of the order-parameter, specific-heat, high-frequency permittivity, and Burns-transformation of lead magnesium niobate, the canonical relaxor-ferroelectric.


Conflict of interest statement

The authors declare no competing interests.

Figures

Figure 1
Figure 1
(a) Surface plot of the simulated spatial distributions of PSs (red of height 1) and PS-vacancies (yellow of height 0) in the x-y-plane (z/a0=100) of 3D-RSIM for ϕ =1/3 (a 200 × 200 × 200a03 lattice). (b) Simulated PS distribution and connected short PSSs along the x-axis direction in the x-y-plane (z/a0=10) of 3D-RSIM for ϕ =1/3 (a small 25 × 25 × 25a03 lattice). Cyan lines and red solid circles show the crystal lattice and PSs, respectively, while the unlabeled lattice points are PS-vacancies. A blue solid square indicates that its nearest-neighbor two PSs belong to the same string; (c) Connected long PSSs in the x-y plane. They are ring PSSs in the circles of (c); and (d) Three PSSs selected from (c). The red circles, blue squares, and violet diamonds show the PSs, the intra-string and inter-string interaction bonds. PSS-1: n=11 and g=11. PSS-2: n=24 and g=21. PSS-3: n=24 and g=15.
Figure 2
Figure 2
(a) qn vs n in 3D-RSIM with ϕ=0.1,0.3,05,07,0.9, and the inset shows nqn vs n for the corresponding ϕ values. np is the peak position of nqn. (b) n0 vs ϕ in 3D-RSIM, and the inset illustrates ER vs ϕ. (cf) nng vs g/n and n in 3D-RSIM with ϕ = 0.1, 0.3, 0.7, and 0.9.
Figure 3
Figure 3
(a) ηneg, (b) χsng, and (c) cng of the n-g-PSSs vs T for b=1.5, g/n=2, n=1 (pink dot line), 10 (blue dash), and 100 (red solid). (d) ηneg, (e) χsng, and (f) cng of the n-g-PSSs vs T for b=1.5,n=10, g/n=0 (red solid line #1), 1 (blue #2), 2 (pink #3), 3 (violet #4), and 4 (orange #5). Tpng in (a,d) is the DPT temperature.
Figure 4
Figure 4
(ac) η, χsps, and cps of 3D-ERSIM with ϕ=0,0.1,0.3,0.5,0.7,0.9 vs T for b=1.5. (df) Order-parameter, static-permittivity, and average specific-heat per PS of 3D-ERSIM, n-0-PSSs, n-1-PSSs, and n-2+-PSSs in the model vs T for ϕ = 0.7 and b=1.5. Tp1 and Tp2+ are the transition temperatures, as well as Td1 and Td2+ the diffuse temperatures of n-1-PSSs and n-2+-PSSs. (g,h) Phase diagram of 3D-ERSIM with b=1.5, i.e. Tp1, Tp2+, Td1, Td2+, RP0, RF1, RF2+, and Tb vs ϕ. ϕe and ϕp (PS percolation threshold of 3D-RSIM) are, respectively, the characteristic concentrations of the evolutions between the normal-ferroelectrics RFEs paraelectrics. ϕc (PS-vacancy percolation threshold of 3D-RSIM) is the characteristic concentration of the canonical RFEs (Sec. Inter-PSS interaction distribution and Sec. Definition of canonical RFEs).
Figure 5
Figure 5
(a) Simulated spatial distributions of PSs and PS-vacancies in the x-y-plane (z/a0=20) of 3D-ERSIM for ϕ=1/3 and b=1.5 (40 × 40 × 40 lattice points). Red and blue squares show the PSs and PS-vacancies, respectively. (bf) Surface plots of the calculated ske in the x-y-plane when T=0.5J/kB=0.14Tp2+ (b), 3.7J/kB=Tp2+ (c), 4.3J/kB=Td2+ (d), 7.4J/kB=2Tp2+ (e), and 8.6J/kB=2Td2+ (f).
Figure 6
Figure 6
ντnngof n-g-PSSs with b=1.5 vs T for g/n=2 and n=2,10,100 (a), and for n=10 and g/n=0, 1, 2, 3, 4 (b). (cf) χng and χng of n-g-PSSs with b=1.5 and UB=20J vs T and ω for n=10 and g/n=0 (c,e), 2 (d,f). Tmng is the temperature corresponding to the maximum of χng. Insets of (c,d) show 1/Tmng vs ω.
Figure 7
Figure 7
(a,c,e,g,i) χps as well as (b,d,f,h,j) χps of 3D-ERSIGM with b=1.5, UB=20J, and serial ϕ vs T and serial ω. (a,b) ϕ = 0.1. (c,d) ϕ = 0.3. (e,f) ϕ=0.5. (g,h) ϕ=0.7. (i,j) ϕ =0.9. ω =0 (red solid line), 104.0ν0 (blue), 103.5ν0 (deep yellow), 103.0ν0 (pink), 102.5ν0 (dark green), 102.0ν0 (orange), and 101.5ν0 (violet). Tm in (e) is the temperature corresponding to the maximum of χps. The inset of (b) shows the corresponding 1/Tm vs ω.
Figure 8
Figure 8
(a) Red square, blue circle [from Gehring et al. Phys. Rev. B 79, 224109 (2009)], violet diamond, pink star, and cyan asterisk [from Stock et al. Phys. Rev. B 81, 144127 (2010)] points are the experimental data of the order-parameter (η) of PMN single crystals vs temperature (T). The line is the results of 3D-ERSIM with ϕ = 1/3, J=82K, and b=1.5. Tp2+=290K and Td2+=341K. (b) Red square [from Moriya et al. Phys. Rev. Lett. 90, 205901 (2003)] and blue circle [from Tachibana et al. Phys. Rev. B 80, 094115 (2009)] points are the experimental data of the specific-heat (cpt) of the DPT of PMN single crystals vs T. The line is the results of 3D-ERSIM with ϕ = 1/3, J=102K, andb=1.5. (c) Points are the experimental data of the real part (χexp) and (d) imaginary part (χexp) of complex-permittivity of PMN single crystals vs T for frequency (f) = 8, 17, 37, and 74GHz from Bovtun et al. [J. Euro. Cer. Soc. 26, 2867 (2006)]. The lines are the results of 3D-ERSIGM with ϕ = 1/3, J=87K, b=1.5, Cw=3.28×10³K, UB=20J, and ν0=2.51×10¹⁴Hz. The inset of (d) shows the theoretical 1/Tm vs f. (eg) Surface plots of the calculated ske in a x-y-plane of PMN when T=620KTb, 341K=Td2+, and 290K=Tp2+ according to the 3D-ERSIM for ϕ = 1/3, J=82K and b=1.5. (h) Points are the experimental data of refractive-index (nkl, 4880Å) [red squares from H. S. Luo (private communication)] and thermal-strain (skl) [blue circles from L. N. Wang (private communication)] of PMN single crystals vs T. The lines are our theoretical results (Eq. 13a-b), (i) for nkl: ϕ = 1/3, J=90K, b=1.5, bkl=3.75×10⁵K−1, anddkl=0.124, and (ii) for skl: ϕ = 1/3, J=90K, b=1.5, αkl=1.32×10⁵K−1, and ckl=9.81×10³.

References

    1. Smolenskii GA, Rozgachev KI. Segnetoelektricheskie svoistva tverdykh rastvorov v sisteme titanat bariya titanat strontsiya. Z. Tekhn. Fiz. 1954;24:1751–1760.
    1. Smolenskii GA, Agranovskaya AI. Dielectric polarization of a number of complex compounds. Sov. Phys. Sol. Stat. 1960;1:1429–1437.
    1. Westphal V, Kleemann W, Glinchuk MD. Diffuse phase-transitions and random-field-induced domain states of the relaxor ferroelectric PbMg1/3Nb2/3O3. Phys. Rev. Lett. 1992;68:847–850. doi: 10.1103/PhysRevLett.68.847. - DOI - PubMed
    1. Kleemann W, Kloessner A. Glassy and domain states in random dipolar systems. Ferroelectrics. 1993;150:35–45. doi: 10.1080/00150199308008692. - DOI
    1. Viehland D, Jang SJ, Cross LE, Wuttig M. Freezing of the polarization fluctuations in lead magnesium niobate relaxors. J. Appl. Phys. 1990;68:2916–2921. doi: 10.1063/1.346425. - DOI