Meta-Analysis
. 2020 Mar 19;3(1):133.
doi: 10.1038/s42003-020-0802-y.

Genome-wide association meta-analysis of corneal curvature identifies novel loci and shared genetic influences across axial length and refractive error

Qiao Fan #  1   2 Alfred Pozarickij #  3 Nicholas Y Q Tan #  4 Xiaobo Guo #  5   6 Virginie J M Verhoeven #  7   8 Veronique Vitart  9 Jeremy A Guggenheim  3 Masahiro Miyake  10 J Willem L Tideman  7   11 Anthony P Khawaja  12   13 Liang Zhang  14 Stuart MacGregor  15 René Höhn  16   17 Peng Chen  18 Ginevra Biino  19 Juho Wedenoja  20   21 Seyed Ehsan Saffari  22 Milly S Tedja  7   11 Jing Xie  23   24 Carla Lanca  25 Ya Xing Wang  26 Srujana Sahebjada  24   27 Johanna Mazur  28 Alireza Mirshahi  16   29 Nicholas G Martin  15 Seyhan Yazar  30 Craig E Pennell  31 Maurice Yap  32 Annechien E G Haarman  7   11 Clair A Enthoven  7   11 JanRoelof Polling  7   11   33 Consortium for Refractive Error and Myopia (CREAM)UK Biobank Eye and Vision ConsortiumAlex W Hewitt  30   34 Vincent W V Jaddoe  35 Cornelia M van Duijn  11 Caroline Hayward  9 Ozren Polasek  36 E-Shyong Tai  18 Hosoda Yoshikatsu  10 Pirro G Hysi  37 Terri L Young  38 Akitaka Tsujikawa  10 Jie Jing Wang  39   40 Paul Mitchell  40 Norbert Pfeiffer  16 Olavi Pärssinen  41   42 Paul J Foster  12 Maurizio Fossarello  43   44 Shea Ping Yip  45 Cathy Williams  46 Christopher J Hammond  37 Jost B Jonas  26   47 Mingguang He  48   49 David A Mackey  30   34 Tien-Yin Wong  50   4   39 Caroline C W Klaver  7   11   51 Seang-Mei Saw  50   18   25 Paul N Baird  27 Ching-Yu Cheng  52   53
Collaborators, Affiliations
Meta-Analysis

Genome-wide association meta-analysis of corneal curvature identifies novel loci and shared genetic influences across axial length and refractive error

Qiao Fan et al. Commun Biol. .

Abstract

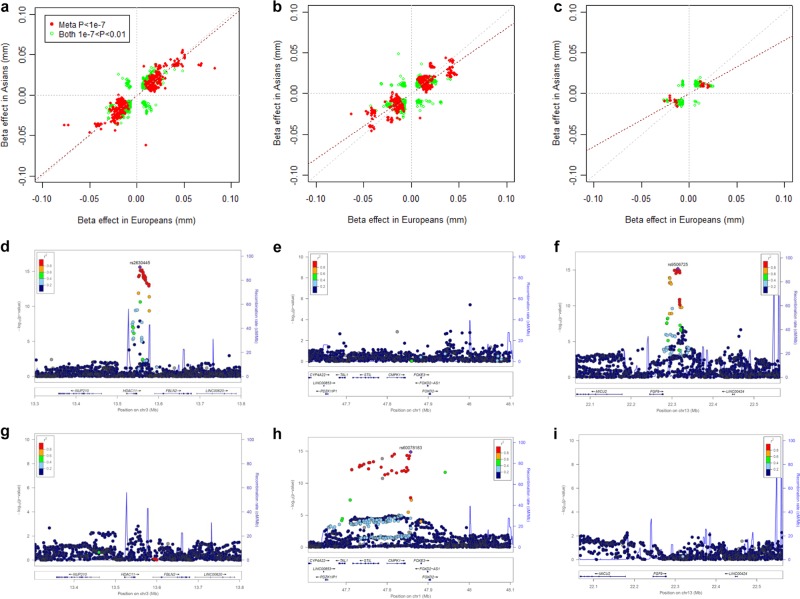
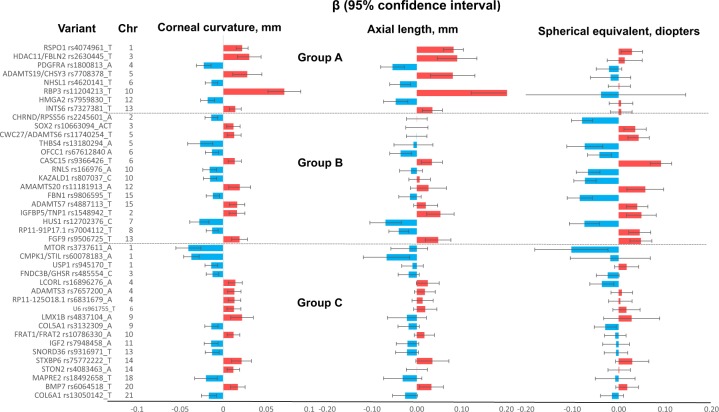
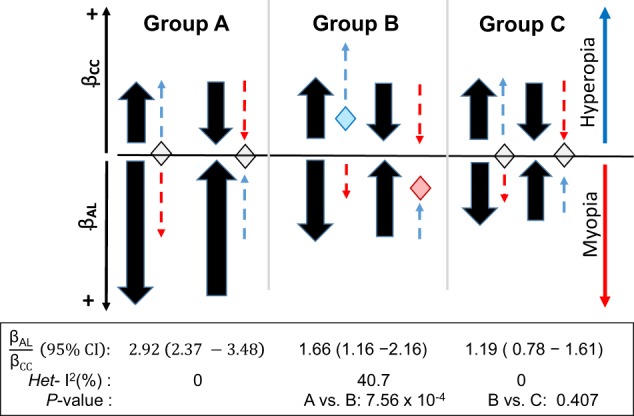
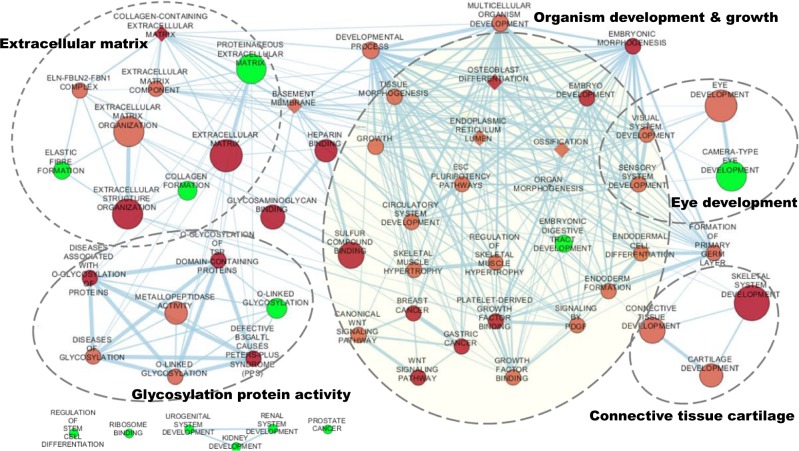
Corneal curvature, a highly heritable trait, is a key clinical endophenotype for myopia - a major cause of visual impairment and blindness in the world. Here we present a trans-ethnic meta-analysis of corneal curvature GWAS in 44,042 individuals of Caucasian and Asian with replication in 88,218 UK Biobank data. We identified 47 loci (of which 26 are novel), with population-specific signals as well as shared signals across ethnicities. Some identified variants showed precise scaling in corneal curvature and eye elongation (i.e. axial length) to maintain eyes in emmetropia (i.e. HDAC11/FBLN2 rs2630445, RBP3 rs11204213); others exhibited association with myopia with little pleiotropic effects on eye elongation. Implicated genes are involved in extracellular matrix organization, developmental process for body and eye, connective tissue cartilage and glycosylation protein activities. Our study provides insights into population-specific novel genes for corneal curvature, and their pleiotropic effect in regulating eye size or conferring susceptibility to myopia.


Conflict of interest statement

The authors declare no competing interests.

Figures

Fig. 1
Fig. 1. Manhattan plot of trans-ethnic GWAS meta-analysis for corneal curvature.
Both directly genotyped and imputed variants were meta-analysed for corneal curvature in 44,042 CREAM participants. The y-axis represents −log10p values for association with corneal curvature, and the x-axis represents genomic position based on human genome build 37, highlighting newly identified loci (arrows in blue; Table 1), loci associated with axial length (labelled with nearest gene names), and loci associated with spherical equivalent (cross in green). The horizontal red line indicates the genome-wide significance level of P < 5.0 × 10−8. The horizontal blue line indicates the suggestive significance level of P < 1.0 × 10−5.
Fig. 2
Fig. 2. Concordance of effect sizes of variants between European and Asian populations and loci showing population-specific signals.
ac For each scatter plot, effect size in Asians (x-axis) and in Europeans (y-axis) was plotted for variants with P< 0.01 in both ancestry groups in CREAM. The variants were grouped based on the allele frequency difference between European and Asian populations: a <0.1; b 0.1–0.3, and d >0.3. The red dot represents variants with P < 1.0 × 10−7 in the meta-analysis of combined population, and green circle indicates variant with 1.0 × 10−7 < P < 0.01 in both Europeans and Asians. Dashed line in red is the fitted line and in grey is the x = y line of unity. di Regional plots in CREAM Europeans (df) and Asians (gi) showing population-specific signals at loci exhibiting allele frequency differences: HDAC11/FBLN2 (d, g), CMPK1/STIL (e, h) and c FGF9 (f, i). Here we present regional plots for three lead variants. (i) Lead variant rs2630445 in plot d showing genome-wide association signals in Europeans (MAF = 0.10) is monomorphic in Asian populations. (ii) Lead variant rs60078183 in plot h exhibiting association in Asians (MAF = 0.21) is monomorphic in European populations. (iii) Lead variant rs9506725 in plot f showing association in Europeans (MAF = 0.36) is monomorphic in Asian populations.
Fig. 3
Fig. 3. Effect sizes on cornea curvature, axial length and spherical equivalent for CC-associated variants.
Corneal curvature (CC)-associated genetic variants identified from CREAM (n = 44,042) were grouped based on the patterns of the associations of effect alleles with axial length (AL; n = 10,851) and spherical equivalent (n = 95,505). Group A—variants associated with AL only (‘eye-size’ determining genetic variants); the effect allele of each variant was associated with eye size: a larger eye with both a flatter CC and longer AL (positive β on both CC and AL; bar in red), and a smaller eye with both a steeper CC and shorter AL (negative β; bar in blue). These variants were not associated with spherical equivalent. Group B—variants associated with spherical equivalent; the allele associated with a steeper CC was associated with a more negative refractive error (or vice versa). These variants were not associated with AL, except those at loci IGFBP5/TNP1, HUS1, RP11-91P17.1, and FGF9. Group C—variants not associated with spherical equivalent or AL. For the associations with axial length and spherical equivalent, FDR < 0.01 was considered significance. The colour of the bar represents a positive genetic effect (in red) or a negative genetic effect (in blue).
Fig. 4
Fig. 4. Illustration of pleiotropic effect ratio βALβCC and effects toward emmetropic and myopic states.
The figure illustrates genetic effects of AL (βAL) might or might not compensate genetic effects of corneal curvature (βCC) toward myopia or hyperopia. Longer CC (shown by positive βCC; arrow upward) tends to make the eye hyperopic (dashed line in blue) and longer AL (positive βCC; arrow downward) tends to make the eye more myopic (dashed line in red). Similarly, steeper CC (negative βCC, arrow downward) tends to make the eye more myopic and shorter AL (negative βCC; arrow downward) tends to make the eye less myopic. The compensatory pleiotropic effects βAL could offset βCC on myopia or hyperopia at the pleiotropic ratio βALβCC ~ 3, as shown in group A. The compensatory pleiotropic effects βAL, however, cannot offset βCC on myopia or hyperopia at smaller pleiotropic ratio βALβCC, as shown in group B. There might be other pleiotropic effect in Group C, besides AL, to compensate genetic effect of CC on myopia. Het-I2, for heterogeneous effects between the variants. All P-value for heterogeneity was >0.05. Pleiotropic effect ratio was calculated at each variant and combined to estimate βALβCC and heterogeneity using the meta-analysis approach (see Methods). Grouping of A, B, and C was the same as in Fig. 3.
Fig. 5
Fig. 5. Gene-set enrichment analysis for corneal curvature in CREAM data.
Enrichment results were mapped as a network of gene-sets (nodes) related by mutual overlap (edges). Node size is proportional to the total number of genes in each set, colour gradient represents the enrichment significance and edge thickness represents the number of overlapping genes between sets. Nodes in red represent gene-sets identified from the g:Profiler enrichment analysis, and in green represent additional gene-sets identified from the VEGAS-pathway analysis. Nodes of diamond show the pathways for the implicated genes associated with both CC and spherical equivalent (Group 2 in Fig. 3). Groups of functionally related gene-sets are circled and labelled (dashed line).

References

    1. Dandona L, Dandona R. What is the global burden of visual impairment? BMC Med. 2006;4:6–6. doi: 10.1186/1741-7015-4-6. - DOI - PMC - PubMed
    1. Holden BA, et al. Global prevalence of myopia and high myopia and temporal trends from 2000 through 2050. Ophthalmology. 2016;123:1036–1042. doi: 10.1016/j.ophtha.2016.01.006. - DOI - PubMed
    1. Flaxman SR, et al. Global causes of blindness and distance vision impairment 1990-2020: a systematic review and meta-analysis. Lancet Glob. Health. 2017;5:e1221–e1234. doi: 10.1016/S2214-109X(17)30393-5. - DOI - PubMed
    1. Atchison, D.A. & George, S. Optics of the human eye, 288–288 (Butterworth-Heinemann, 2000).
    1. Ip JM, et al. Ethnic differences in refraction and ocular biometry in a population-based sample of 11–15-year-old Australian children. Eye. 2008;22:649–656. doi: 10.1038/sj.eye.6702701. - DOI - PubMed

Publication types