

Pulsatilla Decoction Can Treat the Dampness-Heat Diarrhea Rat Model by Regulating Glycerinphospholipid Metabolism Based Lipidomics Approach
- PMID: 32194420
- PMCID: PMC7064006
- DOI: 10.3389/fphar.2020.00197
Pulsatilla Decoction Can Treat the Dampness-Heat Diarrhea Rat Model by Regulating Glycerinphospholipid Metabolism Based Lipidomics Approach
Abstract
Ethnopharmacological relevance: Diarrhea is a major medical problem in clinical practice. According to the theory of traditional Chinese medicine (TCM), different types of diarrhea should be treated with different TCM formulations based on the targeted medical condition. Dampness-heat diarrhea (DHD) is a serious diarrheal disease and Pulsatilla decoction (PD), a TCM, has been found effective against DHD.
Objective: The aim of this study was to clarify the mechanism of action of PD in DHD using an untargeted lipidomics strategy.
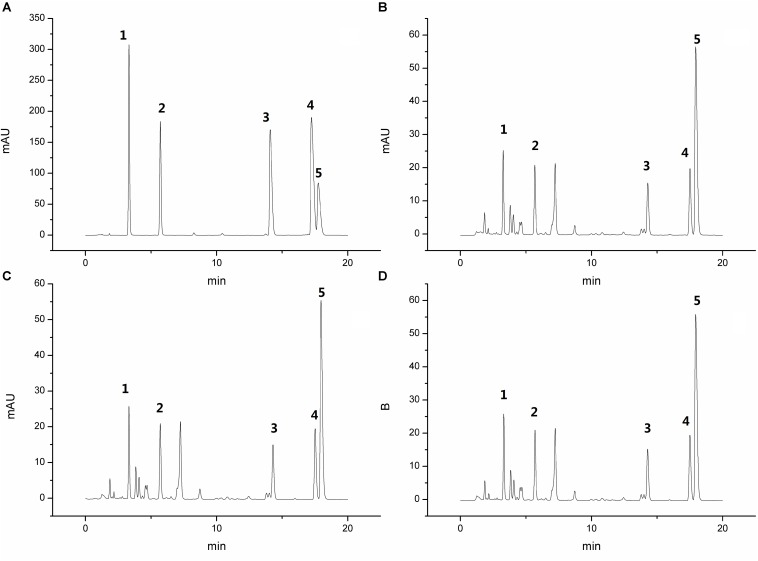
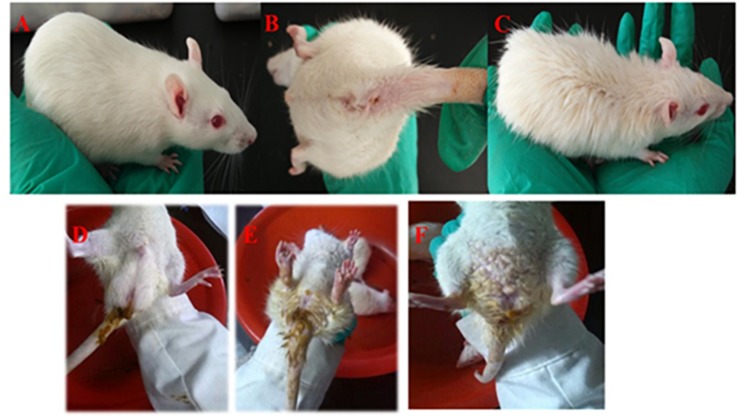
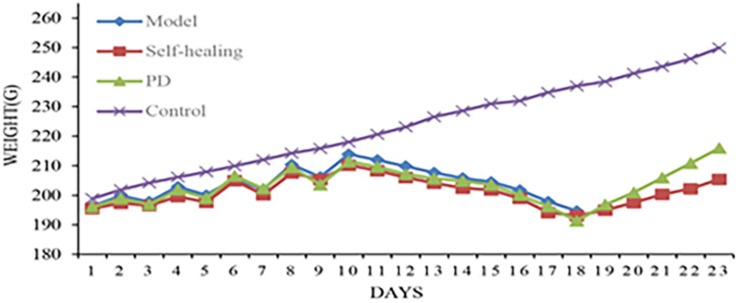
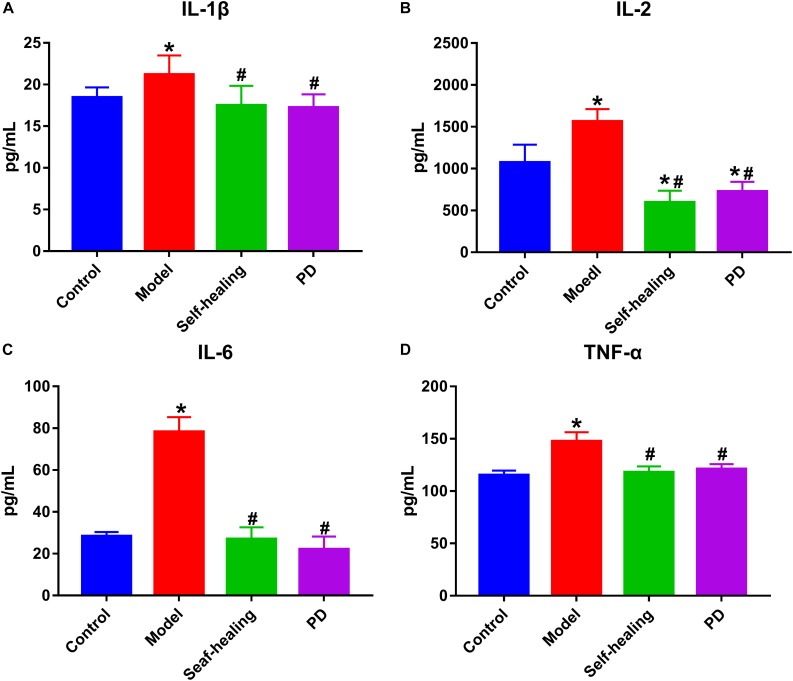
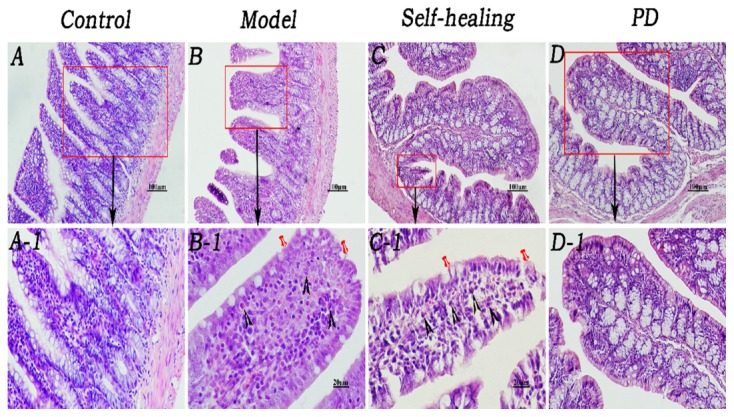
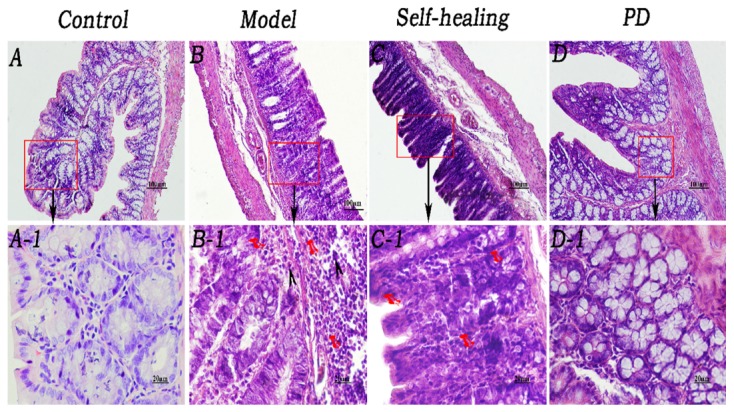
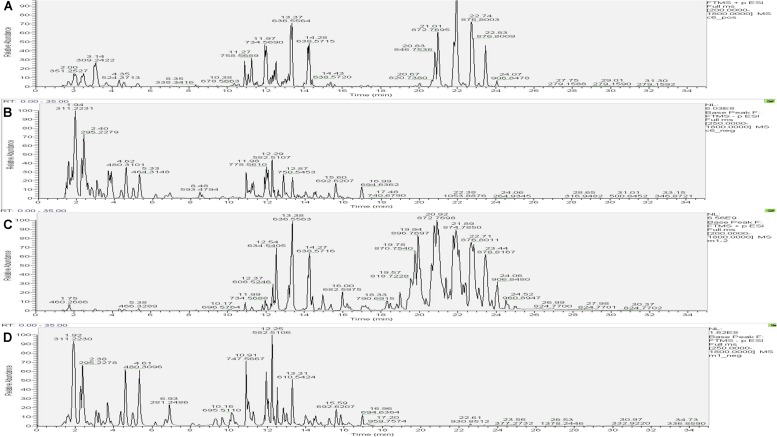
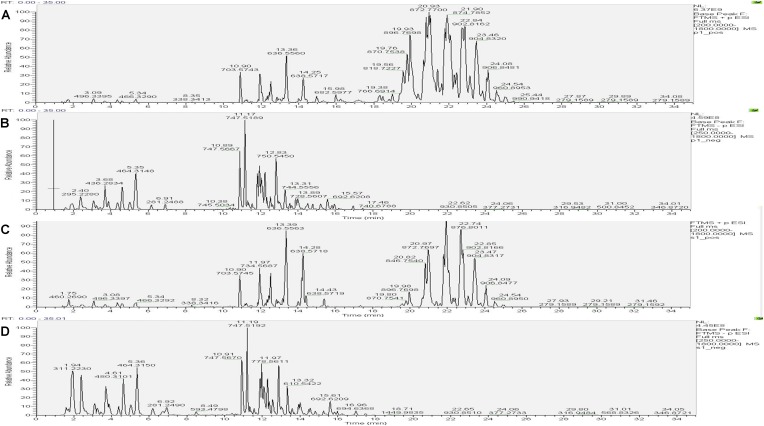
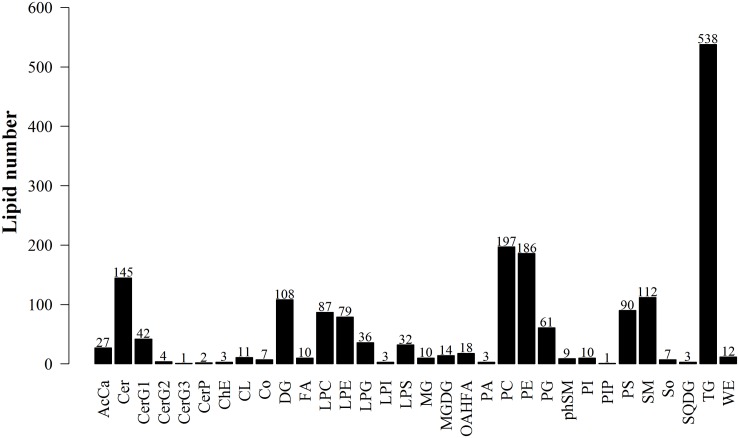
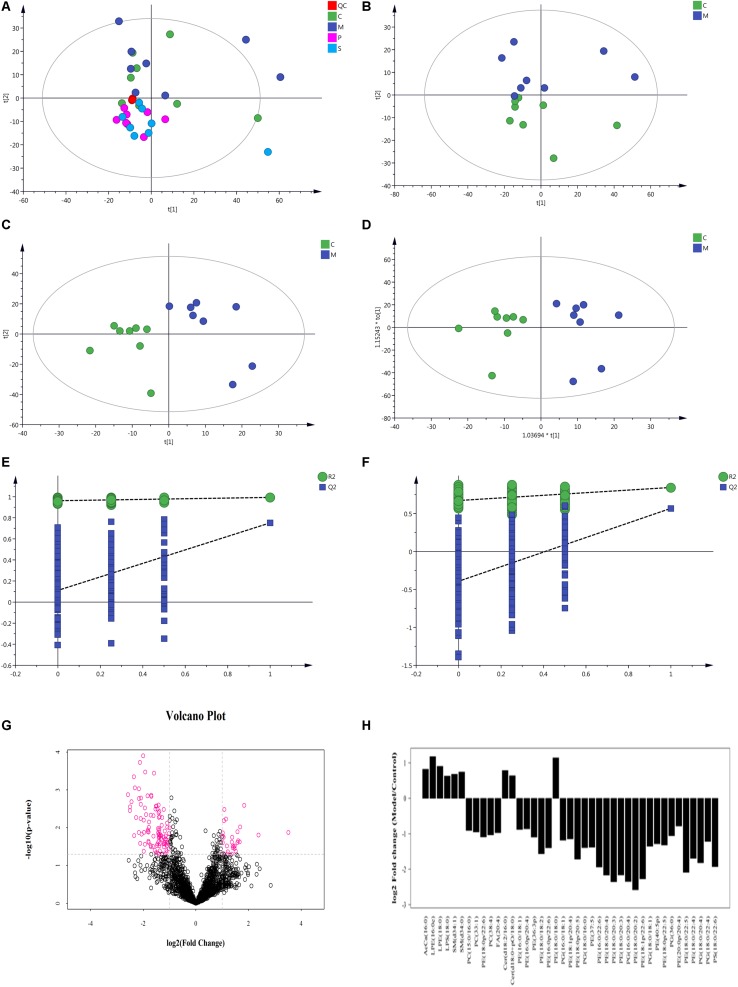
Materials and methods: Wistar rats were randomized to four groups, including the control group, model group, PD groups and self-healing group. The PD groups were given a daily intragastric gavage of PD at doses of 3.76 g/kg. The rat model of DHD established by such complex factors as high-sugar and high-fat diet, improper diet, high temperature and humidity environment, drinking and intraperitoneal injection of Escherichia coli., which imitated the inducing conditions of DHD. Then the clinical symptoms and signs, blood routine, serum inflammatory cytokines levels and the histopathological changes of main organs were detected and observed to evaluate DHD model and therapeutic effect of PD. Lipid biomarkers of DHD were selected by comparing the control and model groups with the colon lipidomics technology and an ultra-high performance liquid chromatography (UHPLC) coupled with Q Exactive plus mass analyzer. Multivariate statistical analysis and pattern recognition were employed to examine different lipids within the colon of PD-treated rats.
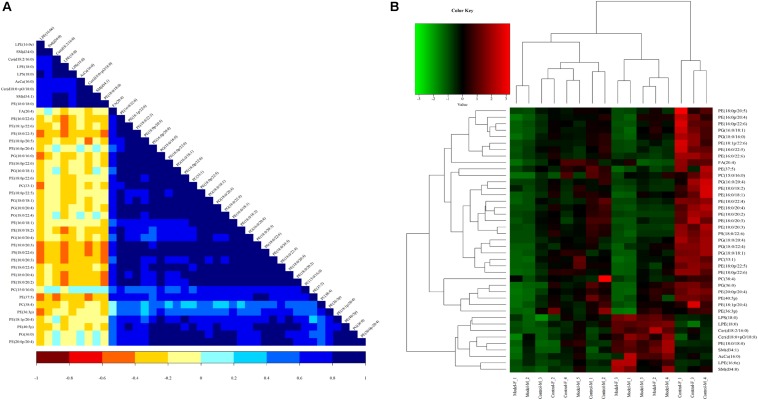
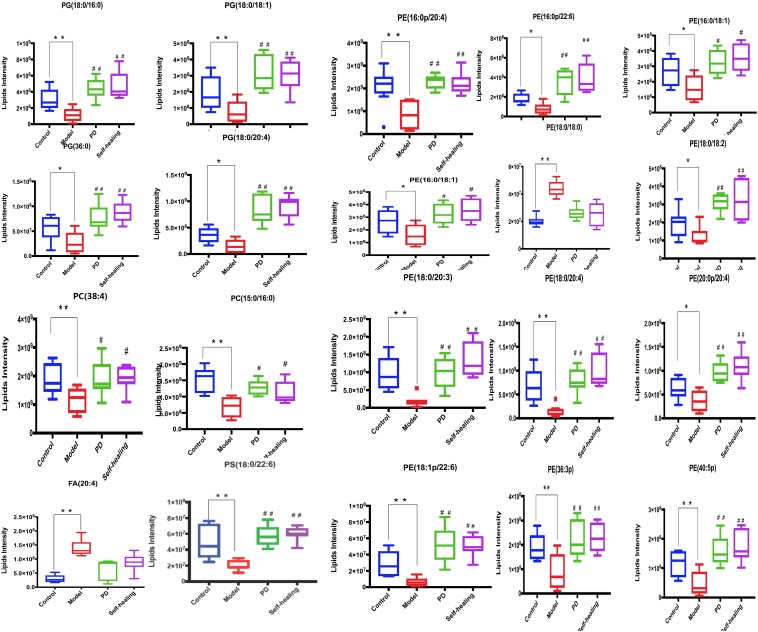
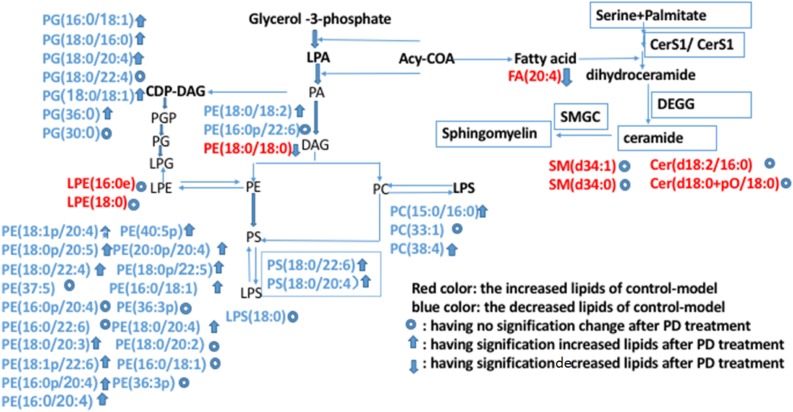
Results: The clinical symptoms and signs of the model rats were consistent with the diagnostic criteria of DHD. After treatment with PD, the clinical symptoms and signs of the rats with DHD were improved; the indexes of blood routine and inflammatory cytokines levels tended to be normal. The lipidomics profile of the model group were evidently disordered when compared to the control group. A total of 42 significantly altered lipids between the model-control groups were identified by multivariate statistical analysis. DHD may result from such lipid disorders which are related to glycerophospholipid metabolism, arachidonic acid (AA) metabolism, and sphingolipid metabolism. After PD treatment, the lipidomic profiles of the disorders tended to recover when compared to the model group. Twenty lipid molecules were identified and some glycerophospholipids and AA levels returned close to the normal level.
Conclusion: Glycerophospholipid metabolism may play an important role in the treatment of dampness-heat induced diarrhea using PD.
Keywords: arachidonic acid metabolism; colon lipidomics; dampness-heat diarrhea; glycerophospholipid metabolism; pulsatilla decoction.
Copyright © 2020 Hua, Ma, Zhang, Jia, Peng, Yao, Ji, Hu and Wei.
Figures
Similar articles
-
Treatment effects and mechanisms of Yujin Powder on rat model of large intestine dampness-heat syndrome.J Ethnopharmacol. 2017 Apr 18;202:265-280. doi: 10.1016/j.jep.2017.03.030. Epub 2017 Mar 19. J Ethnopharmacol. 2017. PMID: 28330724
-
[Integrated strategy for mechanism of Baitouweng Decoction in treating dampness-heat diarrhea based on urine metabolomics coupled with network pharmacology].Zhongguo Zhong Yao Za Zhi. 2022 Jul;47(14):3887-3897. doi: 10.19540/j.cnki.cjcmm.20220222.401. Zhongguo Zhong Yao Za Zhi. 2022. PMID: 35850847 Chinese.
-
Huang Bai Jian Pi decoction alleviates diarrhea and represses inflammatory injury via PI3K/Akt/NF-κB pathway: In vivo and in vitro studies.J Ethnopharmacol. 2022 Jun 28;292:115212. doi: 10.1016/j.jep.2022.115212. Epub 2022 Mar 22. J Ethnopharmacol. 2022. PMID: 35331876
-
Metabolomics analysis of Pulsatilla decoction on treatment of wetness-heat-induced diarrhea in rats based on UPLC-Q/TOF-MS/MS.Biomed Chromatogr. 2019 Nov;33(11):e4629. doi: 10.1002/bmc.4629. Epub 2019 Aug 13. Biomed Chromatogr. 2019. PMID: 31242331
-
Integrated 16S rDNA Gene Sequencing and Untargeted Metabolomics Analyses to Investigate the Gut Microbial Composition and Plasma Metabolic Phenotype in Calves With Dampness-Heat Diarrhea.Front Vet Sci. 2022 Feb 15;9:703051. doi: 10.3389/fvets.2022.703051. eCollection 2022. Front Vet Sci. 2022. PMID: 35242833 Free PMC article.
Cited by
-
Mechanism underlying the effect of Pulsatilla decoction in hepatocellular carcinoma treatment: a network pharmacology and in vitro analysis.BMC Complement Med Ther. 2023 Nov 10;23(1):405. doi: 10.1186/s12906-023-04244-w. BMC Complement Med Ther. 2023. PMID: 37950195 Free PMC article.
-
Lianweng Granules Alleviate Intestinal Barrier Damage via the IL-6/STAT3/PI3K/AKT Signaling Pathway with Dampness-Heat Syndrome Diarrhea.Antioxidants (Basel). 2024 May 28;13(6):661. doi: 10.3390/antiox13060661. Antioxidants (Basel). 2024. PMID: 38929100 Free PMC article.
-
Comprehensive lipidomic analysis reveals regulation of glyceride metabolism in rat visceral adipose tissue by high-altitude chronic hypoxia.PLoS One. 2022 May 6;17(5):e0267513. doi: 10.1371/journal.pone.0267513. eCollection 2022. PLoS One. 2022. PMID: 35522648 Free PMC article.
-
Baitouweng decoction suppresses growth of esophageal carcinoma cells through miR-495-3p/BUB1/STAT3 axis.World J Gastrointest Oncol. 2024 Jul 15;16(7):3193-3210. doi: 10.4251/wjgo.v16.i7.3193. World J Gastrointest Oncol. 2024. PMID: 39072160 Free PMC article.
-
Pulsatilla decoction alleviates colitis by enhancing autophagy and regulating PI3K‑Akt‑mTORC1 signaling pathway.Mol Med Rep. 2022 Mar;25(3):108. doi: 10.3892/mmr.2022.12624. Epub 2022 Feb 1. Mol Med Rep. 2022. PMID: 35103289 Free PMC article.
References
-
- Afroz S., Yagi A., Fujikawa K., Rahman M. M., Morito K., Fukuta T., et al. (2018). Lysophosphatidic acid in medicinal herbs enhances prostaglandin E 2 and protects against indomethacin-induced gastric cell damage in vivo and in vitro. Prostaglandins Other Lipid Mediat. 135 36–44. 10.1016/j.prostaglandins.2018.01.003 - DOI - PubMed
-
- Fan Y. Q., Chen H. X., Chen L., Chen H. Z. (2019). Curative effect observation of modified pulsatilla decoction in treatment of large intestine damp-heat Ulcerative Colitis. Chin. J. Surg. Integr. Tradit. West. Med. 25:4.
LinkOut - more resources
Full Text Sources