Comparative Study
. 2020 Mar 3:11:302.
doi: 10.3389/fimmu.2020.00302. eCollection 2020.

Gender Disparity Impacts on Thymus Aging and LHRH Receptor Antagonist-Induced Thymic Reconstitution Following Chemotherapeutic Damage

Affiliations
Comparative Study

Gender Disparity Impacts on Thymus Aging and LHRH Receptor Antagonist-Induced Thymic Reconstitution Following Chemotherapeutic Damage

Michael Ly Hun et al. Front Immunol. .

Abstract

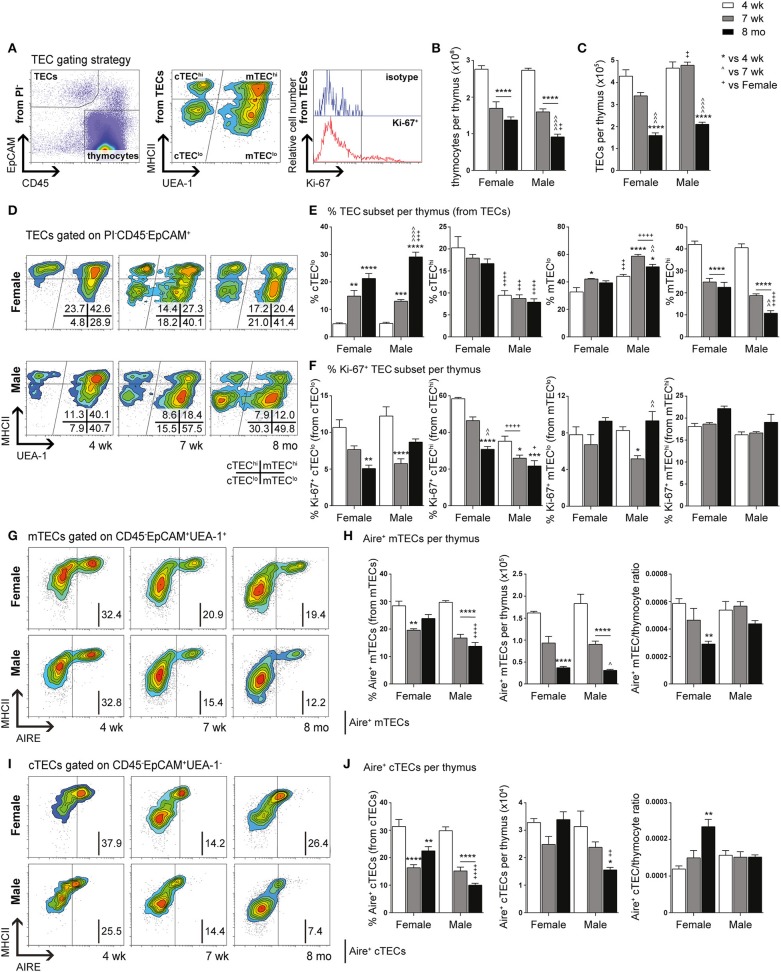
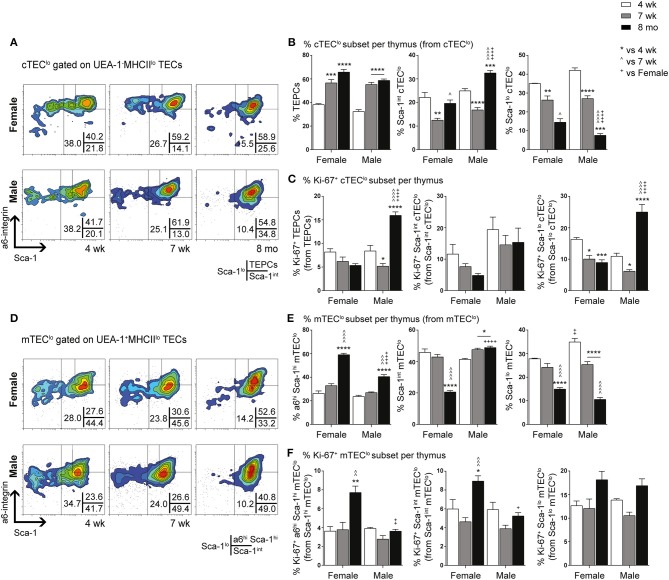
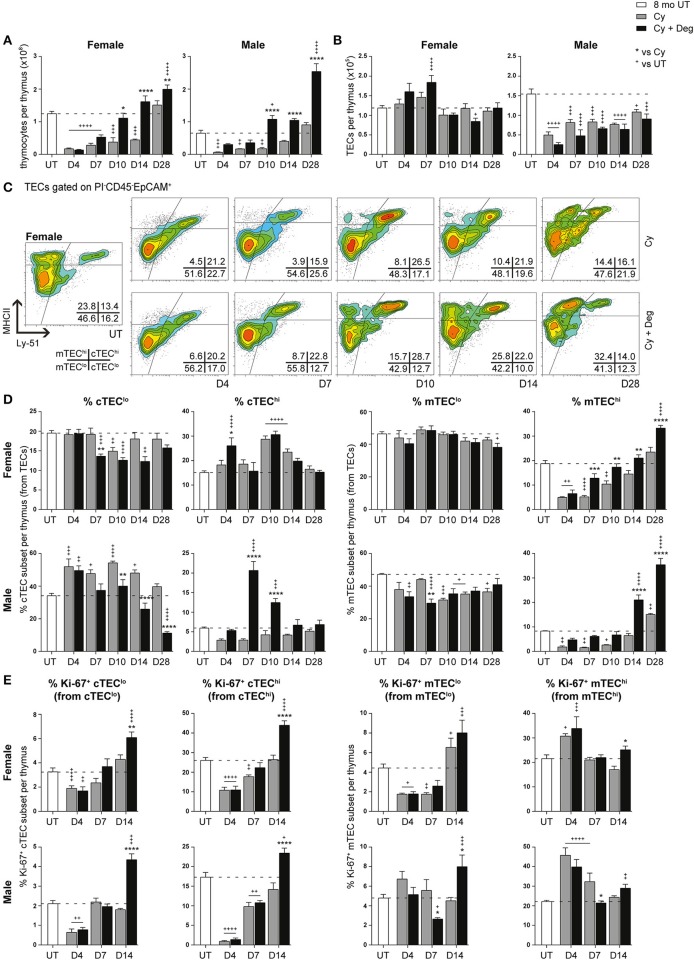
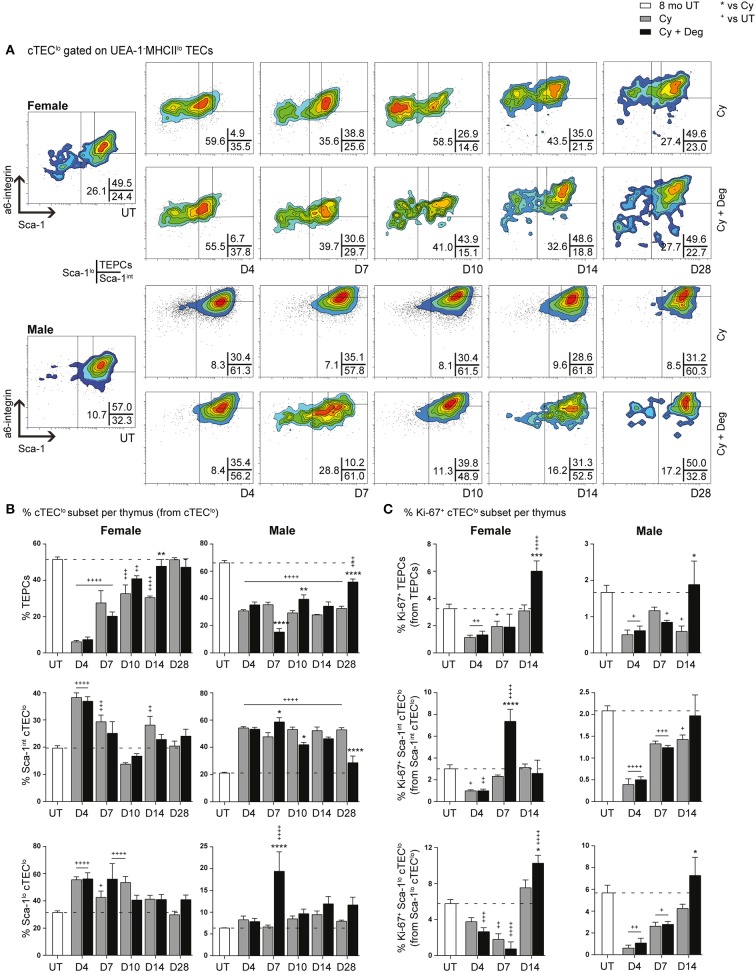
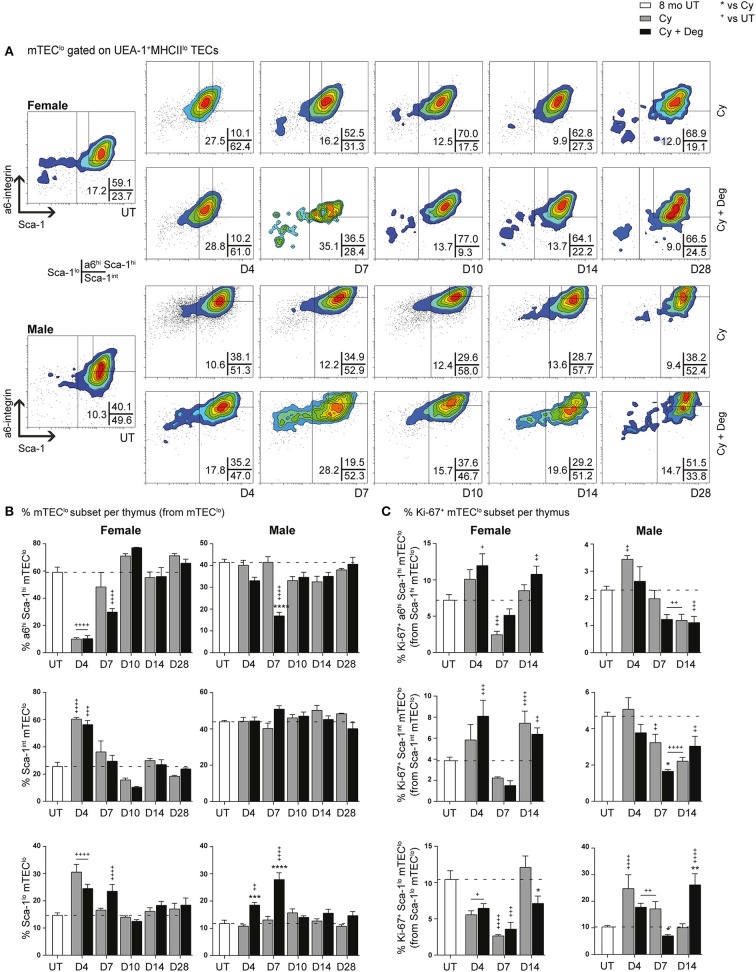
One of the main consequences of thymus aging is the decrease in naïve T cell output. This condition accelerates at the onset of puberty, and presents as a major clinical complication for cancer patients who require cytoablative therapy. Specifically, the extensive use of chemotherapeutics, such as cyclophosphamide, in such treatments damage thymic structure and eliminate the existing naïve T cell repertoire. The resulting immunodeficiency can lead to increased incidence of opportunistic infections, tumor growth relapse and/or autoimmune diseases, particularly in older patients. Thus, strategies aimed at rejuvenating the aged thymus following chemotherapeutic damage are required. Previous studies have revealed that sex hormone deprivation in male mice is capable of regenerating the thymic microenvironment following chemotherapy treatment, however, further investigation is crucial to identify gender-based differences, and the molecular mechanisms involved during thymus regeneration. Through phenotypic analyzes, we identified gender-specific alterations in thymocytes and thymic epithelial cell (TEC) subsets from the onset of puberty. By middle-age, females presented with a higher number of thymocytes in comparison to males, yet a decrease in their Aire+ medullary TEC/thymocyte ratio was observed. This reduction could be associated with an increased risk of autoimmune disease in middle-aged women. Given the concurrent increase in female Aire+ cTEC/thymocyte ratio, we proposed that there may be an impediment in Aire+ mTEChi differentiation, and Aire+ cTEChi as its upstream precursor. The regenerative effects of LHRH receptor antagonist, degarelix, on TEC subsets was also less pronounced in middle-aged females compared to males, possibly due to slower progression of thymic involution in the former, which presented with greater TEChi proportions. Furthermore, following cyclophosphamide treatment, degarelix enhanced thymocyte and mature TEC subset recovery, with faster recovery kinetics observed in females. These events were found to involve both reactivation and proliferation of thymic epithelial progenitor cells. Taken together, the findings from this study portray a relationship between gender disparity and thymus aging, and highlight the potential benefits of LHRH receptor antagonist treatment for thymic regeneration. Further research is required, however, to determine how gender may impact on the mechanisms underpinning these events.

Keywords: aging; chemotherapy; gender; luteinizing hormone-releasing hormone; regeneration; sex hormone deprivation; thymic epithelial cell; thymus.


Figures

Figure 1
Figure 1
Phenotypic analysis of TEC subsets in female and male mice during aging. (A) Gating strategy identifying thymocytes and TECs in 4-week-, 7-week-, and 8-month-old female and male C57BL/6J mice. UEA-1 and MHCII were used to further segregate TECs into cTEClo, cTEChi, mTEClo, and mTEChi subpopulations. Proliferative cells were identified based on fluorescence exceeding Ki-67 isotype levels. (B) Total thymocyte cellularity. (C) Total TEC cellularity. (D) Representative contour plots depicting proportional changes in TEC subsets in relation to gender with aging. (E) Proportion of cTEClo, cTEChi, mTEClo, and mTEChi subpopulations. (F) Proportion of Ki-67+ cells within TEC subsets. (G) Representative contour plots depicting proportional changes in Aire+ mTEC subpopulations in relation to gender with aging. (H) Proportion and number of Aire+ mTECs per thymus, and Aire+ mTEC/thymocyte ratio. (I) Representative contour plots depicting proportional changes in Aire+ cTEC subpopulations in relation to gender with aging. (J) Proportion and number of Aire+ cTECs per thymus, and Aire+ cTEC/thymocyte ratio. Data presented as mean + SEM (n ≥ 3). * vs. 4 wk, vs. 7 wk, + vs. Female (age matched). *p < 0.05, **p < 0.01, ***p < 0.001, ****p < 0.0001, ordinary two-way ANOVA with Tukey's multiple comparisons.
Figure 2
Figure 2
Phenotypic analysis of TEPC and mTEC progenitor subsets in female and male mice during aging. (A) Representative contour plots depicting proportional changes in cTEClo subsets in relation to gender with aging. Antibodies against α6-integrin and Sca-1 were used to segregate cTEClo into TEPC (α6hi Sca-1hi), Sca-1int cTEClo, and Sca-1lo cTEClo subpopulations. (B) Proportion of TEPC, Sca-1int cTEClo, and Sca-1lo cTEClo. (C) Proportion of Ki-67+ cells within cTEClo subsets. (D) Representative contour plots depicting proportional changes in mTEClo subsets in relation to gender with aging. Antibodies against α6-integrin and Sca-1 were used to segregate mTEClo into α6hi Sca-1hi mTEClo, Sca-1int mTEClo, and Sca-1lo mTEClo subpopulations. (E) Proportion of α6hi Sca-1hi mTEClo, Sca-1int mTEClo, and Sca-1lo mTEClo. (F) Proportion of Ki-67+ cells within mTEClo subsets. Data presented as mean + SEM (n ≥ 3). * vs. 4 wk, vs. 7 wk, + vs. Female (age matched). *p < 0.05, **p < 0.01, ***p < 0.001, ****p < 0.0001, ordinary two-way ANOVA with Tukey's multiple comparisons.
Figure 3
Figure 3
Evaluation of self-renewal and bipotency in female and male TEPC with aging using in vitro 3D co-cultures. (A) Colony forming efficiency (CFE%) of 4-week-, 7-week-, and 8-month-old TEPCs at D7. Each symbol represents one individual well. (B) Proportion of K14 and K14+colonies. (C) Representative immunofluorescent images of D7 colonies from 4-week-old female TEPC co-cultures. Cortical (β5t; red) and medullary regions (K14; green) from K14 and K14+ colonies are shown, together with nuclear staining (DAPI; blue). Scale bar = 10 μm. (D) Relative Fst and Bmp4 expression in cTEC, mTEClo, mTEChi, and non-TEC subsets from 4-week- and 7-week-old female mice; normalized to 4-week-old cTEC. Data presented as mean + SEM (n ≥ 3). * vs. 4 wk. *p < 0.05, **p < 0.01, ****p < 0.0001, ordinary one- or two-way ANOVA with Tukey's multiple comparisons.
Figure 4
Figure 4
Phenotypic analysis of TEC subsets in middle-aged female and male mice following degarelix treatment. (A) Total thymocyte cellularity in 8-month-old female and male mice following degarelix treatment. (B) Total TEC cellularity. (C) Proportion of cTEClo, cTEChi, mTEClo, and mTEChi subpopulations. (D) Proportion of TEPC, Sca-1int cTEClo, and Sca-1lo cTEClo. (E) Proportion of α6hi Sca-1hi mTEClo, Sca-1int mTEClo, and Sca-1lo mTEClo. Data presented as mean + SEM (n ≥ 3). * vs. UT. *p < 0.05, **p < 0.01, ***p < 0.001, ****p < 0.0001, ordinary one-way ANOVA with Dunnett's multiple comparisons.
Figure 5
Figure 5
Phenotypic analysis of TEC subsets in middle-aged female and male mice with degarelix treatment following Cy damage. (A) Total thymocyte cellularity in 8-month-old female and male mice with or without degarelix post-Cy treatment. (B) Total TEC cellularity. (C) Representative contour plots depicting proportional changes in female TEC subsets with or without degarelix post-Cy treatment. MHCII and Ly-51 were used to segregate TECs into cTEClo, cTEChi, mTEClo, and mTEChi subpopulations. (D) Proportion of cTEClo, cTEChi, mTEClo, and mTEChi subpopulations. (E) Proportion of Ki-67+ cells within TEC subsets. Data presented as mean + SEM (n ≥ 3). * vs. Cy, + vs. UT. *p < 0.05, **p < 0.01, ***p < 0.001, ****p < 0.0001, ordinary two-way ANOVA with Sidak's multiple comparisons.
Figure 6
Figure 6
Phenotypic analysis of Aire+ mTECs and cTECs in middle-aged female and male mice with degarelix treatment following Cy damage. (A) Representative contour plots depicting proportional changes in the Aire+ mTEC subpopulation with or without degarelix post-Cy treatment. (B) Proportion and number of Aire+ mTECs per thymus. (C) Representative contour plots depicting proportional changes in the Aire+ cTEC subpopulation with or without degarelix post-Cy treatment. (D) Proportion and number of Aire+ cTECs per thymus. Data presented as mean + SEM (n ≥ 3). * vs. Cy, + vs. UT. *p < 0.05, **p < 0.01, ***p < 0.001, ****p < 0.0001, ordinary two-way ANOVA with Sidak's multiple comparisons.
Figure 7
Figure 7
Phenotypic analysis of TEPC subsets in middle-aged female and male mice with degarelix treatment following Cy damage. (A) Representative contour plots depicting proportional changes in cTEClo subsets with or without degarelix post-Cy treatment. Antibodies against α6-integrin and Sca-1 were used to divide cTEClo into TEPC (α6hi Sca-1hi), Sca-1int cTEClo, and Sca-1lo cTEClo subpopulations. (B) Proportion of TEPC, Sca-1int cTEClo, and Sca-1lo cTEClo. (C) Proportion of Ki-67+ cells within cTEClo subsets. Data presented as mean + SEM (n ≥ 3). * vs. Cy, + vs. UT. *p < 0.05, **p < 0.01, ***p < 0.001, ****p < 0.0001, ordinary two-way ANOVA with Sidak's multiple comparisons.
Figure 8
Figure 8
Phenotypic analysis of mTEC progenitor subsets in middle-aged female and male mice with degarelix treatment following Cy damage. (A) Representative contour plots depicting proportional changes in mTEClo subsets with or without degarelix post-Cy treatment. Antibodies against α6-integrin and Sca-1 were used to segregate mTEClo into α6hi Sca-1himTEClo, Sca-1int mTEClo, and Sca-1lo mTEClo subpopulations. (B) Proportion of α6hi Sca-1hi mTEClo, Sca-1int mTEClo, and Sca-1lo mTEClo. (C) Proportion of Ki-67+ cells within mTEClo subsets. Data presented as mean + SEM (n ≥ 3). * vs. Cy, + vs. UT. *p < 0.05, **p < 0.01, ***p < 0.001, ****p < 0.0001, ordinary two-way ANOVA with Sidak's multiple comparisons.

References

    1. Mackall C, Fleisher T, Brown M, Magrath I, Shad A, Horowitz M, et al. . Lymphocyte depletion during treatment with intensive chemotherapy for cancer. Blood. (1994) 84:2221–8. - PubMed
    1. Galluzzi L, Buque A, Kepp O, Zitvogel L, Kroemer G. Immunological effects of conventional chemotherapy and targeted anticancer agents. Cancer cell. (2015) 28:690–714. 10.1016/j.ccell.2015.10.012 - DOI - PubMed
    1. Popa I, Zubkova I, Medvedovic M, Romantseva T, Mostowski H, Boyd R, et al. . Regeneration of the adult thymus is preceded by the expansion of K5+ K8+ epithelial cell progenitors and by increased expression of Trp63, cMyc and Tcf3 transcription factors in the thymic stroma. Int Immunol. (2007) 19:1249–60. 10.1093/intimm/dxm092 - DOI - PubMed
    1. Chidgey AP, Seach N, Dudakov J, Hammett MV, Boyd RL. Strategies for reconstituting and boosting T cell-based immunity following haematopoietic stem cell transplantation: pre-clinical and clinical approaches. Semin Immunopathol. (2008) 30:457–77. 10.1007/s00281-008-0140-5 - DOI - PubMed
    1. Fletcher AL, Lowen TE, Sakkal S, Reiseger JJ, Hammett MV, Seach N, et al. . Ablation and regeneration of tolerance-inducing medullary thymic epithelial cells after cyclosporine, cyclophosphamide, and dexamethasone treatment. J Immunol. (2009) 183:823–31. 10.4049/jimmunol.0900225 - DOI - PubMed

Publication types

MeSH terms

Substances