. 2020 Mar 5:11:54.
doi: 10.3389/fpls.2020.00054. eCollection 2020.

Winter Wheat Yield Response to Plant Density as a Function of Yield Environment and Tillering Potential: A Review and Field Studies

Affiliations

Winter Wheat Yield Response to Plant Density as a Function of Yield Environment and Tillering Potential: A Review and Field Studies

Leonardo M Bastos et al. Front Plant Sci. .

Abstract

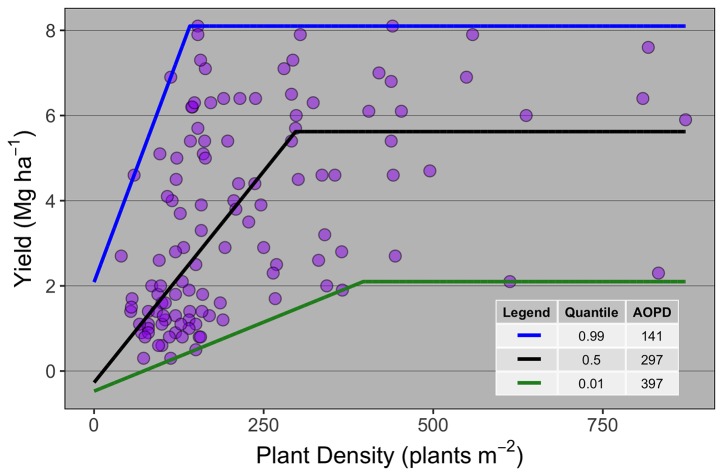
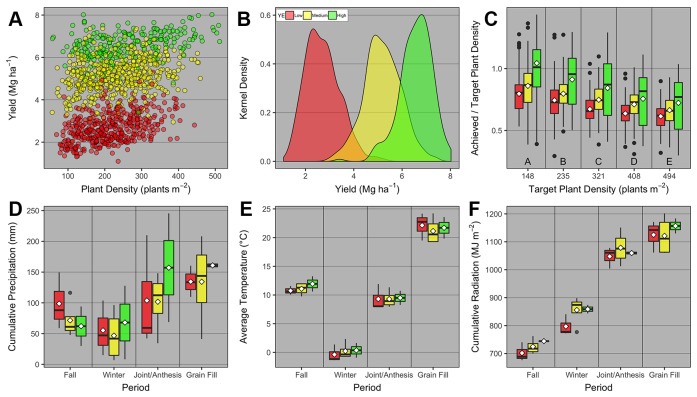
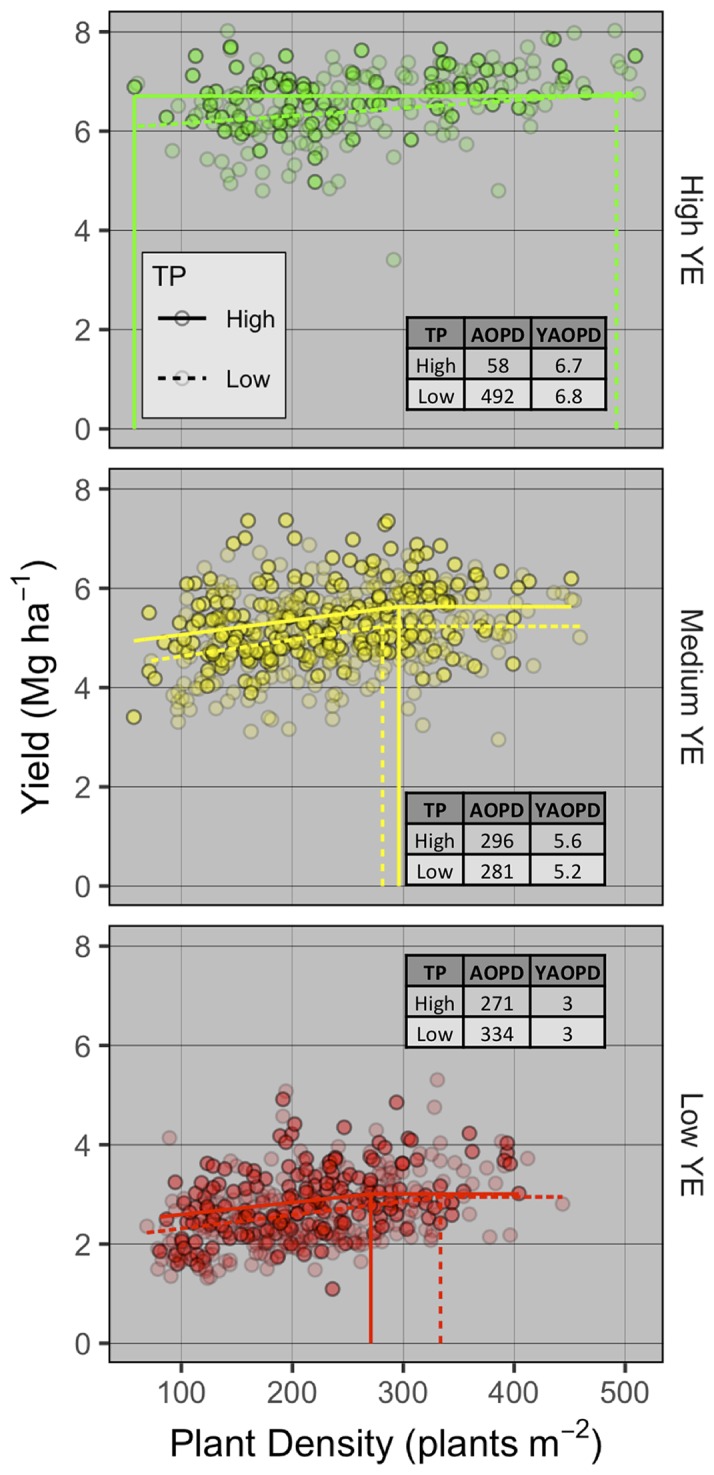
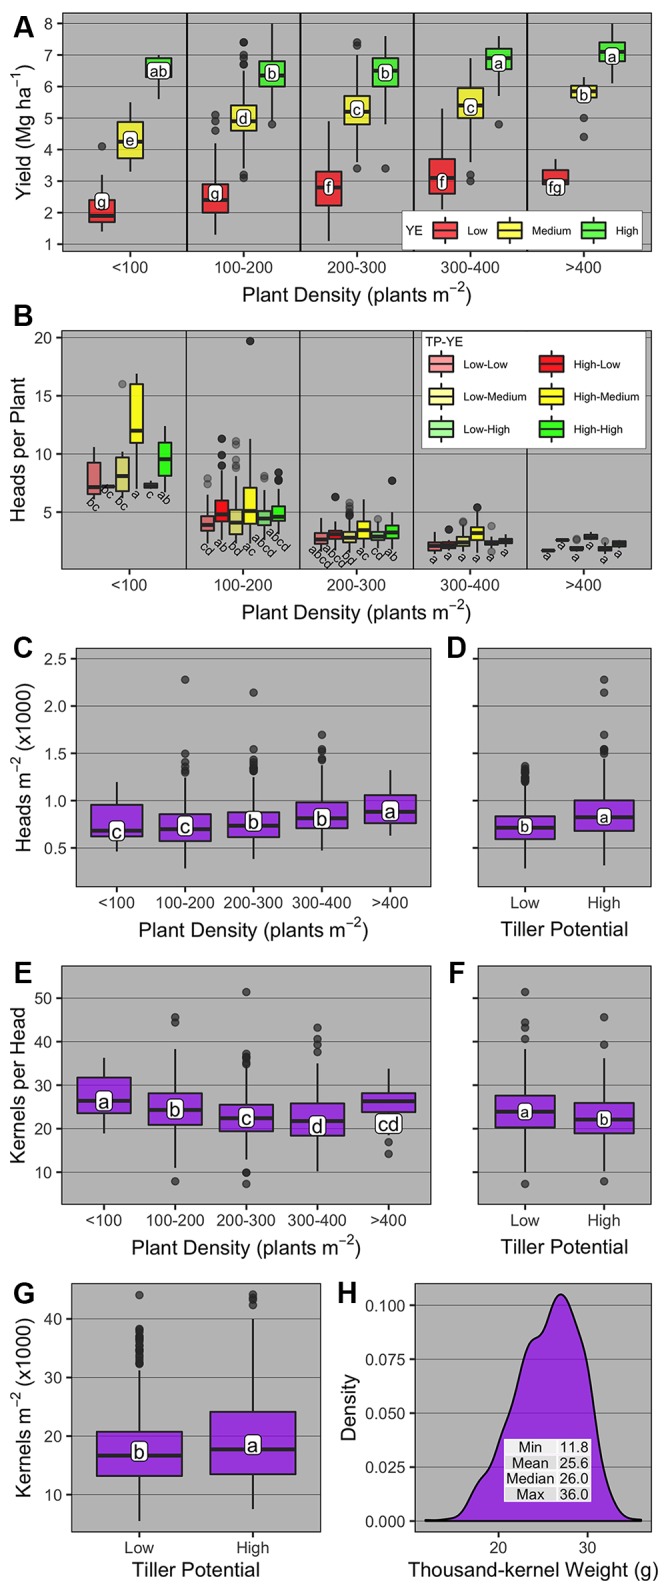
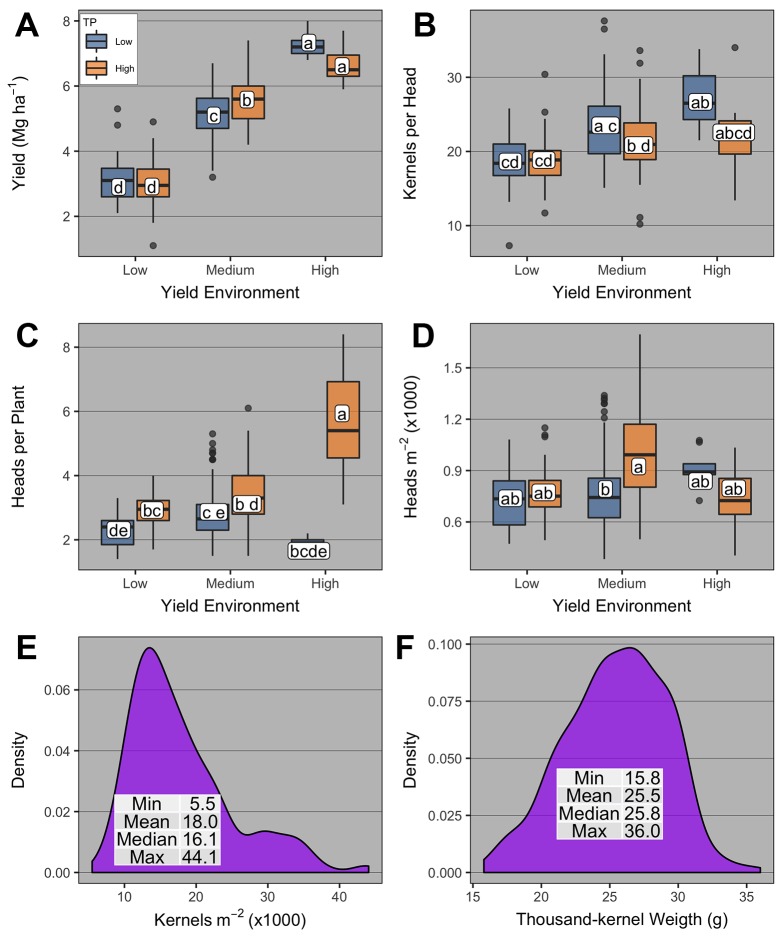
Wheat (Triticum aestivum L.) grain yield response to plant density is inconsistent, and the mechanisms driving this response are unclear. A better understanding of the factors governing this relationship could improve plant density recommendations according to specific environmental and genetics characteristics. Therefore, the aims of this paper were to: i) execute a synthesis-analysis of existing literature related to yield-plant density relationship to provide an indication of the need for different agronomic optimum plant density (AOPD) in different yield environments (YEs), and ii) explore a data set of field research studies conducted in Kansas (USA) on yield response to plant density to determine the AOPD at different YEs, evaluate the effect of tillering potential (TP) on the AOPD, and explain changes in AOPD via variations in wheat yield components. Major findings of this study are: i) the synthesis-analysis portrayed new insights of differences in AOPD at varying YEs, reducing the AOPD as the attainable yield increases (with AOPD moving from 397 pl m-2 for the low YE to 191 pl m-2 for the high YE); ii) the field dataset confirmed the trend observed in the synthesis-analysis but expanded on the physiological mechanisms underpinning the yield response to plant density for wheat, mainly highlighting the following points: a) high TP reduces the AOPD mainly in high and low YEs, b) at canopy-scale, both final number of heads and kernels per square meter were the main factors improving yield response to plant density under high TP, c) under varying YEs, at per-plant-scale, a compensation between heads per plant and kernels per head was the main factor contributing to yield with different TP.

Keywords: synthesis-analysis; tillering potential; wheat; yield components; yield environment.


Figures

Figure 1
Figure 1
Winter wheat grain yield response to plant density for data collected from 10 publications (n = 119). Each point represents the average yield at a given plant density as reported on the publication from which it was extracted. Different lines are the best-fit curve describing the agronomic optimum plant density (AOPD) at the 1st, 50th, and 99th quantiles.
Figure 2
Figure 2
Relationship between (A) winter wheat grain yield and plant density for low, medium, and high yield environments (YE); (B) kernel density distribution for grain yield at each YE; (C) achieved and target plant density ratio vs. target plant density for each YE; boxplots of (D) cumulative precipitation, (E) average daily temperature, and (F) cumulative daily radiation during different growing season periods [fall (Oct-Nov), winter (Dec-Feb), jointing/anthesis (Mar-Apr), grain filling (May-mid-June)] for each YE. Boxplots portray the 5th (lower whisker), 25th (bottom edge), 50th (solid black line), 75th (top edge), and 95th (upper whisker) quantiles, and mean (white diamond). On panel c, boxplots across different target plant density groups with the same letter are not statistically different (α = 0.05). On all panels, individual observations were either displayed (panel A), or summarized in the form of kernel density (panel b) or boxplots (panels C–F).
Figure 3
Figure 3
Winter wheat grain yield response to plant density and agronomic optimum plant density (AOPD) determination for different tillering potential (TP) groups (high as solid points and lines, low as transparent points and dashed lines) within the high (top), medium (intermediate), and low (bottom panel) yield environments (YE). Dashed lines are the AOPD estimates projected on the x-axis and YAOPD refers to the yield reached at the AOPD.
Figure 4
Figure 4
Boxplots of (A) winter wheat grain yield and yield components [(B) heads per plant; (C, D) heads m-2; (E, F) kernels head-1; (G) kernels m-2; and (H) thousand-kernel weight] as affected by plant density group (< 100, 100-200, 200-300, 300-400, and >400 plants m-2), yield environment (YE; high, medium, and low), and tillering potential (TP; high and low). On panel b, boxplots within the same plant density group with the same letter are not statistically different (α = 0.05). On all other panels, boxplots with the same letter are not statistically different across all levels shown in the panel (α = 0.05). Boxplots portray the 5th (lower whisker), 25th (bottom edge), 50th (solid black line), 75th (top edge), and 95th (upper whisker) quantiles.
Figure 5
Figure 5
Boxplots of (A) winter wheat grain yield and yield components [(B) kernels head-1; (C) heads per plant; (D) heads m-2; (E) kernels m-2; and (F) thousand-kernel weight] at the agronomic optimum plant density (AOPD) as affected by yield environment (high, medium, and low), and tillering potential (TP; high and low). Boxplots with the same letter are not statistically different across all levels shown in the panel (α = 0.05). Boxplots portray the 5th (lower whisker), 25th (bottom edge), 50th (solid black line), 75th (top edge), and 95th (upper whisker) quantile.
Figure 6
Figure 6
Growing season dynamics of fractional green canopy cover (A, C) and cumulative intercepted solar radiation during the growing season (B, D), for a low (A, B) and a medium (C, D) yield environment. Data represents the low tillering potential varieties sown at the lowest (150 seeds m-2) or highest (494 seeds m-2) seeding rates.
Figure 7
Figure 7
Relationship between (A) grain protein concentration and plant density as a function of genotype; (B) test weight and plant density as function of genotype; and (C) thousand-kernel weight and plant density as a function of genotype. Different line types represent slopes that were significantly different than zero (dashed) and not significantly different than zero (solid). At each panel, the y-intercept of regression lines followed by the same letter are not statistically different (α = 0.05).

References

    1. Anderson W., Barclay J. (1991). Evidence for differences between three wheat cultivars in yield response to plant population. Aust. J. Agric. Res. 42 (5), 701. 10.1071/AR9910701 - DOI
    1. Arduini I., Masoni A., Ercoli L., Mariotti M. (2006). Grain yield, and dry matter and nitrogen accumulation and remobilization in durum wheat as affected by variety and seeding rate. Eur. J. Agron. 25 (4), 309–318. 10.1016/j.eja.2006.06.009 - DOI
    1. Assefa Y., Vara Prasad P. V., Carter P., Hinds M., Bhalla G., et al. (2016). Yield responses to planting density for us modern corn hybrids: a synthesis-analysis. Crop Sci. 56 (5), 2802. 10.2135/cropsci2016.04.0215 - DOI
    1. Assefa Y., Carter P., Hinds M., Bhalla G., Schon R., et al. (2018. a). Analysis of long term study indicates both agronomic optimal plant density and increase maize yield per plant contributed to yield gain. Sci. Rep. 8 (1), 4937. 10.1038/s41598-018-23362-x - DOI - PMC - PubMed
    1. Assefa Y., Prasad P. V. V., Foster C., Wright Y., Young S., et al. (2018. b). Major management factors determining spring and winter canola yield in North America. Crop Sci. 58 (1), 1. 10.2135/cropsci2017.02.0079 - DOI

LinkOut - more resources